Archive for Sabermetrics

Eric Hosmer: Market Value and 2018 Projections

Hosmer certainly had his best season so far, with a 4.0 sWAR[1] and a .376 wOBA. Overall, consistency has not been there; over the past three years his offensive output has fluctuated, and that is something that can be said for his entire career. When looking at his offensive contribution, it seems that he has a “quality” season every other year. Nonetheless, Hosmer has been able to get on-base at an above-average rate of .359 OBP for the past three seasons. Also, he has managed to strike out (K%) at an average rate of 17.2% for the same period of time.

Moving forward, Hosmer’s offensive output for 2018 is projected[2] to see a slight decline. As previously mentioned, consistency is not his strength, and this should be reflected on his overall contribution for next year. A decline in wOBA (.351) from last year, alongside an increased K% (17.1%) will negatively impact his sWAR (2.6) in 2018.

Below you can find a detailed 2018 projection.

2018 Projections: Eric Hosmer
YEAR AGE sWAR wOBA OBP SLG OPS ISO AVG K% BB%
2015 25 2.7 0.355 0.363 0.459 0.822 0.162 0.297 16.2% 9.1%
2016 26 0.2 0.326 0.328 0.433 0.761 0.167 0.266 19.8% 8.5%
2017 27 4.0 0.376 0.385 0.498 0.883 0.180 0.318 15.5% 9.8%
2018 28 2.6 0.351 0.359 0.467 0.825 0.173 0.294 17.1% 9.2%

Projections: “SEG Projection System” (Including sWAR for 2015-2018)

sWAR = “SEG Projection System” calculation of WAR

Eric Hosmer’s estimated AAV is $21M, based on a five-year/$105M contract. He should be worth about 11.5 sWAR over the next five seasons. There has been a lot of noise regarding dollar amount and duration of contract. Going up to a seven-year agreement, he should be worth no more than $124M.

Market Value: Eric Hosmer

YEAR

AGE sWAR Value $WAR
2018 28 2.6 $21.8 $8.4
2019 29 2.6 $22.9 $8.8
2020 30 2.6 $23.9 $9.2
2021 31 2.1 $20.4 $9.7
2022 32 1.6 $16.3 $10.2
2023 33 1.1 $11.8 $10.7
2024 34 0.6 $6.7 $11.2
TOTAL 13.2 $123.8


sWAR = “SEG Projection System” calculation of WAR 

$WAR: Adjusted for Inflation (5% per year)


[1] sWAR = “SEG Projection System” calculation of WAR

[2] 2018 Projections: Eric Hosmer (SEG Projection System)


Lorenzo Cain: Market Value and 2018 Projections

After a strong 2017 (.347 wOBA, 4.1 sWAR[1]), Lorenzo Cain is one of the top remaining free agents. As a plus center fielder, defense is one of Cain’s greatest assets. On the other hand, Cain’s durability is a big question, having played just once over 140 games in a single season (2017). Injuries and age are both substantial concerns moving forward.

If able to stay healthy for at least 130 games in 2018, Cain is projected[2] to get on-base at an above-average rate (.356 OBP). Based on the projections, Cain should see a slight increase in both SLG and ISO from last year. Nonetheless, his wOBA should see a decrease in conjunction with an increase in K%. An overall decrease in offensive output will impact Cain’s sWAR (3.7) for 2018.

2018 Projections: Lorenzo Cain
YEAR AGE sWAR wOBA OBP SLG OPS ISO AVG K% BB%
2015 29 5.5 0.360 0.361 0.477 0.838 0.170 0.307 16.2% 6.1%
2016 30 2.7 0.322 0.339 0.408 0.747 0.121 0.287 19.4% 7.1%
2017 31 4.1 0.347 0.363 0.440 0.803 0.140 0.300 15.5% 8.4%
2018 32 3.7 0.330 0.356 0.443 0.798 0.145 0.298 16.9% 7.4%

Projections: “SEG Projection System” (Including sWAR for 2015-2018)

sWAR = “SEG Projection System” calculation of WAR  

Lorenzo Cain’s estimated AAV is around $21M per year, based on a four-year/$84M contract. He should be worth about 10 sWAR over the next three years. Staying healthy is crucial; as long as his speed does not drop dramatically, he should be able to significantly contribute for the next 2-3 seasons.

Market Value: Lorenzo Cain
YEAR AGE sWAR Value $WAR
2018 32 3.7 $31.2 $8.4
2019 33 3.2 $28.3 $8.8
2020 34 2.7 $24.9 $9.2
TOTAL 9.6 $84.4  
sWAR = “SEG Projection System” calculation of WAR 
$WAR Adjusted for Inflation (5% per year)

[1] sWAR = “SEG Projection System” calculation of WAR

[2] 2018 Projections: Lorenzo Cain (SEG Projection System)


Estimating Team Wins With Innings Pitched

Throughout the baseball season, I like to estimate teams wins, but I don’t do it in the traditional way. Some time ago, I discovered that I could use innings pitched to get a close estimate. Here’s what I do:

1) Take team games played and divide by 2;

2) Take the team’s innings pitched and subtract the team opponents’ innings pitched;

3) Add 1 and 2.

For example, the Washington Nationals, as of the All-Star break, have played 88 games. They have 789.33 IP, and their opponents have 781.33 IP. So I take 88 divided by 2, which gives me 44. Then I take 789.33 minus 781.33, which gives me 8. Then 44 plus 8 gives me an estimate of 52 team wins. Checking the standings, I see that Washington indeed has 52 wins.

How does my method compare with the traditional Pythagorean? (The Pythagorean method, of course, takes runs scored squared and divides by runs scored squared plus runs allowed squared.) I’ve set up some charts to demonstrate. First, let me present the relevant statistics for all teams as of the All-Star break (all statistics courtesy CBS Sportsline):

Team GP IP IPA R RA
Arizona 89 797 787 446 344
Atlanta 87 783 787.67 405 449
Baltimore 88 782.67 790.67 392 470
Boston 89 794.67 795 431 366
Chi. Cubs 88 785 787 399 399
Chi. White Sox 87 760.33 771.33 397 429
Cincinnati 88 781.67 786.67 424 463
Cleveland 87 768.67 763.67 421 347
Colorado 91 812.33 806.67 461 419
Detroit 87 762.67 766.67 409 440
Houston 89 800 784.33 527 365
Kansas City 87 775.33 775.67 362 387
L.A. Angels 92 817 824.33 377 399
L.A. Dodgers 90 806.33 786.67 463 300
Miami 87 771.67 777 410 429
Milwaukee 91 818.67 809.33 451 406
Minnesota 88 785.67 781 403 463
N.Y. Mets 86 773 775 406 455
N.Y. Yankees 86 768 765.33 477 379
Oakland 89 784 790.67 382 470
Philadelphia 87 775 790.33 332 424
Pittsburgh 89 800.67 802 378 403
San Diego 88 776.33 781 312 440
San Francisco 90 813.33 827.33 431 435
Seattle 90 800 797.67 354 453
St. Louis 88 798 793 402 389
Tampa Bay 90 805 802.33 428 412
Texas 88 783.67 783 444 415
Toronto 88 789 788.33 366 430
Washington 88 789.33 781.33 486 396

Now let me present a chart showing how many teams wins are predicted by my method and the Pythagorean method (for the Pythagorean method, I’m using 1.82 as my exponent, as shown by MLB on their Standings page):

Team EST W (IP) EST W (R) Actual W
Arizona 54.50 54.82 53
Atlanta 38.83 39.43 42
Baltimore 36.00 36.80 42
Boston 44.17 51.07 50
Chi. Cubs 42.00 44.00 43
Chi. White Sox 32.50 40.44 38
Cincinnati 39.00 40.48 39
Cleveland 48.50 51.07 47
Colorado 51.16 49.45 52
Detroit 39.50 40.61 39
Houston 60.17 58.84 60
Kansas City 43.16 40.86 44
L.A. Angels 38.67 43.63 45
L.A. Dodgers 64.66 61.90 61
Miami 38.17 41.71 41
Milwaukee 54.84 49.84 50
Minnesota 48.67 38.47 45
N.Y. Mets 41.00 38.56 39
N.Y. Yankees 45.67 51.87 45
Oakland 37.83 36.20 39
Philadelphia 28.17 33.97 29
Pittsburgh 43.17 41.91 42
San Diego 39.33 30.67 38
San Francisco 31.00 44.62 34
Seattle 47.33 35.07 43
St. Louis 49.00 45.32 43
Tampa Bay 47.67 46.56 47
Texas 44.67 46.70 43
Toronto 44.67 37.59 41
Washington 52.00 52.11 52

My method appears in the second column, and the Pythagorean method appears in the third column, with actual team wins in the last column. My method, as shown above, gives estimated wins directly. The Pythagorean method actually computes winning percentage. To get the estimated wins for the Pythagorean method, I multiplied the team’s estimated winning percentage by the team’s games played.

The methods are pretty close! On a couple of teams, though, the methods miss by a wide margin. I’m way off on the Angels, for example, while Pythagoras is off on the Giants. But which of these methods is closer overall? I did an r-squared between each of the estimated win columns and the actual wins and got these results:

RSQ (IP) RSQ (R)
0.8497 0.7147

Mine’s a little higher, but let’s use mean squared error (MSE) as a cross-check. Here are my numbers:

Team MSE (IP) MSE (R)
Arizona 2.25 3.33
Atlanta 10.05 6.61
Baltimore 36.00 27.05
Boston 33.99 1.15
Chi. Cubs 1.00 1.00
Chi. White Sox 30.25 5.94
Cincinnati 0.00 2.20
Cleveland 2.25 16.60
Colorado 0.71 6.53
Detroit 0.25 2.60
Houston 0.03 1.34
Kansas City 0.71 9.86
L.A. Angels 40.07 1.88
L.A. Dodgers 13.40 0.81
Miami 8.01 0.50
Milwaukee 23.43 0.03
Minnesota 13.47 42.61
N.Y. Mets 4.00 0.20
N.Y. Yankees 0.45 47.20
Oakland 1.37 7.82
Philadelphia 0.69 24.74
Pittsburgh 1.37 0.01
San Diego 1.77 53.77
San Francisco 9.00 112.82
Seattle 18.75 62.92
St. Louis 36.00 5.36
Tampa Bay 0.45 0.19
Texas 2.79 13.70
Toronto 13.47 11.61
Washington 0.00 0.01
AVG 10.20 15.68

I’m not a numbers person, so if I’ve made made errors in my calculations, please let me know, and I will never, ever trouble you fine readers again with another post. But I’ve published previous studies of both methods (in other places, under other names) and have found each time that my method edges out the Pythagorean in both r-squared and MSE.

If my method works at all, it’s because better teams typically have to get more outs to finish off their opponents. If the Dodgers, say, are at home against the Phillies, chances are they’re already winning when they go to the bottom of the ninth, and so the Dodgers don’t have to come to bat. That means the Dodgers had to get 27 outs and the Phillies had to get only 24. Conversely, on the road, if the Dodgers are leading the Phillies, the Phillies have to come to bat in the bottom of the ninth, and the Dodgers have to get the full 27 outs to end the game.

One caveat: my method tends to be more descriptive than predictive, so it’s a better measure of how a team has performed, not a good predictor of how a team will perform in the future. The Pythagorean method is much better as a predictive tool.

So there it is! My estimated team wins method. I hope you find it useful.


Prospect Watch: 5 Future All-Stars No One Is Talking About

I chose to stick with hitters in this article, because pitching prospects are extremely difficult to predict, and I think the pitchers who do get the hype are typically deserving. However, I do see a trend of some unnoticed hitting prospects turning out great careers in the majors. Let’s get right to it.

1. Travis Demeritte – 2B – ATL

In 2016, Demeritte went from the Rangers’ to the Braves’ system and spent the entire year in high-A ball, where he dominated at the plate. A 2B with power like Cano, good speed and the ability to get on base is such a rarity.

In my opinion, Demeritte has the highest chance of being a perennial All-Star out of these five prospects. The middle infield in Atlanta has an extremely bright future. I’m predicting that Demeritte will make his splash in 2018, and make his first ASG appearance by 2020 (age 25). Let’s look at his numbers from a season ago:


Name Age G AB PA H 2B 3B HR BB SO SB CS BB% K% OPS ISO wOBA wRC+
Travis Demeritte 21 145 547 635 145 33 13 32 78 200 20 4 12.3% 31.5% 0.905 0.283 0.393 139


Let’s compare these to the four All-Star 2B in 2016 and Brian Dozier.

Name G AB PA H 2B 3B HR BB SO SB CS BB% K% OPS ISO wOBA wRC+
Jose Altuve 161 640 717 216 42 5 24 60 70 30 10 8.4% 9.8% 0.928 0.194 0.391 150
Robinson Cano 161 655 715 195 33 2 39 47 100 0 1 6.6% 14.0% 0.882 0.235 0.37 138
Brian Dozier 155 615 691 165 35 5 42 61 138 18 2 8.8% 20.0% 0.886 0.278 0.37 132
Dustin Pedroia 154 633 698 201 36 1 15 61 73 7 4 8.7% 10.5% 0.825 0.131 0.358 120
Ian Kinsler 153 618 679 178 29 4 28 45 115 14 6 6.6% 16.9% 0.831 0.196 0.356 123


Some things to keep in mind as we compare these players: Demeritte was playing in A+ ball, but he did play an average of 12 less games than these major-leaguers. As you can see, it’s basically a two-man race (other than Dozier’s 42 HRs) between Altuve and Demeritte here. While we cannot expect these A+ ball numbers to translate directly against ML pitching, Demeritte definitely deserves more attention in top-prospect lists. While he’s not quite as speedy as Altuve, he has more power, and he walks at a far higher rate. The one glaring weakness is the K numbers for Demeritte. However, some of the top players in the league K at very high rates. As long as the OPS stays high, it doesn’t really matter how a guy makes outs anymore.

I should note that 2016 was a breakout year for Demeritte; in years past he didn’t quite live up to his potential, and also served an 80-game PED suspension. These could be the main reasons why he hasn’t garnered much attention yet. He still has to prove himself to most. However, I’m sold. I’d pencil him in for the majority of the 2020s’ ASGs right now.


2. Ramon Laureano – OF – HOU

Laureano has all the tools: he can play any OF spot well, he has speed and pop, and he gets on base. Houston’s farm has taken a bit of a hit due to some trades in the last two years, but that’s because they knew they had guys like Laureano who don’t have super high trade value, but have a chance to be great ML players like the guys they traded. Let’s look at Laureano’s 2016 numbers.

Name Age G AB PA H 2B 3B HR BB SO SB CS BB% K% OPS ISO wOBA wRC+
Ramon Laureano 21 128 461 555 146 32 9 15 73 128 48 15 13.2% 23.1% 0.943 0.206 0.418 159


The numbers speak for themselves. This is the making of a star; where is the hype? I know it’s not a huge sample size, and we don’t have much to go off from the previous year either, but in A+ and AA last year he put up those phenomenal numbers you see above.

If those aren’t All-Star numbers, then I don’t know what are. Laureano’s ability to play all three OF spots will keep him in the lineup everyday and help his chances of making it to the ASG. When he does get the call-up, if his numbers stay relatively close to this, there’s no way he doesn’t make three to four All-Star Games. As of now, he’s more of a speed threat, but as he develops, the speed/power combo will even out and he will be an Andrew McCutchen-type player. Keep tabs on this guy.


3. Christin Stewart – OF – DET

While researching Stewart, I couldn’t find an article more recent than September of 2015. There’s no one talking about him…why? As we know, Detroit is aging and looking to deal top players. So, I’m assuming we will be seeing a lot of opportunities for young guys to step up and prove themselves. Detroit’s system isn’t super deep, but that could change anytime if they do decide to move some key pieces. Regardless, I see Stewart as the prospect to watch moving forward; he has the tools to be an All-Star. Let’s check out his numbers from 2016.

Name Age G AB PA H 2B 3B HR BB SO SB CS BB% K% OPS ISO wOBA wRC+
Christin Stewart 22 147 514 622 132 29 2 31 93 154 4 2 15.0% 24.8% 0.883 0.245 0.407 156


The power is impressive, and by this chart he looks even a bit better than the two previous guys I mentioned. However, with the K numbers pretty high up there, and not a whole lot of speed, Stewart is a player that could fall into slumps. Often times, adjusting to the majors can be challenging, and some top prospects never quite figure it out. While Stewart’s MiLB numbers are pretty insane, his slump potential makes him a pretty risky pick here. However, I do believe that if he does indeed figure it out, he will make it to a few ASG and serve as an everyday player in this league for a decade. HRs and BBs get it done. Keep an eye on Stewart.


4. Jason Martin – OF – HOU

Another Houston OF prospect…another future All-Star? I think so. The future is certainly bright over at Minute Maid Park: Altuve is a cornerstone, Correa is a centerpiece, Springer is a baller, and they have prospects for days. If they can just figure out how to pitch, they could be a WS contender for the next eight years.

Why Martin, though? Let’s check out his 2016 numbers from high-A ball.

Name Age G AB PA H 2B 3B HR BB SO SB CS BB% K% OPS ISO wOBA wRC+
Jason Martin 20 121 431 502 114 25 7 23 63 112 22 12 12.5% 22.3% 0.874 0.251 0.382 131


Impressive, to say the least. At just 20 years old, he pumped out 23 homers in 121 games. He walks every eight at-bats, and he also grabbed 22 bags on the season. The ability to walk and run (lol) will typically keep guys out of major slumps. While Martin is not a highly-touted prospect at this point, I think he will be a household name by 2022. I expect him to get the call-up in 2019 and play a significant role during a pennant race that year. In 2020, he will burst onto the scene and prove his worth to this franchise.

With Houston’s current build, this might be a guy we see dealt if they are trying to add talent at the deadline this year. That doesn’t change my prediction, however. I see Martin suiting up for the ASG a few times throughout his career. Stay posted.


5. Tom Murphy – C – COL

You can’t keep putting Yadier Molina in there every year. And with Buster Posey most likely making that change to 1B full-time within three years, Jonathan Lucroy getting dealt to the AL, Kyle Schwarber playing OF, etc, pathways for guys like Tommy Murphy open up. Making the All-Star Game as a C is not saying as much as other positions, in my opinion. A decent hot streak in the first half will inflate your hitting numbers. For example, Derek Norris in 2014. It may seem like he was the best catcher in the league at the halfway point, but, as usual, it evened out by season’s end.

With that being said, Murphy has proven he has pop, and playing in Colorado is a huge advantage for him. While I don’t think he will be a Hall-of-Fame catcher, I do think he’s flying under the radar right now and will probably open some eyes in 2017. I’d say he makes two appearances in the ASG before 2022. However, once he gets up near 30 and he’s no longer playing in Colorado, I think he will have trouble keeping a job.

I have him on the list, first of all, because he meets the criteria, and also because I think people should pay attention to him, and lastly because he’s ML-ready, unlike the rest of these guys. Trevor Story didn’t have a whole lot of hype; most people didn’t expect him to make the team out of spring, but with the Jose Reyes situation, the kid got a shot and as we all know, he ran with it. I’m not saying Murphy will make a cannonball-esque splash like Story, but I think he will turn some heads and maybe even get some ASG votes this year. Anything can happen, especially in Colorado. Keep tabs on him.

Honorable Mentions

Dylan Cozens – OF – PHI

There’s not a lot of buzz surrounding Cozens, which is surprising to me, because usually when we see 40 HR in 134 games, we really perk up. In his age-22 season, he played all 134 games at the AA level for the Phillies affiliate, Reading Fightin’ Phils, a place where most Phillies prospects prosper. The reason why Cozens doesn’t quite make the cut here is because of the words, “future All-Star.” He is one of those lefties that mash in the right ballpark and against RHP, but usually career platoon hitters, even if they are highly effective, don’t make the ASG.

Rhys Hoskins – 1B – PHI

Hoskins is another AA player in the Phillies system. He probably has a little bit more of a well-rounded hitting ability than does Cozens, but he’s a 1B, and that’s an overloaded position. You have to be incredible to crack that ASG squad, and I just don’t think Hoskins will ever be quite at that level. I do believe he will pan out to be an everyday guy for a good amount of time in this league. He has really good power and he gets on base, two things that will keep you in the lineup more often than not.

Bobby Bradley – 1B – CLE

Bradley is another guy I would keep an eye on; I’m just not sold on him yet. He has a a lot of raw power, but a really high K rate in the low levels of the minors. Also, he’s a 1B, so once again, really hard to make the ASG at that position.


dSCORE: Pitcher Evaluation by Stuff

Confession: fantasy baseball is life.

Second confession: the chance that I actually turn out to be a sabermetrician is <1%.

That being said, driven purely by competition and a need to have a leg up on the established vets in a 20-team, hyper-deep fantasy league, I had an idea to see if I could build a set of formulas that attempted to quantify a pitcher’s “true-talent level” by the performance of each pitch in his arsenal. Along with one of my buddies in the league who happens to be (much) better at numbers than yours truly, dSCORE was born.

dSCORE (“Dominance Score”) is designed as a luck-independent analysis (similar to FIP) — showing a pitcher might be overperforming/underperforming based on the quality of the pitches he throws. It analyzes each pitch at a pitcher’s disposal using outcome metrics (K-BB%, Hard/Soft%, contact metrics, swinging strikes, weighted pitch values), with each metric weighted by importance to success. For relievers, missing bats, limiting hard contact, and one to two premium pitches are better indicators of success; starting pitchers with a better overall arsenal plus contact and baserunner management tend to have more success. We designed dSCORE as a way to make early identification of possible high-leverage relievers or closers, as well as stripping out as much luck as possible to view a pitcher from as pure a talent point of view as possible.

We’ve finalized our evaluations of MLB relievers, so I’ll be going over those below. I’ll post our findings on starting pitchers as soon as we finish up that part — but you’ll be able to see the work in process in this Google Sheets link that also shows the finalized rankings for relievers.

Top Performing RP by Arsenal, 2016
Rank Name Team dSCORE
1 Aroldis Chapman Yankees 87
2 Andrew Miller Indians 86
3 Edwin Diaz Mariners 82
4 Carl Edwards Jr. Cubs 78
5 Dellin Betances Yankees 63
6 Ken Giles Astros 63
7 Zach Britton Orioles 61
8 Danny Duffy Royals 61
9 Kenley Jansen Dodgers 61
10 Seung Hwan Oh Cardinals 58
11 Luis Avilan Dodgers 57
12 Kelvin Herrera Royals 57
13 Pedro Strop Cubs 57
14 Grant Dayton Dodgers 52
15 Kyle Barraclough Marlins 50
16 Hector Neris Phillies 49
17 Christopher Devenski Astros 48
18 Boone Logan White Sox 46
19 Matt Bush Rangers 46
20 Luke Gregerson Astros 45
21 Roberto Osuna Blue Jays 44
22 Shawn Kelley Mariners 44
22 Alex Colome Rays 44
24 Bruce Rondon Tigers 43
25 Nate Jones White Sox 43

Any reliever list that’s headed up by Chapman and Miller should be on the right track. Danny Duffy shows up, even though he spent most of the summer in the starting rotation. I guess that shows just how good he was even in a starting role!

We had built the alpha version of this algorithm right as guys like Edwin Diaz and Carl Edwards Jr. were starting to get national helium as breakout talents. Even in our alpha version, they made the top 10, which was about as much of a proof-of-concept as could be asked for. Other possible impact guys identified include Grant Dayton (#14), Matt Bush (#19), Josh Smoker (#26), Dario Alvarez (#28), Michael Feliz (#29) and Pedro Baez (#30).

Since I led with the results, here’s how we got them. For relievers, we took these stats:

Set 1: K-BB%

Set 2: Hard%, Soft%

Set 3: Contact%, O-Contact%, Z-Contact%, SwStk%

Set 4: vPitch,

Set 5: wPitch Set 6: Pitch-X and Pitch-Z (where “Pitch” includes FA, FT, SL, CU, CH, FS for all of the above)

…and threw them in a weighting blender. I’ve already touched on the fact that relievers operate on a different set of ideal success indicators than starters, so for relievers we resolved on weights of 25% for Set 1, 10% for Set 2, 25% for Set 3, 10% for Set 4, 20% for set 5 and 10% for Set 6. Sum up the final weighted values, and you get each pitcher’s dSCORE. Before we weighted each arsenal, though, we compared each metric to the league mean, and gave it a numerical value based on how it stacked up to that mean. The higher the value, the better that pitch performed.

What the algorithm rolls out is an interesting, somewhat top-heavy curve that would be nice to paste in here if I could get media to upload, but I seem to be rather poor at life, so that didn’t happen — BUT it’s on the Sum tab in the link above. Adjusting the weightings obviously skews the results and therefore introduces a touch of bias, but it also has some interesting side effects when searching for players that are heavily affected by certain outcomes (e.g. someone that misses bats but the rest of the package is iffy). One last oddity/weakness we noticed was that pitchers with multiple plus-to-elite pitches got a boost in our rating system. The reason that could be an issue is guys like Kenley Jansen, who rely on a single dominant pitch, can get buried more than they deserve.


2016 Cubs Run Differential

In this post, I take a look at the 2016 Chicago Cubs though their first 100 games. I’ll start out by focusing on the Cubs’ run differential (Runs Scored – Runs Allowed). After a historic start, they reached their pinnacle after the 67th game of the year against the Pirates. At this point, the Cubs were 47-20 and had outscored opponents by 171 runs! Since then, the ball club is 13-20 and their current run differential is at +153.

Still, the Cubs’ +153 mark is 42 runs better than the next-closest team (Washington Nationals). The Cubs and Nationals are the only clubs to have a run differential that is greater than +100. The second-place Cardinals rank third in the league at +95 right now. While the Cubs dominate the top end of the spectrum, the Reds and Braves are running away with the worst run differentials in the league. The Reds have a -143 mark, largely due to the thrashings they have taken at the hands of the Cubs so far in 2016. The Braves have the second-to-worst differential at -134 runs.

Projected Runs to Wins

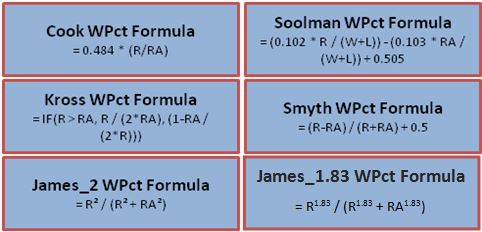
In another place, I introduced the “Pythagorean Theorem’s of Baseball” which basically tries to determine the number of games a team will win based on their number of runs scored and number of runs allowed. Here are the formulas for six of the most common win-percentage projection formulas:

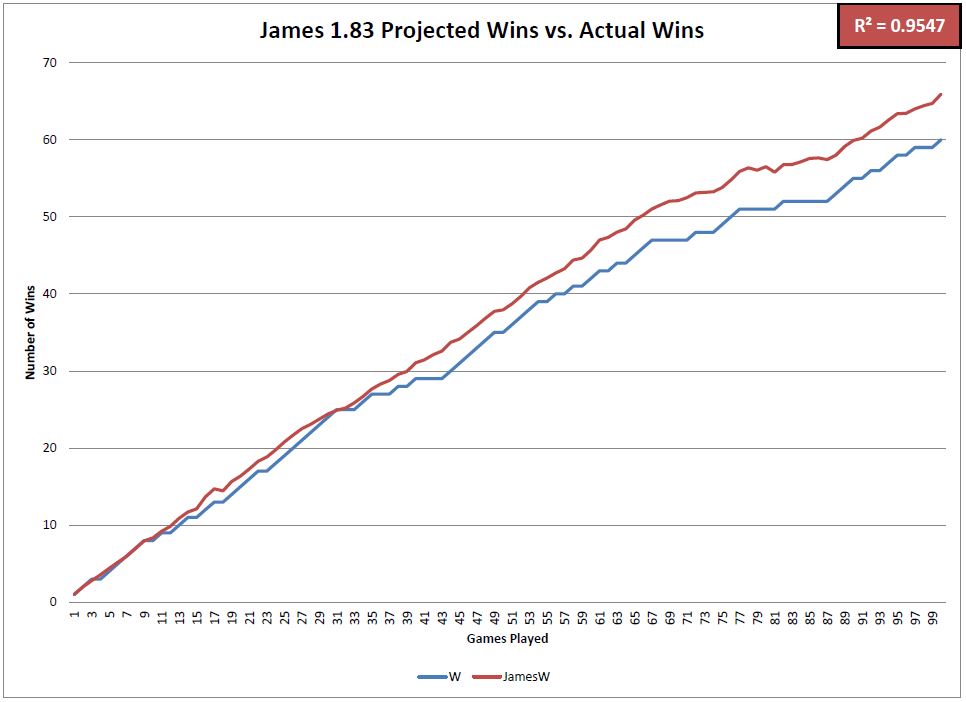
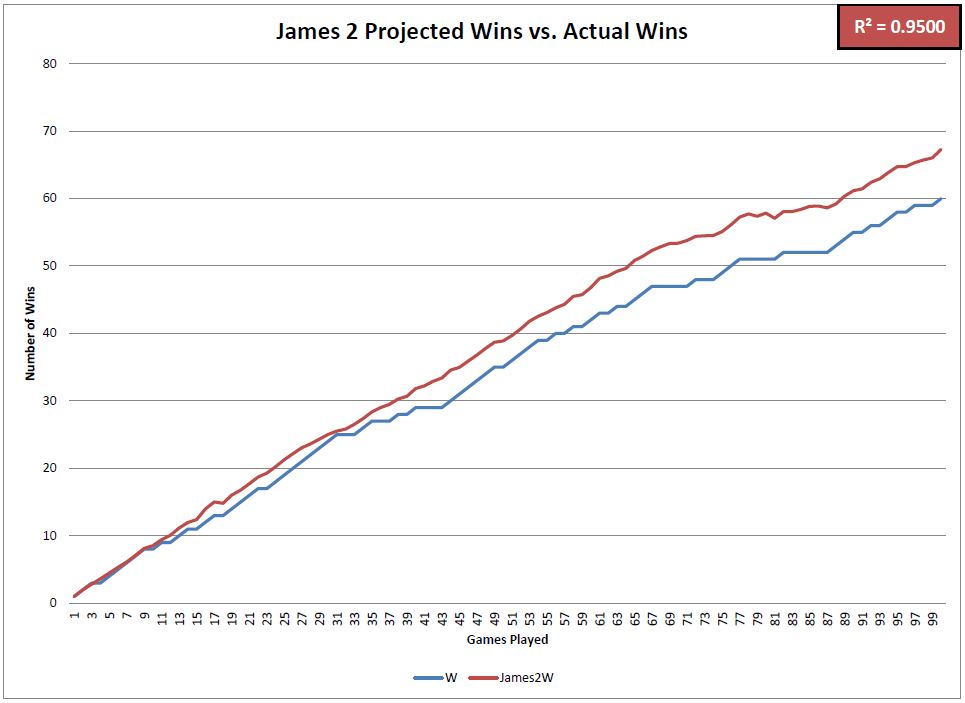
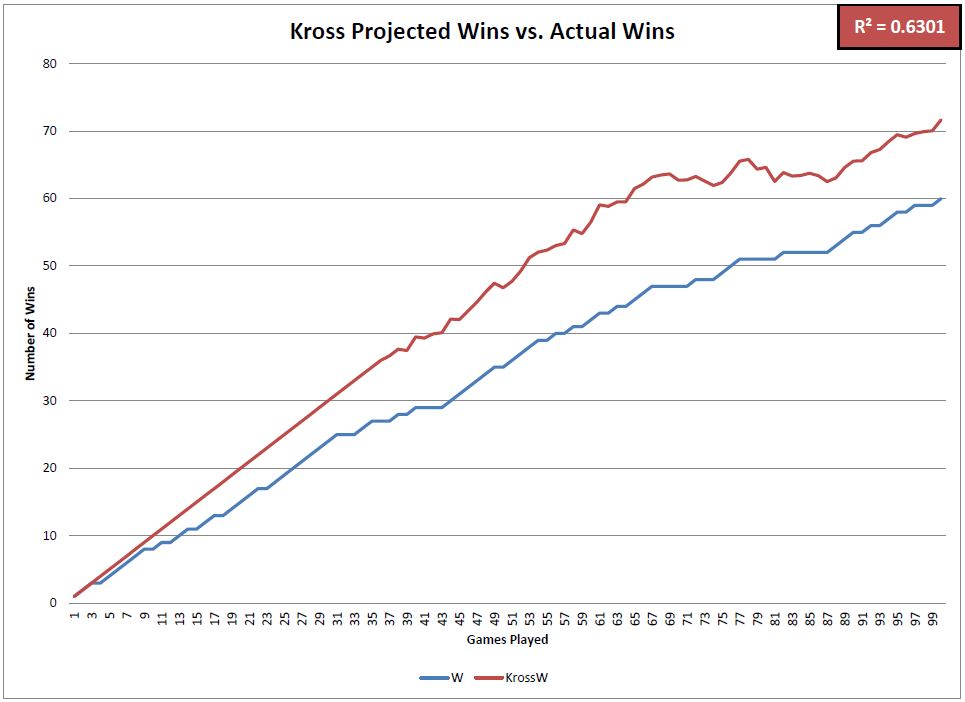
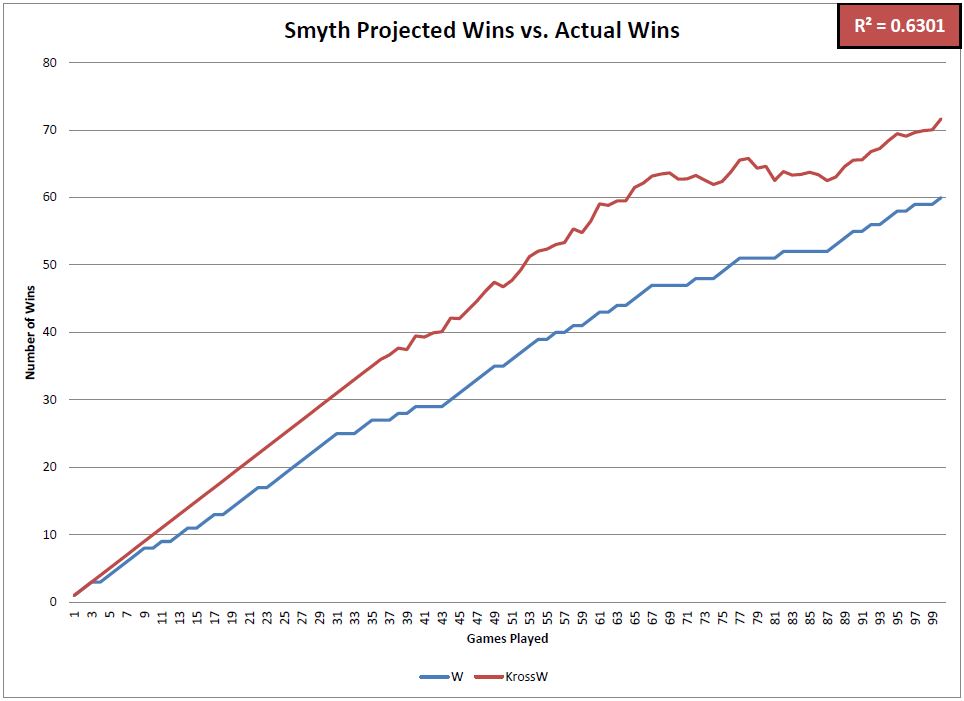
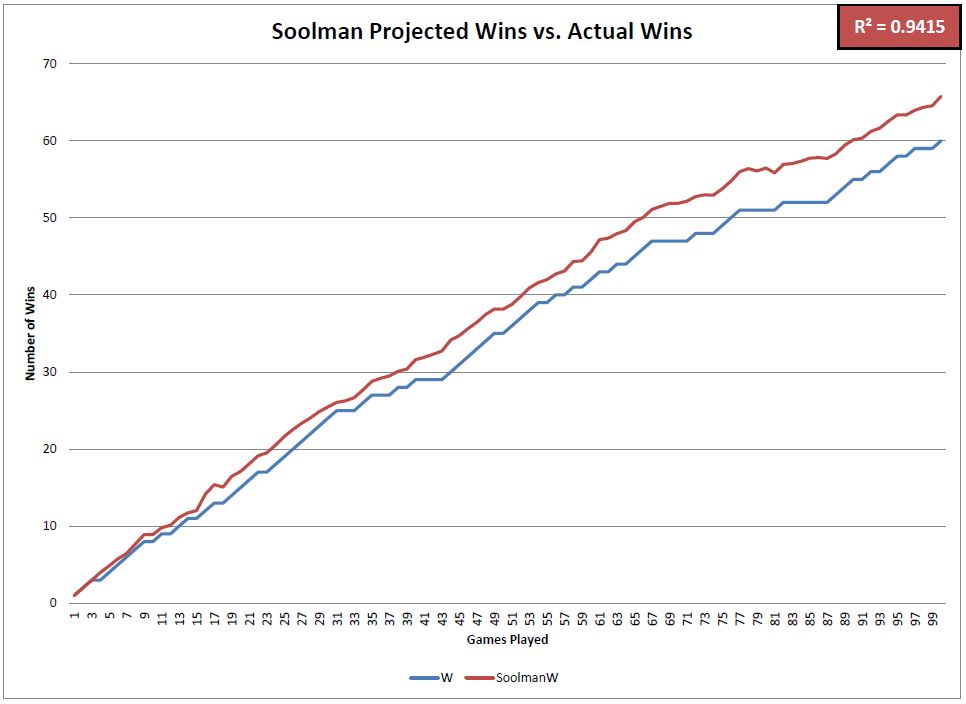
I added up the Cubs’ total runs scored and total runs allowed after each game this year and compared their actual number of wins to the projected number of wins based on each formula. These charts visualize the differences between those numbers.

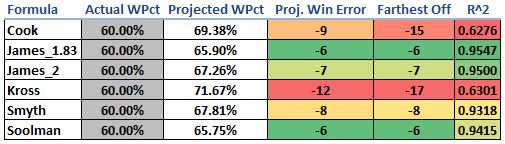
This matrix summarizes how accurate each of the projection formulas has been in predicting the Cubs’ winning percentage and total number of wins so far in 2016. The most accurate formulas was the James_1.83 followed by the James_2 and Soolman. Four of the six formulas were very good predictors, but the Cook and Kross formulas overforecasted the number of wins that they expected the Cubs to have. Notice that at one point this year, each of those formulas projected the Cubs to have over 15 more wins than they actually had. The R^2 value (coefficient of determination) is indicative of how well the projected win percentage matched up to the actual win percentage after each game this season.

All in all, the Cubs have should have at least six more wins this year based on these formulas. Scoring as many runs as they have (4th most in the MLB) and allowing as few runs as they have (T-1st in the MLB) should result in an even better record than 60-40. We knew it was unlikely that they would keep up their record-setting start in the run-differential category, but it will be interesting to see how these numbers match up as the season progresses.

@CubsAdvMetrics on Twitter


The WIS Corollary

Interestingly enough, one of the major postwar genres of Anglo-American literature was the academic comedy. Popularized in large part by Philip Larkin and the “Movement,” authors strove to poke fun at academic institutions and the conventions followed by the terrifically aloof professors. The most famous novel to fall into this genre is Lucky Jim by Kingsley Amis. The book features Jim Dixon, a poverty-stricken pseudo-pedant with a probationary position in the history department of a provincial university. A veritable alcoholic, Dixon attempts to solidify his position by penning a hopelessly yawn-inducing piece entitled “The Economic Influence of the Developments in Shipbuilding Techniques, 1450 to 1485.” Short novel made shorter, it doesn’t help him retain his position, but it does succeed in illustrating the banal formalities that academic writing necessitates.

In sabermetrics, there is a heavy reliance on sometimes inscrutable jargon, acronyms that sound like baby words (“FIP!”), and Mike Trout’s historical comps (Chappie Snodgrass is not a very good one in case anyone is wondering) that quite understandably renders the average fan mildly frustrated and the average fan over sixty wondering how we will ever make baseball great again. Typically, I enjoy those articles very much because they communicate news efficiently and analytically. Occasionally, however, articles stray into the Jim Dixon range of absolute obscurity, examining the baseball equivalent of “Shipbuilding Techniques,” whatever that may be. Such writings form the cornerstone of sabermetrics as they mesh history, theory, and sometimes economics.

Fortunately or unfortunately, my article today isn’t quite Dixon-esque, but it retains some of that style’s more tedious elements. It falls more closely into the category of two-minute ESPN quick sabermetric theory update. I don’t think that’s a thing. Seemingly pointless introduction aside, please consider what you know about DIPS theory. I won’t insult your intelligence, but it was developed by Voros McCracken at the turn of the millennium and has served as one of the principal tenets of the pitching side of sabermetrics ever since then. The theory, in its most atomic form, essentially posits that pitchers should be evaluated independently of defense because it’s something they cannot control. Hence “defense-independent pitching statistics.”

Certainly, it was a revolutionary concept and one that has even gained quite a bit of traction in the mainstream sports media. Announcers talk about how a certain pitcher would look a lot better pitching in front of, say, the Giants instead of the Twins. Metrics like xFIP only serve to quantify that idea.

But every grand theory or doctrine (DIPS is essentially sabermetric doctrine at this point) requires a corollary to frame it. And so I propose something I like to call the “WIS Corollary to DIPS,” where WIS stands for Weather Independent Statistics. The natural extension of evaluating pitcher performance independently of defense is to evaluate players independently of weather because it also exists outside of player control.

The basic idea of this is that weather plays enough of a role in enough games to superficially alter the statistics of players such that they cannot be accurately and precisely compared with the other players in the league because all of them face different environmental conditions. Taking that into consideration, all efforts must be made to strip out the effects of weather when making serious player comparisons. Coors Field is why Colorado performances are regarded with such skepticism, while the nature of San Francisco weather and AT&T Park is supposedly why that location serves as an apt environment for the development of pitchers.

Think about it — it’s something we already do. We look at home/road splits, we evaluate park factors, we try and put players on +/- scales. We talk about this constantly even at youth games. I have heard parents say many times, “If only the wind hadn’t been blowing in so hard he might have hit the fence.” It’s honestly a commonly held, yet generally unquantified, notion that the general public has.

Player X hits a blooper at Stadium C that falls in front of the left fielder for a hit. Player Y hits a blooper at Stadium D with the exact same exit velocity and launch angle as Player X’s ball, but it carries into the glove of an expectant left fielder. Should Player X really get credit for a hit and Player Y for an out? Basically all statistics, striving to communicate objective information, would say yes. If this kind of thing happens enough times over the course of a season, it can make a significant difference. A couple of fly balls that leave the park instead of being caught at the fence would put a dent in a pitcher’s ERA, while changing a player’s wRC+ by no small sum.

For that reason, players should be measured as if they play in a vacuum. One of the biggest goals of sabermetrics is to isolate player performance in order to evaluate him independently of variables he cannot necessarily control. Certainly, this has some far-reaching consequences if the idea gets carried out to its natural conclusion. Someone would likely end up developing a model that standardized stadium size, defensive alignment for varied player types, and other things of that nature. I’m not necessarily advocating for that, just for stripping out the effects of weather.

WIS by itself isn’t radical, but the extent to which it’s applied could be considered as such. As of now, it’s something consciously applied a relatively small portion of the time, but I think that it’s something that should be considered as much as possible. Obviously, there are issues with this. You can’t very well modify “raw” statistics like batting average or ERA so that they reflect play in a vacuum. What you could conceivably do is create a rather complicated model that requires a complicated explanation in order to describe how the players should have performed. And that’s something which brings us to an important point; the metrics that would employ this information would not be for the average fan; rather, they would be aimed at the serious analyst.

This is something I’ve already tried to employ with a metric I created called xHR, which uses the launch angle and exit velocity of batted balls to retroactively predict the number of home runs a player should have hit. The metric is still in development, but I think it’s something that works relatively well and can be applied to other types of metrics. For instance, an incredibly complex and comprehensive expected batting average could utilize Statcast information to determine whether a given fly ball would have been a hit in a vacuum based on fielder routes and the physics of the hit. By no means am I trying to assert that I have all, if any, of the answers. The only thing I’m trying to do here is to bring debate to a small corner of the internet regarding the proper way to evaluate baseball players.

Probably the most crucial thing to understand here is that the point of sabermetrics is to accurately and precisely evaluate players in the best possible way. Sabermetricians already do an incredible job of doing just that, but perhaps it’s time to take things a step further in the evaluation process by developing metrics that put performances in a vacuum. I know that baseball doesn’t happen in a void, but the best possible way to compare players is to measure them* as if they do.

WIS Corollary — One must strip out the effects of weather on players in order to have the most accurate and precise comparison between them.

*Oftentimes it’s necessary to compare players while including uncontrollable factors, like sequencing, especially when doing historical comparisons. It’s important to note that the WIS Corollary is applicable only in very specialized situations, and would generally go unused.


David Price Is About to Go Off

View post on imgur.com

On June 25, this was David Price’s tweet to family, friends and fans.  It was a clear signal that he knew the patience of the Boston fans and media was wearing thin.

Fast forward to the All-Star break and his “Made for TV” stats (those that casual fans know best) are underwhelming: a 9-6 record with a 4.34 ERA, which is worse than the MLB average of 4.23.  It’s not so much his ERA that’s the problem to fans, but more his inability to be consistent from start to start.  Price has three starts of six-plus innings allowing two or fewer runs, but also has four starts of allowing six or more runs.  With the rest of the rotation producing an atrocious 4.86 ERA, the Sox desperately needed Price to be the one to stop the bleeding, something he hasn’t been able to do.  But that doesn’t mean his underlying skills have deteriorated and all of a sudden he’s become a league-average pitcher.  In fact, the advanced metrics say he’s been extremely unlucky and that he’s due for a big second half. 

View post on imgur.com

* Rank is solely being used to establish a baseline for Price as a top 10 pitcher.

In 2014 and 2015 combined, Price was ranked in the top 10 of all pitchers in four of the skill-based statistics: K%, BB%, xFIP and SIERA (the latter two being ERA estimators with a weighting towards more pitcher-controlled outcomes).  Through the 2016 All-Star break, Price has maintained or improved his top-10 rank in K%, xFIP and SIERA but dropped a few spots in walk rate.  Despite the move from 9th to 10th in K% rank, his K rate is actually up from 26.2% to 27.1%.  The reason for the drop in rank is that 2016 newcomers to the list Jose Fernandez, Noah Syndergaard and Drew Pomeranz did not meet the minimum innings qualifier for the 2014/2015 combined list.  On the flip side, Price’s xFIP and SIERA are higher than they were the past two years, but he has improved his ranking versus his peers.  This is because xFIPs and SIERAs are both up 10% league-wide versus last year (due to all the home runs being hit) while Price’s increases are smaller.

So what is happening?  If his base skills are fine, why is his ERA so high and his performance so inconsistent?

View post on imgur.com

So everyone is familiar with ERA and can easily infer that 4.34 is no bueno for a $217-million pitcher.  But there is a reason these stats are labeled “Non Skill-Based” — that’s because these stats are influenced by factors outside of the pitcher’s direct control (defense, luck, sequencing, variance, etc…) and therefore have wide variability over small samples.  Three of these stats (HR/FB%, BABIP and LOB%) explain why David Price is a great rebound candidate for the second half.

HR/FB%

Price’s current HR/FB (home runs per fly ball) rate is 15.2% — which is good for being ranked 76th out of 97 qualified starting pitchers.  The past two years combined he ranked 19th.  To put this in context, Price’s career average is 9.4% while the 2016 league average is 12.9%.  Price has never recorded a full season (>150 IP) HR/FB rate higher than 10.5%.  Also, on balls hit into play against Price this year, 31.3% of them are fly balls, the second-lowest rate of his career.  The only season in which he allowed a lower fly ball rate was in 2012 when he won the AL Cy Young award.  Price is giving up fewer fly balls this year, but of the fly balls he is allowing, they are going over the fence at the highest rate of his career.  Those that remember Price giving up a HR in 10 consecutive starts this year are nodding violently right now.  His HR/FB% will regress towards his career norm (9.4%) and this should be the main reason for a big second half.

BABIP

Price is also suffering from an unsustainable BABIP (batting average on balls in play).  His current mark of .321 is well above his career rate (.289) and even above his highest full-season rate (.306).  Once a ball is put into play it is out of the pitcher’s control what happens from there.  This is why defense and luck influence this stat more than skill.  And with that said, statistical outliers here tend to regress towards career norms.  Even though Price is allowing ground balls at a higher rate than the past two years, his 2016 GB% is still lower than his career average.  BABIP can be influenced by the number of ground balls a pitcher allows, but he’s not allowing vastly more than his career average.  His BABIP should have some positive regression in it, which is another predictor of improved second-half performance.

LOB%

Price’s Left-On-Base% (percentage of runners a pitcher strands over the course of a season) is currently 70.9%, which is also below his career rate (74.7%) and would be his second worst full-season rate (70.0%) if the season ended today.  Similar to HR/FB%, he is ranked 73rd out of 97 qualified starting pitchers.  The past two years he ranked 22nd.  A pitcher with a higher than average strikeout rate should be able to sustain a slightly higher than average LOB%, but it’s playing out the exact opposite way for Price.  This is partly due to his inflated BABIP and HR/FB%; as these statistics continue to regress towards his career norms, the LOB% will creep up to expected levels.


Much has been made of Price’s velocity being down this year compared to any point in his career.  At the start of the season, his velocity was over 2.0 MPH lower than his career average (94.1).  He has since closed this gap almost entirely.  Here is his average fastball velocity by month (with number of starts):

April: 92.0 (5)

May: 92.5 (6)

June: 92.9 (6)

July: 94.0 (2)

If this upward trend in velocity stabilizes somewhere at or above 93.5, then nearly all the performance metrics within his control — velocity, K%, BB%, xFIP and SIERA — will be at or near his career norms.

Let’s dive a little deeper into that early-season velocity issue.  Below are two charts.  The first shows combined performance of 2014 and 2015 for ERA-qualifying starters while the second chart is the same data for the 2016 season through the All-Star break.  The orange circle is David Price.  The red circle (if shown) represents Price’s career average.  The blue circles are a hand selected peer group of the top 10 pitchers in the game (Kershaw, Sale, Arrieta, Scherzer, Bumgarner, Greinke, Strasburg, Syndergaard, Salazar and Fernandez).  Remember those rankings where Price was right around the top 10 — these are the guys usually outperforming him.  The gray circles represent everyone else.  Note: For these first two charts the top-right quadrant is Good, and the bottom-left quadrant is Bad (unless you’re a knuckleballer).

2014-2015 K/9 vs FBv

View post on imgur.com


2016 K/9 vs FBv

View post on imgur.com

The first graph shows David Price clustered where you would expect him — right at the middle-to-bottom of his top-10 peer group, with a healthy average fastball velocity and K/9.  The second graph (2016) shows Price in a similar relationship to his peers, but with slightly lower velocity and a higher K/9.  Note the gap between the orange (Price’s 2016) and red (Price’s career average) dots depicting his improved strikeout numbers this year despite the slightly lower velocity.  This graph also shows what freaks Noah Syndergaard, Jose Fernandez and (to a lesser degree) Jered Weaver are.

The final two graphs show the relationship between ERA and xFIP where xFIP is the more predictive estimator of a pitcher’s skill.  The bottom-left quadrant is Good (think Kershaw) and the upper-right quadrant is Bad (think Buchholz).  Anyone in the upper-left quadrant (Price in 2016) is a candidate for positive regression.

2014-2015 ERA vs xFIP

View post on imgur.com


2016 ERA vs xFIP

View post on imgur.com

The first graph again shows Price in his usual place — at the tail end of the top 10.  In 2014 and 2015 combined he had a very similar ERA (2.88) and xFIP (2.98).  The second graph (2016) shows the disparity between his ERA (4.34) and xFIP (3.16).  Pitchers with this large of a gap between ERA and xFIP are great candidates for regression.  The important takeaway is that his xFIP, relative to his peers, has stayed in that top-10 range.  This supports the point that some bad luck is the main element depressing his ERA.

David Price can easily be the best pitcher in the American League over the next two and a half months.  He already owns the lowest xFIP in the AL at 3.16 — the next-closest is Corey Kluber, at 3.34.  The skills above show he can sustain the xFIP level, but with some change in luck and maintaining his improved velocity, he doesn’t need to “pitch better”; he just needs to keep pitching — and the results will follow.


Will the Real Tyler Goeddel Please Stand Up?

Similarly to a large portion of the FanGraphs community, I am a Philadelphia Phillies fan.  I was born in South Jersey just 20 minutes away from the stadium and grew up watching every game.  I was there for the tough times in the late 90’s / early 2000’s, and I was there for the glory days of 2007-2011.  After an abysmal last few seasons of baseball in Philadelphia, we have finally seen some promise this season leading us to believe that better days are coming soon.  One of the bright spots on the team so far this year has been Rule 5 pick, Tyler Goeddel.

After being selected in the first round of the 2011 MLB Rookie Draft, Tyler Goeddel began his professional career with the Tampa Bay Rays.  Goeddel was drafted out of high school as a third baseman and for the first three years of his minor league career that would be the only position he played.  In 2015, however, the Rays decided to move Goeddel to the outfield.  His athleticism allows him to play all three outfield positions and that type of versatility is very sought after by big league clubs.  While defense was never his problem, Goeddel’s bat didn’t develop as quickly as the Rays had hoped.  He was a career .262 hitter with 31 home runs across four full seasons in the minor leagues.  Ultimately the Rays made a tough decision and left him off their 40-man roster, knowing there was a great chance another team would select him in the Rule 5 Draft.  Shortly after, the Phillies did just that and selected Goeddel with the first overall pick of the 2015 Rule 5 Draft.

The Philadelphia Phillies have historically been excellent in finding talent in the Rule 5 Draft.  (2004 – Shane Victorino, 2012 – Ender Inciarte, 2014 – Odubel Herrera).  In the early going, I (like most Phillies fans) was very skeptical as to whether or not Goeddel could follow in the footsteps of players like Shane Victorino and Odubel Herrera and become a valuable contributor to our big league team.  Goeddel had a mediocre spring training but with no other serious competition in the corner outfield spots, there was no harm in keeping him around for a rebuilding year and seeing what the kid could do.

The beginning of Tyler Goeddel’s major league career could not have gone much worse.  Take a look below at his stats through his first nine games:

4:6 - 4:19 Stats

In only 16 at-bats, Goeddel recorded only one hit (a single), and struck out a whopping eight times!  Now obviously this is a VERY small sample size, and we should expect some struggles while adjusting to big league pitching.  Up until this point, Goeddel has never seen pitching above the Double-A level.  Now let’s take a look at his plate discipline stats over the same time frame:

4/6 - 4/19 Plate DisciplineO-Swing % – Percentage of time a batter swings on pitches outside the strike zone
Z-Swing % – Percentage of time a batter swings on pitches inside the strike zone
Swing % – Percentage of time a batter swings at a pitch, regardless of location
O-Contact % – Percentage of times a batter makes contact with a ball when swinging outside of the strike zone
Z-Contact % – Percentage of times a batter makes contact with a ball when swinging inside of the strike zone
Contact % – Percentage of times a batter makes contact with the ball when swinging
Zone % – Percentage of overall pitches thrown to batter that were in the strike zone

There is nothing noteworthy about his swing percentages as they are all just about equal to the league averages, but the contact percentages are quite alarming.  Through his first nine games, Goeddel only made contact 53% of the time he swung his bat.  Rather than just writing this off as a rookie being over-matched by big league pitching, I decided to dig deeper into these stats and figure out exactly where Goeddel was struggling.  Check out the video below that I put together which basically sums up the beginning of Goeddel’s career in 30 seconds:

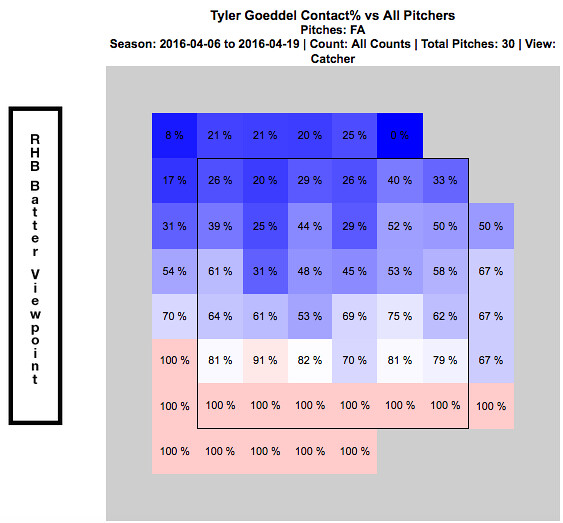
Whether or not you realized from watching the above video, every one of these swing and misses came on a fastball.  They all also came in the upper portion of the strike zone.  Just by watching Goeddel’s at-bats through this point of the season, it was clear as day to see opposing pitchers were attacking Goeddel with fastballs up in the zone.  The chart below shows every fastball that was thrown to Goeddel over his first nine games.  It is broken up by hot and cold zones and shows his contact percentage versus the fastball at every portion of the strike zone:

4:6 - 4:19 Contact % vs Fastball

This chart verifies for us what we saw in the video…Goeddel really struggled to hit fastballs up in the zone to begin the season.  At this point, everyone was frustrated.  Tyler Goeddel was frustrated because he knew he was much more talented than his results thus far have showed.  The Phillies organization was frustrated because they had such high hopes for Goeddel entering the season.  And most importantly, the Phillies fans were frustrated and began questioning what the Phillies could possibly see in this guy.  (Search for Tyler Goeddel’s name on Twitter and read old tweets from this time period if you don’t believe me!!)

An important thing to remember while looking at these stats, is that up until this point of his career Goeddel has been an every-day player.  Not only is he adjusting to big league pitching, but he is also trying to adjust to not having consistent at-bats.  Since the Phillies unexpectedly got off to such a hot start, an important decision needed to be made.  On one hand, they have this young promising player who will need consistent at bats in order to show his true potential.  But on the other hand, this team is surprisingly in the hunt in the NL East and may not want to allow Goeddel to go through his growing pains while they are competing for the division title.  Eventually, a decision was made and manager Pete Mackanin started to put Goeddel in the every-day lineup. Below are some quotes from Goeddel at this time speaking of the decision:

“Getting regular playing time and the confidence [from that] is huge, but I try to get started a little earlier on my swing so I can be on time with the fastball. You need to hit the fastball if you want to play up here, obviously. I feel like I’ve made that adjustment and it’s been a huge help.” – Tyler Goeddel

“I didn’t play how I wanted to play in April.  And I’m glad he’s (Pete Mackanin) giving me a chance, because I really didn’t play my way into a chance; he just gave it to me. So I’m trying to make the most of it.” – Tyler Goeddel

The video below (from 4/23/16) summarizes Goeddel’s early season struggles and the decision to give him more playing time:

The Phillies coaching staff deserves a lot of credit.  They recognized early on that Goeddel was struggling with fastballs up in the zone and prior to this game really worked with him in that area and promised him more playing time moving forward.  Here is a video of his next at bat in the game, where the pitcher tries once again to attack Goeddel with some high heat:

Goeddel responds with another base hit and his first RBI of the season.  Take a look below at how his stats over his next seven games compare to his stats from his first nine games.

4:23 - 5:6 Stats

4:23 - 5:6 Contact %

You can very easily see that Goeddel drastically improved his contact percentage over this time frame, which resulted in a huge drop in his strikeout rate.  The video below is from 5/8/16, right after the stretch of stats we just evaluated.  Goeddel had a big hit late to tie the game for the Phillies and later came in to score the winning run.

As you could see, the hit came on a high fastball.  A few weeks ago, Goeddel could not touch this pitch…but all of a sudden he is beginning to prove that he can.  The next video is from after that game.  Tyler discusses the adjustments he has made and also how playing every day has contributed to his recent success:

This hit was the start of a new Tyler Goeddel.  Pitchers continued to attack him with fastballs up in the zone and Goeddel really started to make them pay.  This is what he did to a Brandon Finnegan fastball just a few days later:

Ever since that hit on May 8th against the Marlins, Goeddel has been the player the Phillies could have only hoped he one day would become.  He has flashed signs of brilliance in just about every game since that have Phillies fans drooling over what the future outfield could look like.  Even though he has made adjustments and is seemingly now catching up to big league fastballs, opposing pitchers continue to test him.  Check out the video below that I put together showing what Goeddel has done to fastballs in the upper portion of the strike zone over the last few weeks.

As you can clearly see, this is a different player than we saw early on in the season.  Take a look at how his recent stats compare to those early on:

5:6-5:20 Stats

5:6-5:20 Contact %

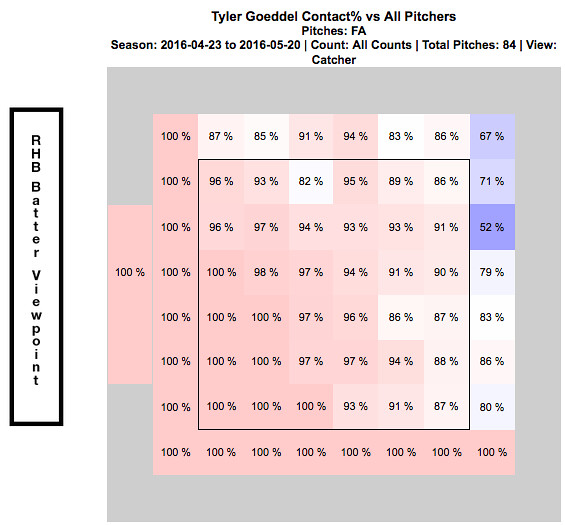
Goeddel’s contact percentage over his first nine games was only 53%.  Over his last 10 games, it is 91%.  That is an incredible difference and clearly his adjustments are paying off.  In turn, his improved contact has led to a strikeout percentage of only 5.4% over his last 10 games.  The chart below shows how Goeddel has fared against the fastball since he noted his adjustments on April 23, 2016.

4:23 - 5:20 Contact % vs Fastball

Now go back up to the top of the article and compare this chart to what it looked like at the beginning of the season.  More consistent at bats have clearly translated into him catching up to the fastball and the results thus far have been phenomenal.  I have to admit that I was a doubter early on, but I am now completely on board the Tyler Goeddel bandwagon.  This kid is only 23 years old and the fact that he was able to so quickly make an adjustment like this and immediately see results is remarkable.  Now that he is having some success, opposing pitchers will start to change their game-plan against him.  While the pace he is on now may not be sustainable over the course of a full season, I am confident that Goeddel will continue to make the necessary adjustments and help this Phillies team continue to find ways to win ball games.  Although the video below doesn’t exactly relate to his success at the plate, I had to throw this in here and it is a must watch if you have not seen it already:

The last video I will show features Goeddel’s post game interview after this throw:

Recent Quotes:

“It’s exciting.  Coming to the field everyday I’m expecting to see myself in the lineup. That’s a feeling I didn’t have last month. It’s a lot more relaxing, less stressful.” – Tyler Goeddel

“It was definitely a big adjustment, going from playing everyday my whole career to having a specific role, and then not performing well in my role, it was a little tough.  But, you know, they’re giving me an opportunity now and I feel like I’m playing better, which is nice. I’m happy for myself. I always knew I could play up here, but I needed some results to prove it to myself. I’m glad, finally, there are some results to show.” – Tyler Goeddel

I love how confident Goeddel is when he speaks of his game and I am so glad the numbers back him up.  I continue to be blown away watching him play every day, especially due to the fact that he has only been playing the outfield for one year.

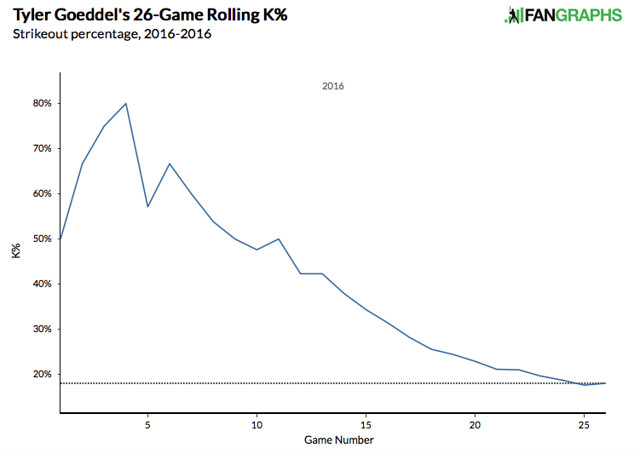
Lastly, I want to show a few graphs.  The first one shows a rolling total of Goeddel’s strike out percentage so far this season.  The statistics earlier show you that it has decreased, but this graph makes it much easier to see his progression:

Rolling K%

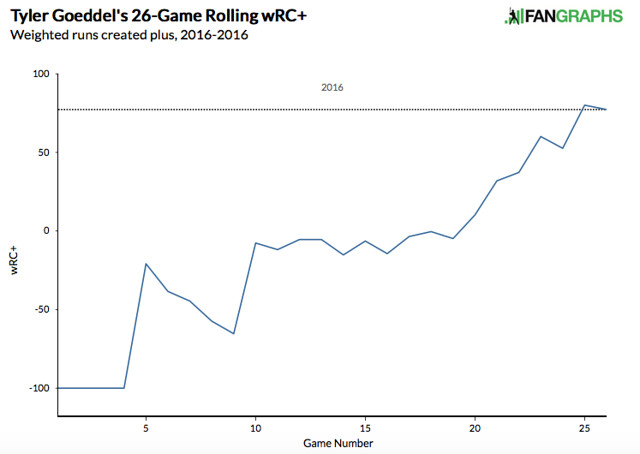
The next graph is another rolling total showing how Goeddel’s wRC+ has progressed throughout the season.  For those of you who are unfamiliar with the stat, wRC+ stands for weighted runs created plus.  It attempts to quantify a player’s offensive value in terms of runs.  An average wRC+ is 100.  Check out how Goeddel’s wRC+ has improved throughout the season:

Rolling WRC+

What do you think, Phillies fans?  Can Tyler Goeddel keep this up?  Is the Tyler Goeddel that we have seen over the last few weeks the real Tyler Goeddel?  Are you ready to hop on the bandwagon yet or do you need to see more from him to believe?  Only time will tell, but I’m buying into the hype and am excited to see what the future holds for this promising young player.

Twitter – @mtamburri922


Tyler Wilson and His Five Plus Pitches

Let me preface this article by saying that I watch A LOT of baseball.  I also have an extensive analytical background and am always analyzing baseball stats looking for value in players.  Last week, I was watching an Orioles game and the starting pitcher was a player I have never heard of.  His name is Tyler Wilson.  While watching the game, I was very impressed with his overall make-up and the confidence he displayed in each one of his pitches.  Many times what separates a pitcher from being able to start at the big-league level versus being destined for the bullpen is the ability to throw multiple pitches.  The ability to throw each of those pitches effectively, however, can be what separates a good starting pitcher from a great starting pitcher.  The more I watched of Wilson, the more intrigued I became about his future outlook, and the more motivated I became to write this article.  (I went back and watched all of Wilson’s starts this year before writing this article.)

To give you a little background, Tyler Wilson has never been an elite prospect.  He attended college at the University of Virginia, where he was overlooked by fellow staff-mate, and future 1st round pick, Danny Hultzen.  Wilson was drafted by the Orioles in the 10th round of the 2011 MLB Draft.  Ever since being drafted, he has quietly excelled at every level.  He doesn’t have the dominant strikeout numbers that you look for in pitching prospects, which is a big reason he has gone overlooked for much of his career.

After climbing his way through the organizational ladder, Wilson made his major league debut with the Orioles last year and eventually made the team this year out of spring training.  Although he made the team in a bullpen role, early season injuries to the Orioles pitching staff opened up an opportunity and Wilson has really taken advantage of it.  Enough of the background though.  Let’s move on to what I saw while actually watching him pitch.

Tyler Wilson features a cutter and a two-seam fastball.  Each of these pitches sit in the 89-91 mph range and both show a great amount of movement.  The cutter is most effective against right-handed batters when thrown on the outside portion of the plate.  Check out the video below to watch him fool Kansas City Royals outfielder Lorenzo Cain with three straight cutters:

He essentially gave Cain, a very good hitter, three of the exact same pitches in a row…and Cain couldn’t touch them.  In every start this year, Wilson has pounded the outside corner with this cutter and has had fantastic results.  Don’t think by any means though that he is a one trick pony.  As soon as you start to expect that cutter on the outside corner, Wilson will come right back in on you with a two-seam fastball:

Look at the horizontal movement on that pitch!  Absolutely filthy!  Wilson has showed a ton of confidence in both of those pitches so far this season as he uses them to pound both sides of the strike zone and his command of them has been exceptional.  He is not afraid to throw them in any count and they are equally effective vs both left-handed and right-handed batters.

While his fastballs both seemed to be plus pitches upon first glance, I started to have thoughts that this guy might be for real as soon as he started throwing his curveball.  Wilson’s breaking ball sits in the 77-79 mph range.  I was astonished by how well he was able to locate his curve and the amount of movement on each and every one he threw.  Watch him send White Sox slugger Jose Abreu down swinging in the video below:

Abreu had no chance.  In his most recent start against the Twins, Wilson’s curve looked even better.  Check out the one he threw to Byung-Ho Park:

Both of those pitches came in a 2-2 count.  Many pitchers are scared to throw a breaking ball in a 2-2 count, especially to players with plus power such as Abreu and Park.  If you miss your target, two things can happen.  One — you leave the ball up in the zone and it gets hit out of the stadium.  Two — you throw it in the dirt; the hitter lays off; and now you have to pitch to this slugger with a full count.  Wilson isn’t scared to throw his curveball in any count and that is what makes him so dangerous.  You never know when to expect it, but at the same time you have to expect that he can throw it at any moment.

The last pitch in Wilson’s arsenal is his changeup.  This pitch has a ton of downward movement and produces a lot of groundballs.  While there were many better examples that I could have shown you of his change-up in action, I wanted to show one of his bad ones.  Even when he missed his target, the batter was still fooled by the amount of movement on this pitch.  Check out the following pitch to Royals SS Alcides Escobar:

The catcher set up down in the zone and Wilson clearly misses his target.  Luckily it didn’t seem to matter as the pitch had an insane amount of horizontal movement, running in on Escobar and jamming him.

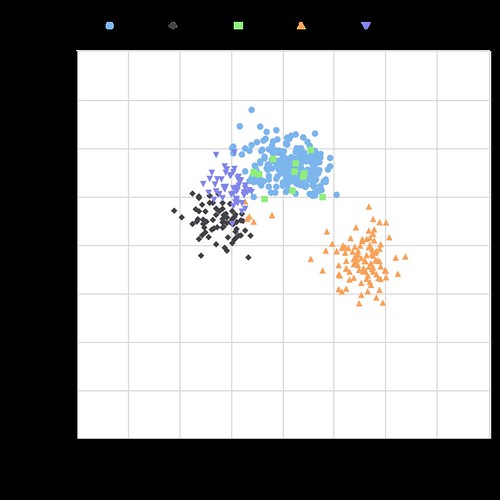
Take a look at the chart below, showing the vertical and horizontal movement on each of Wilson’s pitches:

Tyler Wilson Movement

The middle portion of this chart is empty.  All five of his pitches have a tremendous amount of movement, and none of them move in the same direction.  The fact that he is able to command each of these pitches so well and keep hitters guessing with which one will come next is the reason why he has had so much success.  A big reason why hitters are having trouble guessing his pitches is because of how well Wilson is able to repeat his delivery.  The chart below shows Wilson’s release point for each type of pitch:

Tyler Wilson Release Point
As you can see, his release point is almost identical with all five of his pitches.  At this point, I have watched all of his starts from this season and was very impressed.   I then decided to do some research and was immediately impressed with stats such as his career BB rate and low WHIP, but wanted to dig further.  I began to look through the PITCHf/x data because I was curious to see how effective each of his pitches actually were.  Based on the PITCHf/x value metric, all of his pitches so far this year have graded as above average.  If you are not familiar with the PITCHf/x value scale, someone who has a fastball ranking of zero means that he possesses an average fastball.  Any value above zero means that pitch is above average.  Obviously the higher the number, the better the pitch.  The same goes for negative numbers and pitches being below average.  See the table below for the breakdown of Wilson’s arsenal:

Screen Shot 2016-05-15 at 1.19.17 AM

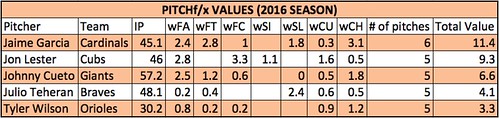
Based on the above values, the change-up has been Wilson’s most valuable pitch this season with his curveball close behind.  Obviously it is very early in the season and we are working with a small sample size…but that doesn’t mean we can’t have fun!  While doing this research, I set out the goal to find every starting pitcher who throws five or more above-average pitches.  Below is the list of players who fit that description:

Screen Shot 2016-05-15 at 1.41.09 AM
IP = Innings Pitched
FA = Fastball
FT = Two-Seam Fastball
FC = Cut Fastball
SI = Sinker
SL = Slider
CU = Curveball
CH = Change-up
KC = Knuckle Curveball
EP = Eephus

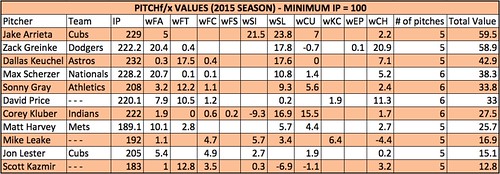
There are only five pitchers who have thrown five or more pitches above average so far this season!  Wilson is in great company, as the other four pitchers are all All-Star-caliber players and borderline household names.  Being that this is such a small sample size, I decided to look back at last year’s stats to see how many players fit this description over a full season.  Using the same parameters and setting the minimum IP to 100, the following table was produced:

Screen Shot 2016-05-15 at 2.05.17 AM

Once again, the names on this list are some of the top pitchers in baseball.  A few of these pitchers have a pitch that graded out as below average, but since they had five or more different pitches all individually grade as above average, they made the final cut.

As you can see, it is very rare to have a pitcher who has five legitimate plus pitches.  I am very interested to see if Tyler Wilson can maintain these results over the course of a full season, and I really hope he is given the opportunity to do so.  If he continues to pitch the way he has been, the Orioles will have no choice but to leave him in the rotation.  Although he has had limited success, Wilson has struggled in each of his starts when facing the lineup the third time around.  This could be due to the fact that he is still in the process of being stretched out from his bullpen role.  When in the bullpen, you don’t have to prepare to face the same hitter three times.  I am hopeful that once he is fully stretched out and back into his starter mentality, he will be able to make the necessary adjustments and continue to throw all of his pitches with confidence.  If he can continue to make quality pitches as he faces the lineup for a third time, I believe Tyler Wilson has the chance to become a very special pitcher.

Memorable quotes I heard during the TV broadcasts:

“Everyone thinks that I pitch with a chip on my shoulder but I really don’t.  I just go out and compete.  I don’t think of it that way.” – Tyler Wilson

“I think he understands himself.  He can maintain his game-plan throughout the game.  He’s going to keep us in the game and give us a chance to win.  What more can you ask for?” – Pitching Coach Dave Wallace

“I love that he can make the ball run in and then cut away.  He pitches to both sides of the plate.  Not a lot of young pitchers can do that.” – Manager Buck Showalter

…no Buck, not a lot of young pitchers can do that.

Twitter – @mtamburri922