Archive for Power

Prospect Watch: 5 Future All-Stars No One Is Talking About

I chose to stick with hitters in this article, because pitching prospects are extremely difficult to predict, and I think the pitchers who do get the hype are typically deserving. However, I do see a trend of some unnoticed hitting prospects turning out great careers in the majors. Let’s get right to it.

1. Travis Demeritte – 2B – ATL

In 2016, Demeritte went from the Rangers’ to the Braves’ system and spent the entire year in high-A ball, where he dominated at the plate. A 2B with power like Cano, good speed and the ability to get on base is such a rarity.

In my opinion, Demeritte has the highest chance of being a perennial All-Star out of these five prospects. The middle infield in Atlanta has an extremely bright future. I’m predicting that Demeritte will make his splash in 2018, and make his first ASG appearance by 2020 (age 25). Let’s look at his numbers from a season ago:


Name Age G AB PA H 2B 3B HR BB SO SB CS BB% K% OPS ISO wOBA wRC+
Travis Demeritte 21 145 547 635 145 33 13 32 78 200 20 4 12.3% 31.5% 0.905 0.283 0.393 139


Let’s compare these to the four All-Star 2B in 2016 and Brian Dozier.

Name G AB PA H 2B 3B HR BB SO SB CS BB% K% OPS ISO wOBA wRC+
Jose Altuve 161 640 717 216 42 5 24 60 70 30 10 8.4% 9.8% 0.928 0.194 0.391 150
Robinson Cano 161 655 715 195 33 2 39 47 100 0 1 6.6% 14.0% 0.882 0.235 0.37 138
Brian Dozier 155 615 691 165 35 5 42 61 138 18 2 8.8% 20.0% 0.886 0.278 0.37 132
Dustin Pedroia 154 633 698 201 36 1 15 61 73 7 4 8.7% 10.5% 0.825 0.131 0.358 120
Ian Kinsler 153 618 679 178 29 4 28 45 115 14 6 6.6% 16.9% 0.831 0.196 0.356 123


Some things to keep in mind as we compare these players: Demeritte was playing in A+ ball, but he did play an average of 12 less games than these major-leaguers. As you can see, it’s basically a two-man race (other than Dozier’s 42 HRs) between Altuve and Demeritte here. While we cannot expect these A+ ball numbers to translate directly against ML pitching, Demeritte definitely deserves more attention in top-prospect lists. While he’s not quite as speedy as Altuve, he has more power, and he walks at a far higher rate. The one glaring weakness is the K numbers for Demeritte. However, some of the top players in the league K at very high rates. As long as the OPS stays high, it doesn’t really matter how a guy makes outs anymore.

I should note that 2016 was a breakout year for Demeritte; in years past he didn’t quite live up to his potential, and also served an 80-game PED suspension. These could be the main reasons why he hasn’t garnered much attention yet. He still has to prove himself to most. However, I’m sold. I’d pencil him in for the majority of the 2020s’ ASGs right now.


2. Ramon Laureano – OF – HOU

Laureano has all the tools: he can play any OF spot well, he has speed and pop, and he gets on base. Houston’s farm has taken a bit of a hit due to some trades in the last two years, but that’s because they knew they had guys like Laureano who don’t have super high trade value, but have a chance to be great ML players like the guys they traded. Let’s look at Laureano’s 2016 numbers.

Name Age G AB PA H 2B 3B HR BB SO SB CS BB% K% OPS ISO wOBA wRC+
Ramon Laureano 21 128 461 555 146 32 9 15 73 128 48 15 13.2% 23.1% 0.943 0.206 0.418 159


The numbers speak for themselves. This is the making of a star; where is the hype? I know it’s not a huge sample size, and we don’t have much to go off from the previous year either, but in A+ and AA last year he put up those phenomenal numbers you see above.

If those aren’t All-Star numbers, then I don’t know what are. Laureano’s ability to play all three OF spots will keep him in the lineup everyday and help his chances of making it to the ASG. When he does get the call-up, if his numbers stay relatively close to this, there’s no way he doesn’t make three to four All-Star Games. As of now, he’s more of a speed threat, but as he develops, the speed/power combo will even out and he will be an Andrew McCutchen-type player. Keep tabs on this guy.


3. Christin Stewart – OF – DET

While researching Stewart, I couldn’t find an article more recent than September of 2015. There’s no one talking about him…why? As we know, Detroit is aging and looking to deal top players. So, I’m assuming we will be seeing a lot of opportunities for young guys to step up and prove themselves. Detroit’s system isn’t super deep, but that could change anytime if they do decide to move some key pieces. Regardless, I see Stewart as the prospect to watch moving forward; he has the tools to be an All-Star. Let’s check out his numbers from 2016.

Name Age G AB PA H 2B 3B HR BB SO SB CS BB% K% OPS ISO wOBA wRC+
Christin Stewart 22 147 514 622 132 29 2 31 93 154 4 2 15.0% 24.8% 0.883 0.245 0.407 156


The power is impressive, and by this chart he looks even a bit better than the two previous guys I mentioned. However, with the K numbers pretty high up there, and not a whole lot of speed, Stewart is a player that could fall into slumps. Often times, adjusting to the majors can be challenging, and some top prospects never quite figure it out. While Stewart’s MiLB numbers are pretty insane, his slump potential makes him a pretty risky pick here. However, I do believe that if he does indeed figure it out, he will make it to a few ASG and serve as an everyday player in this league for a decade. HRs and BBs get it done. Keep an eye on Stewart.


4. Jason Martin – OF – HOU

Another Houston OF prospect…another future All-Star? I think so. The future is certainly bright over at Minute Maid Park: Altuve is a cornerstone, Correa is a centerpiece, Springer is a baller, and they have prospects for days. If they can just figure out how to pitch, they could be a WS contender for the next eight years.

Why Martin, though? Let’s check out his 2016 numbers from high-A ball.

Name Age G AB PA H 2B 3B HR BB SO SB CS BB% K% OPS ISO wOBA wRC+
Jason Martin 20 121 431 502 114 25 7 23 63 112 22 12 12.5% 22.3% 0.874 0.251 0.382 131


Impressive, to say the least. At just 20 years old, he pumped out 23 homers in 121 games. He walks every eight at-bats, and he also grabbed 22 bags on the season. The ability to walk and run (lol) will typically keep guys out of major slumps. While Martin is not a highly-touted prospect at this point, I think he will be a household name by 2022. I expect him to get the call-up in 2019 and play a significant role during a pennant race that year. In 2020, he will burst onto the scene and prove his worth to this franchise.

With Houston’s current build, this might be a guy we see dealt if they are trying to add talent at the deadline this year. That doesn’t change my prediction, however. I see Martin suiting up for the ASG a few times throughout his career. Stay posted.


5. Tom Murphy – C – COL

You can’t keep putting Yadier Molina in there every year. And with Buster Posey most likely making that change to 1B full-time within three years, Jonathan Lucroy getting dealt to the AL, Kyle Schwarber playing OF, etc, pathways for guys like Tommy Murphy open up. Making the All-Star Game as a C is not saying as much as other positions, in my opinion. A decent hot streak in the first half will inflate your hitting numbers. For example, Derek Norris in 2014. It may seem like he was the best catcher in the league at the halfway point, but, as usual, it evened out by season’s end.

With that being said, Murphy has proven he has pop, and playing in Colorado is a huge advantage for him. While I don’t think he will be a Hall-of-Fame catcher, I do think he’s flying under the radar right now and will probably open some eyes in 2017. I’d say he makes two appearances in the ASG before 2022. However, once he gets up near 30 and he’s no longer playing in Colorado, I think he will have trouble keeping a job.

I have him on the list, first of all, because he meets the criteria, and also because I think people should pay attention to him, and lastly because he’s ML-ready, unlike the rest of these guys. Trevor Story didn’t have a whole lot of hype; most people didn’t expect him to make the team out of spring, but with the Jose Reyes situation, the kid got a shot and as we all know, he ran with it. I’m not saying Murphy will make a cannonball-esque splash like Story, but I think he will turn some heads and maybe even get some ASG votes this year. Anything can happen, especially in Colorado. Keep tabs on him.

Honorable Mentions

Dylan Cozens – OF – PHI

There’s not a lot of buzz surrounding Cozens, which is surprising to me, because usually when we see 40 HR in 134 games, we really perk up. In his age-22 season, he played all 134 games at the AA level for the Phillies affiliate, Reading Fightin’ Phils, a place where most Phillies prospects prosper. The reason why Cozens doesn’t quite make the cut here is because of the words, “future All-Star.” He is one of those lefties that mash in the right ballpark and against RHP, but usually career platoon hitters, even if they are highly effective, don’t make the ASG.

Rhys Hoskins – 1B – PHI

Hoskins is another AA player in the Phillies system. He probably has a little bit more of a well-rounded hitting ability than does Cozens, but he’s a 1B, and that’s an overloaded position. You have to be incredible to crack that ASG squad, and I just don’t think Hoskins will ever be quite at that level. I do believe he will pan out to be an everyday guy for a good amount of time in this league. He has really good power and he gets on base, two things that will keep you in the lineup more often than not.

Bobby Bradley – 1B – CLE

Bradley is another guy I would keep an eye on; I’m just not sold on him yet. He has a a lot of raw power, but a really high K rate in the low levels of the minors. Also, he’s a 1B, so once again, really hard to make the ASG at that position.
The Truth About Hitting the Ball Hard

I recently presented evidence that power and contact are independent skills.  An increase in power does not have to come at the cost of contact.  Surely intuition disagrees with these findings and when that happens you should be skeptical. I would be skeptical.

One reason a trade-off between power and contact is intuitive is that we are accustomed to speed-accuracy trade-offs for many everyday actions.  For example, we slow down when we pour a fresh cup of coffee because going too fast is dangerous.  Implicitly, we assume there is a speed-accuracy trade-off when we suggest that hitters can cut down on their swing to achieve more contact. Richard A. Schmidt is like the Bill James of my field — motor behaviour — and in 1979 he and his colleagues published the Theory of Accuracy for Rapid Tasks.  According to Google it has been cited over 1200 times.  While speed-accuracy trade-offs for movement are typical, the theory explains that rapid timing tasks like hitting are an exception to this rule.

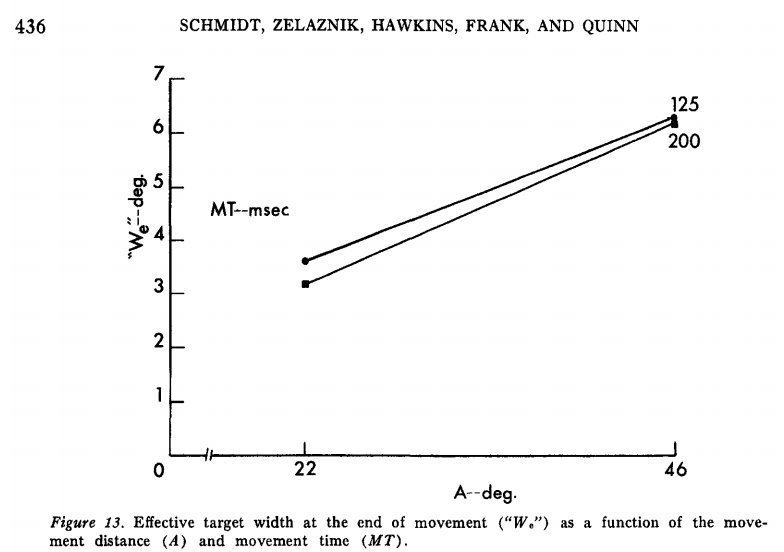
The theory is a dense 46-pager including equations, but I’ll provide a couple critical graphs to illustrate its implications to hitting.  First, Figure 1 presents the results of an experiment that investigated the effect of movement distance and movement time on spatial error.

Spatial error
Figure 1. Spatial error (“We”–deg.) as a function of movement time (MT–msec) and movement distance (A–deg).

The results indicate that movement time, that is, movement speed, had almost no impact on spatial error. You’ll notice that the movement times tested in this experiment are conveniently reflective of a short and a long MLB swing (per Zepp).  The movement distances in the experiment were shorter than a swing, and the task far simpler, but the results are suggestive nonetheless.

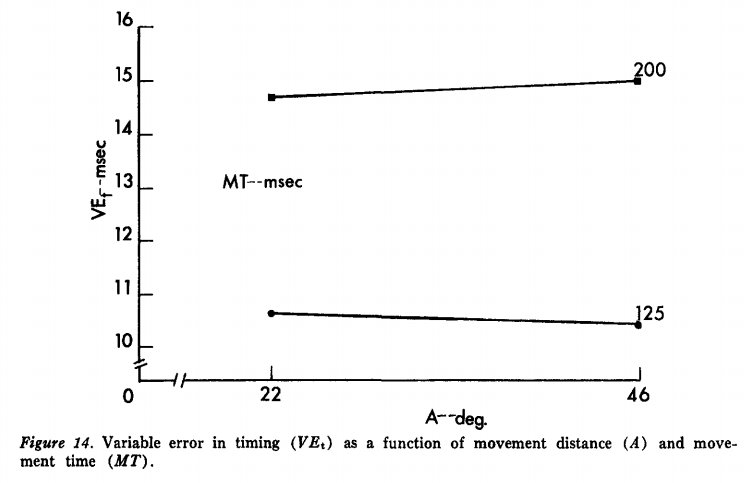
A second experiment explored the effect of movement speed and distance on timing error.  Unlike the experiment above, movement speed did have an effect on timing error.  Figure 2 presents data indicating that faster movements result in significantly less timing error than slower movements, irrespective of movement distance.

Tempral error
Figure 2. Timing error (VEt–msec) as a function of movement time (MT–msec) and distance (A–deg).

In addition to these two examples, there is a substantial empirical and theoretical framework suggesting rapid timing tasks are exempt from a speed-accuracy trade-off.  Swinging slower does not increase a hitter’s chance to make contact.  On the basis of these data and the data I presented previously, it seems that hitters can try to hit the ball as hard as possible, within reason, without sacrificing contact or base-hit skill.

UNDERSTANDING HARD%

Power, contact, speed and discipline account for 66% of variance in hitting production. Power, measured by Hard%, is by far the most important skill. But what does Hard% measure, exactly?  The description of Hard% can be found in the glossary here.  Basically, Hard% describes the proportion of batted balls that meet an unknown criteria for “hardness,” and depends on hit-type, hang-time, landing-spot, and trajectory.  Importantly, Hard% does not include exit speed in its calculation.

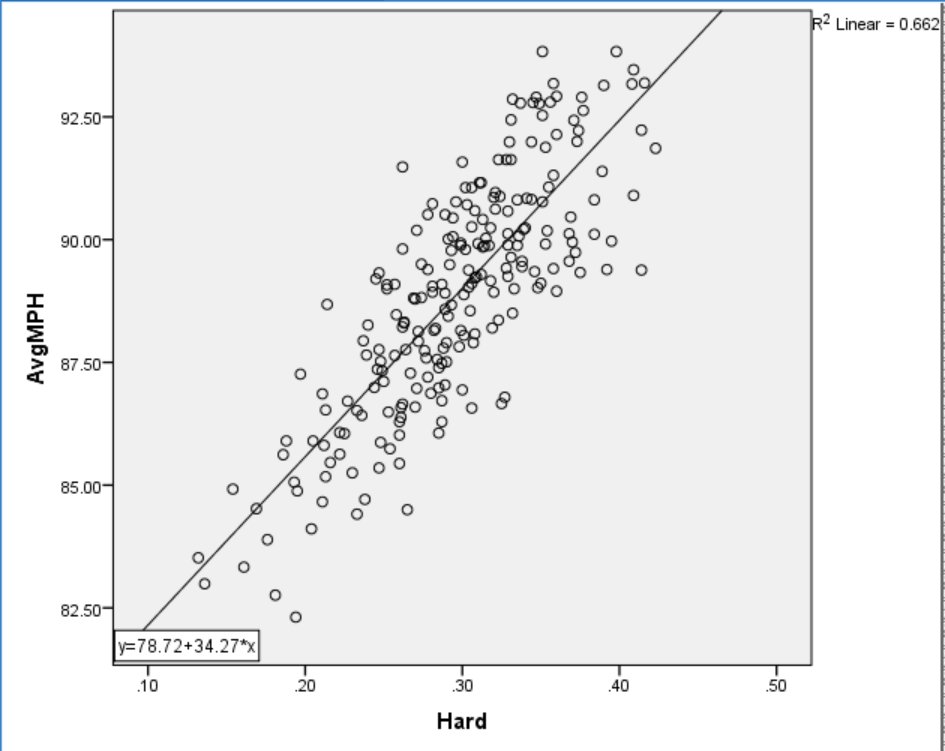
In the plot below, Average Exit Speed for players with a minimum of 190 Abs in 2015 is plotted against their Hard%.  It is pretty clear from Figure 3 that while Hard% doesn’t directly measure exit speed, it does a pretty good job of estimating it.

Exit speed and hard
Figure 3.  Average Exit Speed and Hard%.

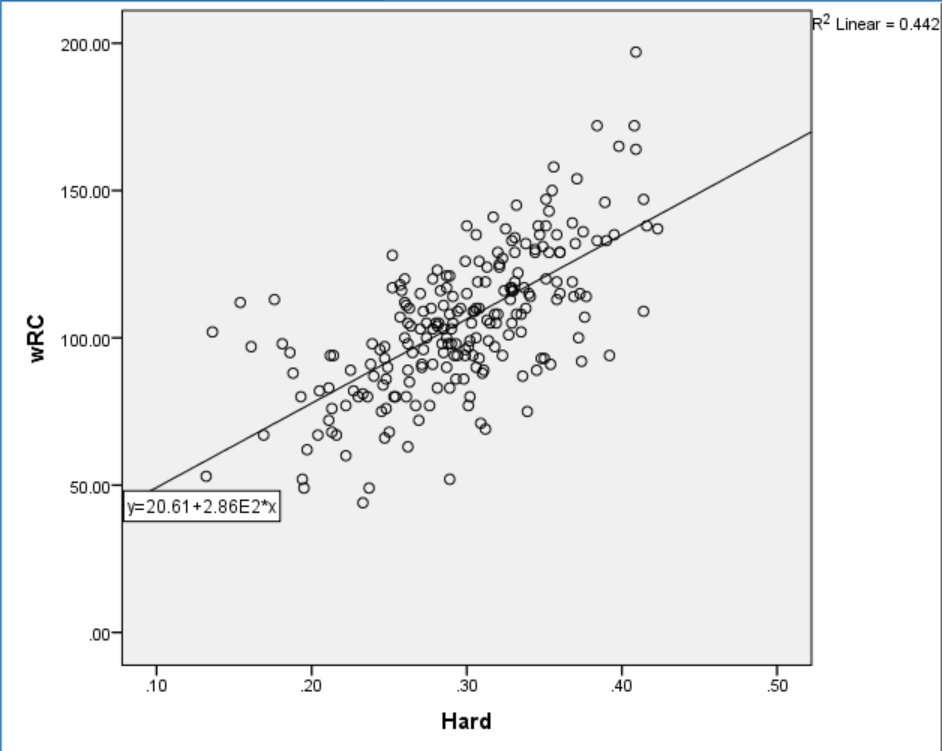
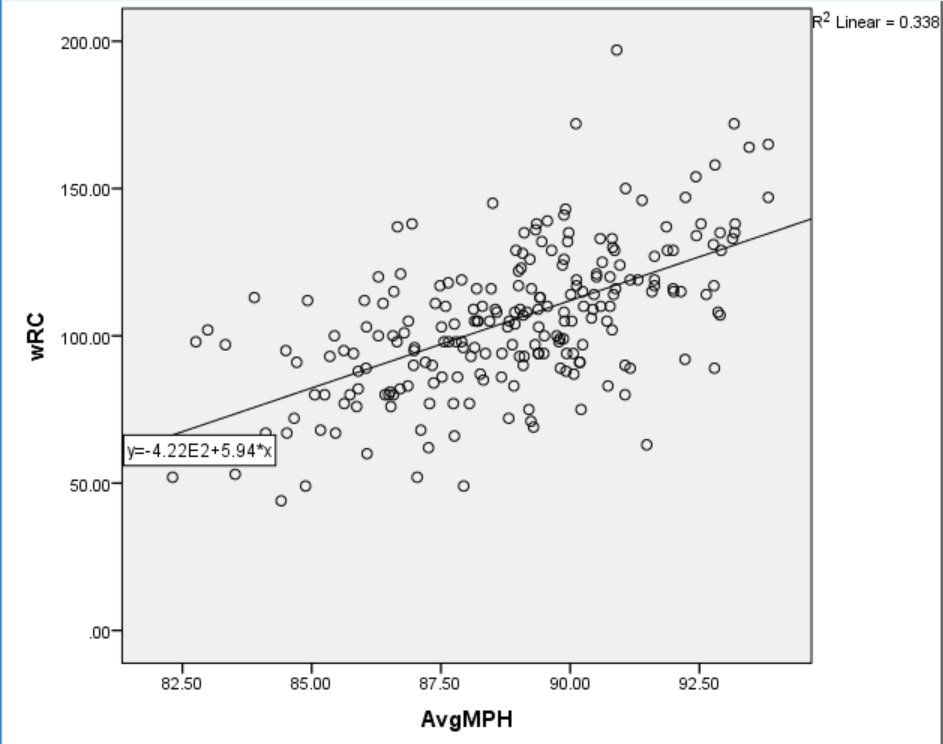
Given the tight relationship between Average Exit Speed and Hard%, I wondered if both measures were equally effective at predicting production.  The graphs in Figure 4 and Figure 5 present both power measures plotted against wRC+.

Hard and wRC+
Figure 4. Hard% and wRC+.

Exit speed and wRC+
Figure 5.  Average Exit Speed and wRC+.

Hard% does a better job of predicting production than Average Exit Speed, explaining about 23% more variance.  Since exit speed is a more direct measurement of power than Hard%, it follows non-power related data included in Hard% are relevant to production.  Previous research suggests that hit-type and trajectory are important to the outcome of a batted ball, and since both variables are used to calculate Hard%, it seems likely they contribute to the relationship between Hard% and wRC+.

INTRODUCING LIFT BIAS

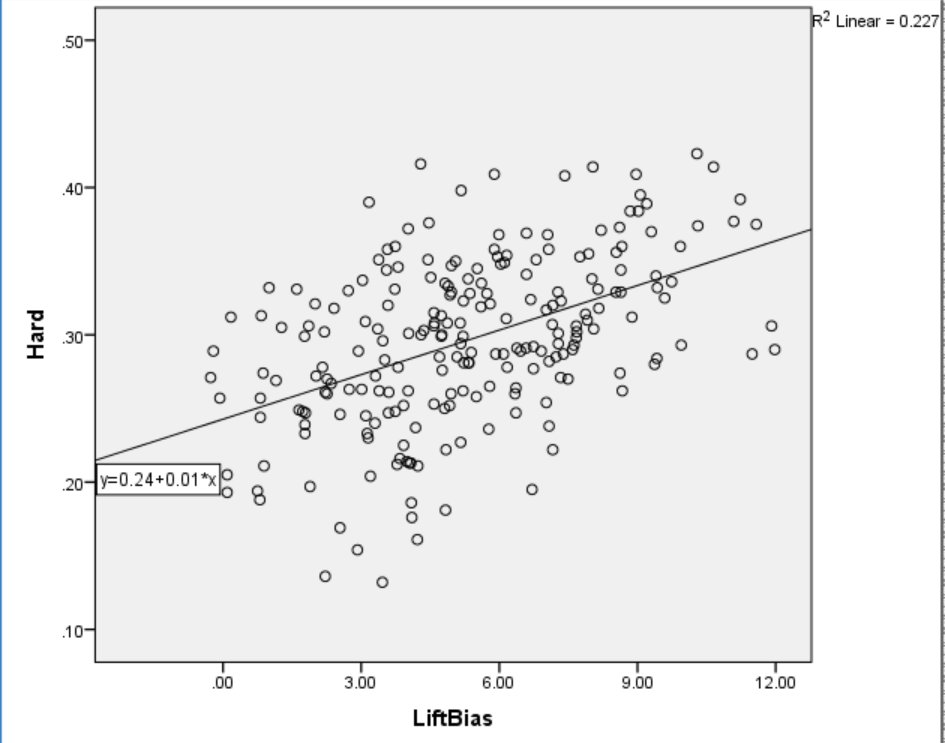
Trajectory is tightly linked to outcome and hitters only control the trajectory (or angle) they intend to hit the ball on.  We have no way to measure hitters’ intentions. The only data on vertical launch angle that I’ve been able to access are extremely limited, or incomplete, so we can’t estimate hitters’ intentions based on results.  If we had a database of swing-plane information we could estimate each hitter’s intentions based on his average swing plane relative to the pitch, but we don’t have such a database.  What we do have are data on each hitter’s average exit velocity on ground balls, as well as their average exit velocity on line drives and fly balls.  If we assume that each hitter is trying to hit the ball as forcefully as possible along their intended trajectory, and further assume that over the course of a season exit velocity will be maximal around the force vector intended by the hitter, then we can infer each hitter’s bias toward lower or higher trajectory hits by subtracting their average ground-ball velocity from their average line-drive / fly-ball velocity.  The lower the resultant value, the lower the trajectory we can assume the hitter intended.  I examined the relationship between AvgLD/FB – AvgGB (or, Lift Bias) and Hard% and the results are in Figure 6 below.

Lift Bias and Hard
Figure 6.  Lift Bias and Hard%.

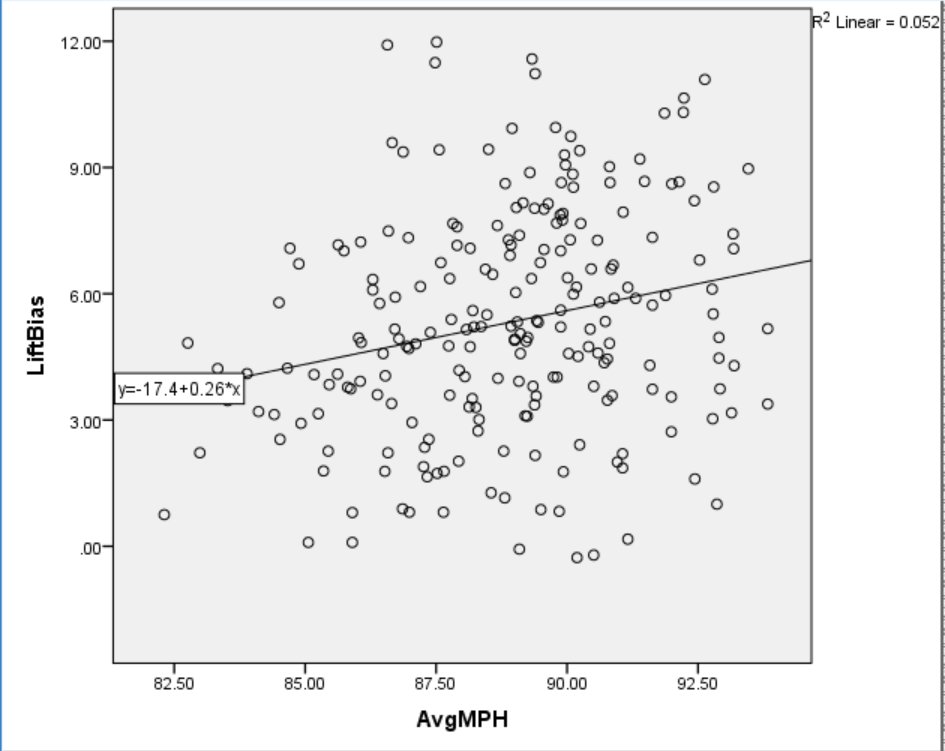
Almost every hitter in the sample hit the ball harder in the air than on the ground.  Only Melky Cabrera, Jason Heyward, and Nick Markakis hit their ground balls harder than their line drives and fly balls in 2015.  As suspected, almost every hitter appears to be trying to hit the ball in the air.  There is an apparent relationship between Lift Bias and Hard%, suggesting that hitters who intend to hit the ball on a higher angle tend to record more hard hits per contact.  To see if this was due to harder hitters choosing to lift the ball more, I examined the relationship between Average Exit Speed and Lift Bias and the results are presented in Figure 6 below.

Exit speed and Lift Bias
Figure 6.  Average Exit Speed and Lift Bias.

Surprisingly, there is practically no relationship between Average Exit Speed and Lift Bias.  This suggests that Lift Bias is associated with Hard% independent of how forcefully a hitter strikes the ball.  Since Lift Bias and Average Exit Speed are independent predictors of Hard%, I modeled the effect of both simultaneously with multiple regression.  The model explained 75% of variance in Hard% overall, and the part and partial correlations are reported in Figure 7 below.

Regression coefficients
Figure 7.  Multiple regression coefficients. 

The part correlation value in Figure 7 indicates the unique variance explained by each predictor.  Thus, Average Exit Speed explained 52% of the total variance in Hard%.  The partial correlation value describes the proportion of the remaining variance explained by one predictor after accounting for the other.  Thus, after accounting for Average Exit Speed, Lift Bias explained 26% of the remaining variance in Hard%.

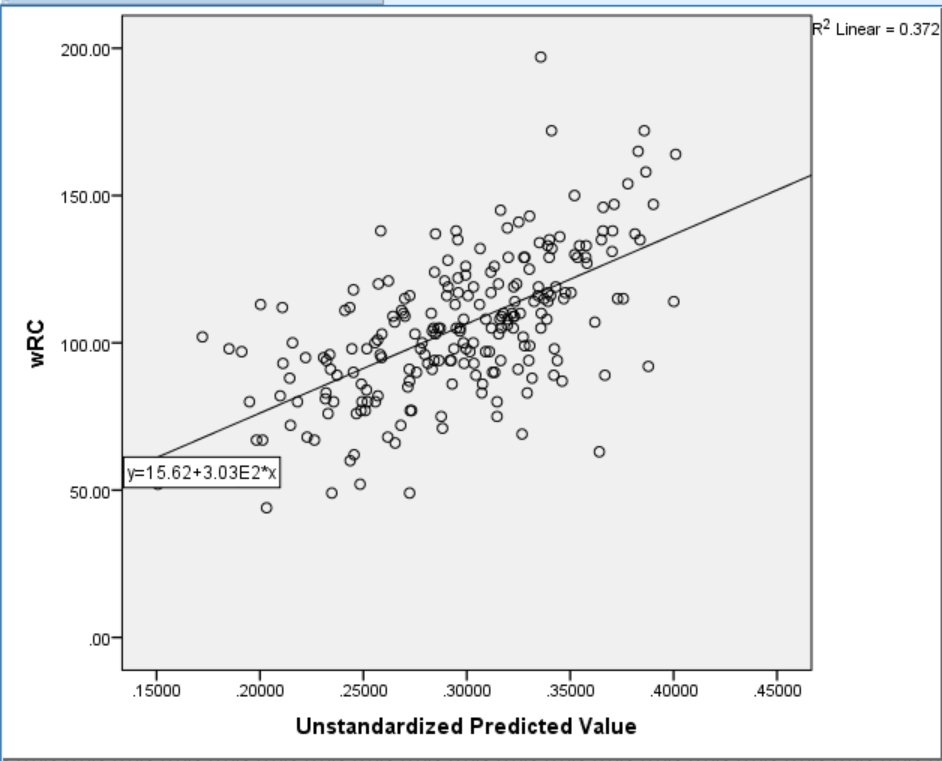
In order to determine how much of the relationship between Hard% and production can be accounted for by Average Exit Speed and Lift Bias, I plotted predicted Hard% against wRC+.  The results indicate that Average Exit Speed and Lift Bias together account for almost, but not quite all of the relationship between Hard% and wRC+. See Figure 8 below.

Predicted Hard% and wRC+
Figure 8.  Predicted Hard% and wRC+.

If you compare Figure 8 and Figure 4, you can see that real Hard% still explains more of wRC+ than predicted Hard%, but the predicted values are getting close.  Since Hard% is based on the result of each hit rather than a tendency to hit balls harder in the air or on the ground, it makes sense that Hard% should be more related to performance.  It is impressive that two variables not directly measured in Hard% explain so much of its variance, as well as such a high percentage of its relationship to wRC+.

DOES LIFT BIAS COME WITH A TRADE-OFF?

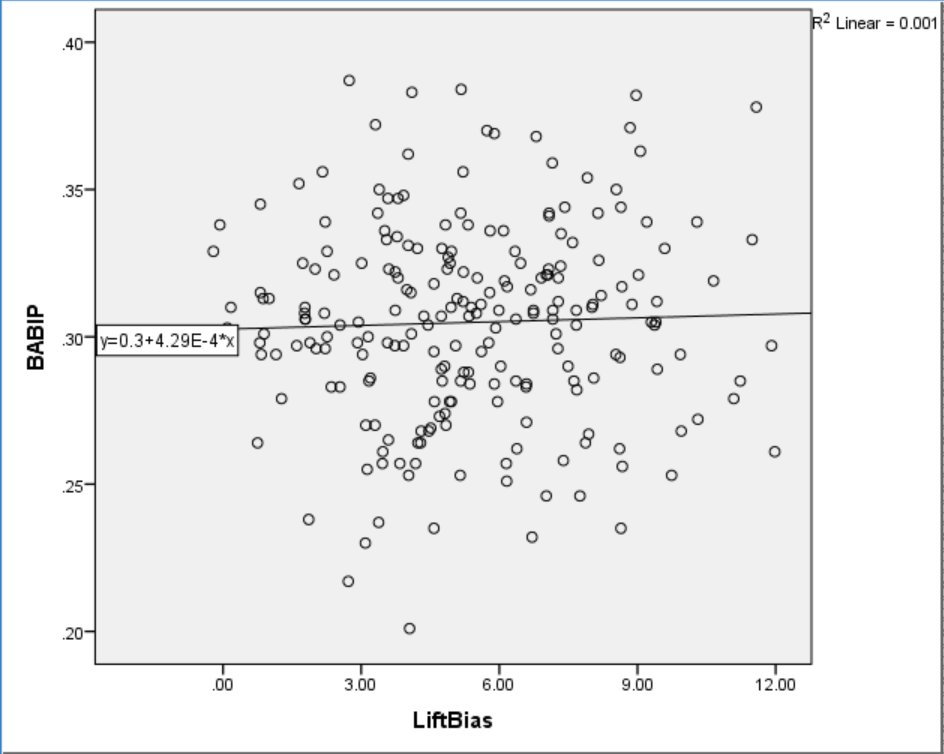
One of the most interesting results described above is the null relationship between exit speed and Lift Bias, suggesting that an increase in Lift Bias may be beneficial regardless of power. Yet again, intuition kicks in protesting that while it might be more effective for power hitters to try to lift the ball, when light hitters lift the ball the result is a fly out. Since Lift Bias is unrelated to exit speed, examining the relationship between Lift Bias and BABIP should give a hint as to whether increasing Lift Bias decreases the chances of getting at least a single.

Lift Bias and BABIP
Figure 9.  Lift Bias and Batting Average on Balls in Play (BABIP).

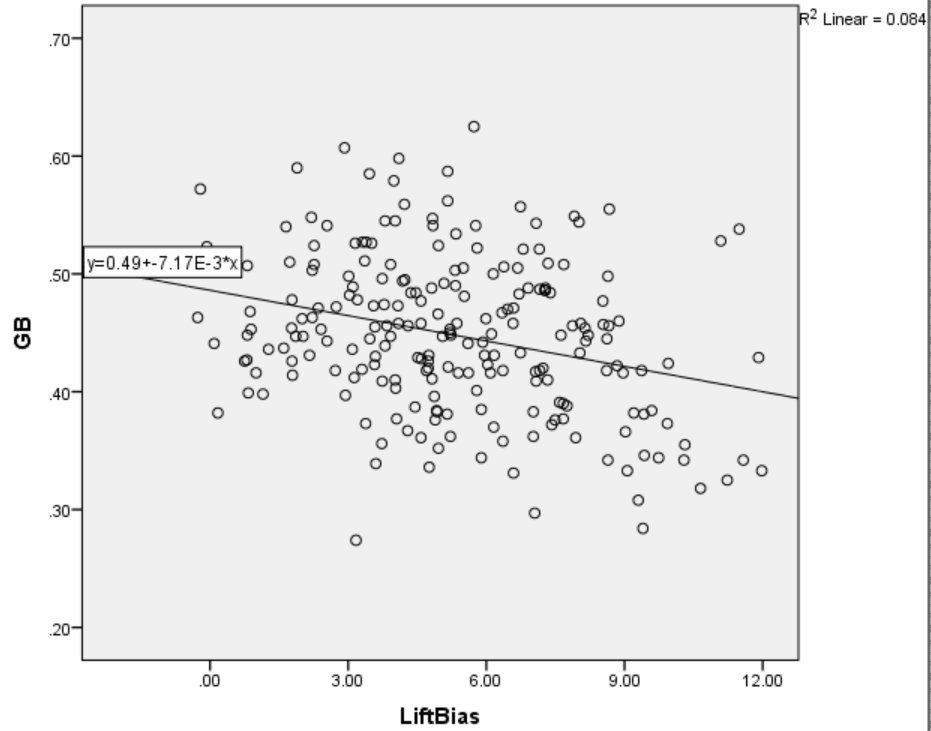
Lift bias apparently has no relationship to BABIP, which seems counterintuitive.  Does lift bias even have an effect on batted-ball type? Not really.  The relationship depicted in Figure 10 below is the strongest of all, and even then Lift Bias only explains 8% of the total variance in GB%.

Lift Bias and GB
Figure 10. Lift Bias and Ground Ball Rate (GB%).

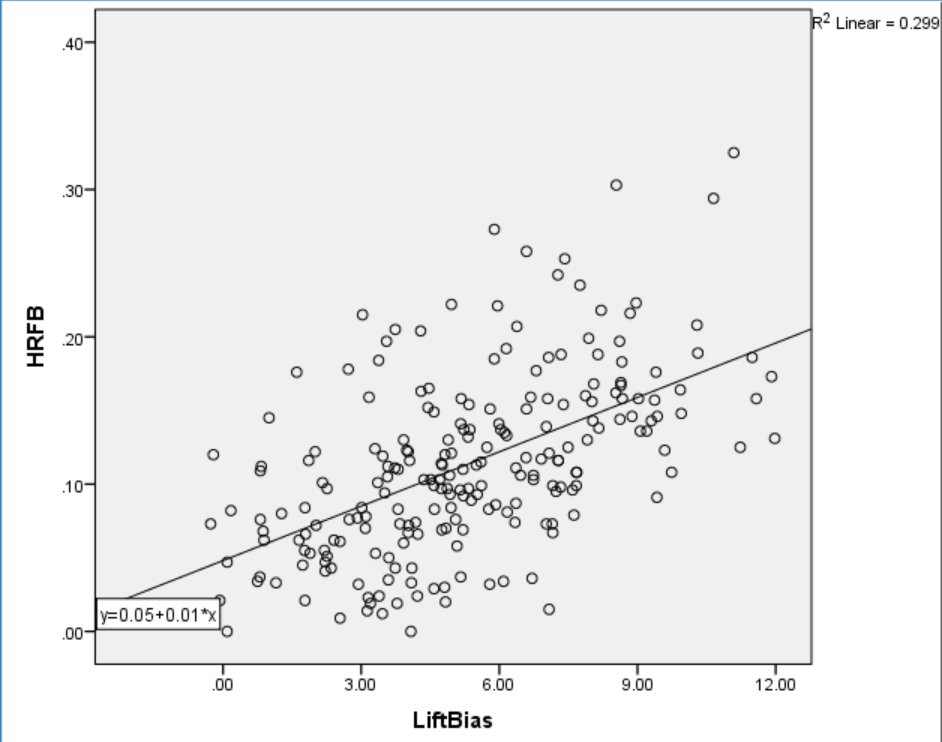
The launch angle of a batted ball depends more on the offset of the ball and bat at contact than on the attack angle of the swing.  Thus, perhaps it shouldn’t be too surprising that an ostensible measure of swing plane has little relationship to batted ball distribution.  While offset largely determines launch angle, swings that have more positive attack angles (to a point) are more optimal for batted ball distance. If Lift Bias is based on a more positive attack angle, we might expect to see a positive relationship between Lift Bias and HR/FB.  In fact, as shown in Figure 11, Lift Bias accounts for 30% of the variance in home runs per fly ball.

Lift Bias and HR/FB
Figure 11.  Lift Bias and Home Runs per Fly Ball (HR/FB).

Lift Bias has a strong relationship to average distance, and a smaller but still significant relationship to maximum recorded distance as well.  These data suggest that swing plane may be responsible for at least part of the observed Lift Bias, since increased Lift Bias seems to optimize batted-ball distance.

If swing plane does drive Lift Bias, one might expect a trade-off between Lift Bias and contact skill.  Since pitches are typically thrown on a negative angle of around 6 degrees, and attack angles exceeding 6 degrees can result in farther hits, it follows that hitters may be using a more severe uppercut than a 6 degree “level” swing to generate Lift Bias.

I used the Real Contact measure from my previous study to estimate contact skill for the hitters who have data in the 2015 sample.  The results indicated that Lift Bias is negatively associated with Real Contact, accounting for about 20% of the variance. This is the first hint of the nuance between slugging and contact, suggesting that hitters may be using steep swing planes to generate lift.  Conversely, Real Contact was unrelated to Average Exit Speed, confirming the absence of a trade-off between force and accuracy.

COMPARISON OF PLAYERS WITH MOST OR LEAST LIFT BIAS

It still seems counterintuitive that all players would benefit from having a lift bias in the top range of the sample. Is it possible that players at either end of the Lift Bias distribution are especially powerful or light-hitting, causing the appearance of a true relationship but reflecting only selective sampling? To examine the players with the most extreme Lift Bias (or lack thereof), I divided the sample into two groups with the 50 most Lift Biased and 50 least Lift Biased players.  First, I tested for differences in the potential to generate power by comparing the two groups on maximum recorded exit speed. The group with the most Lift Bias had a mean Max Exit Speed of 111mph, while the low Lift Bias group had a mean of 110mph. There is little difference in power potential between the most Lift Biased players and the least.

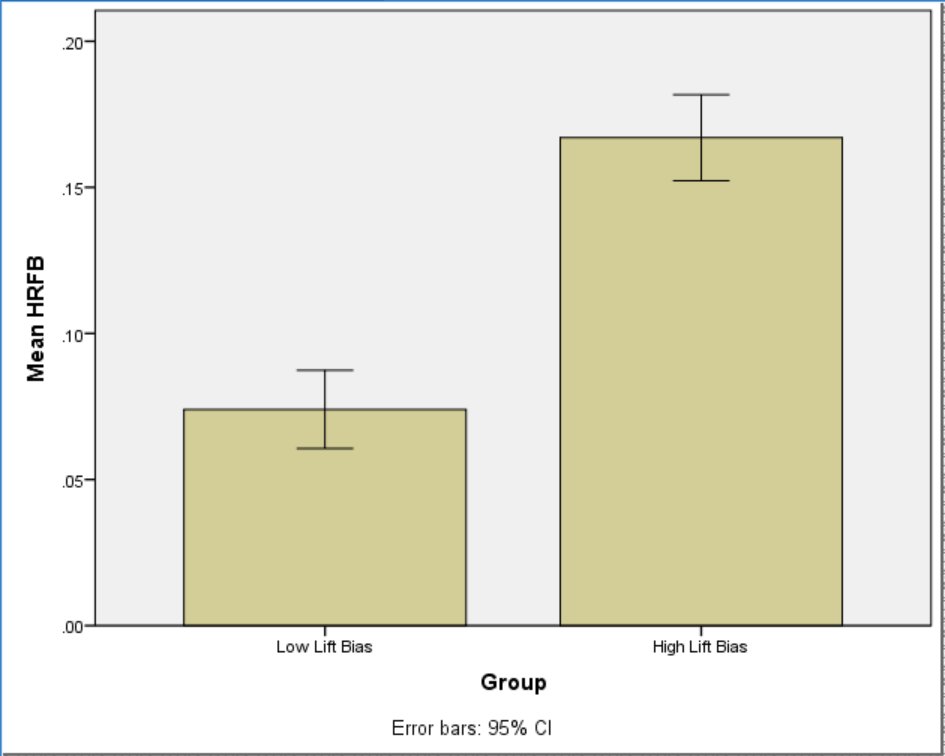
Next, I tested for differences in power production by comparing the groups on HR/FB.  As you can see in Figure 12, the high Lift Bias group (.167) saw their fly balls leave the park over twice as often as the low Lift Bias group (.074).

Group means: Power
Figure 12.  Mean HR/FB for the Low Lift Bias and High Lift Bias groups. Error bars represent 95% confidence intervals.

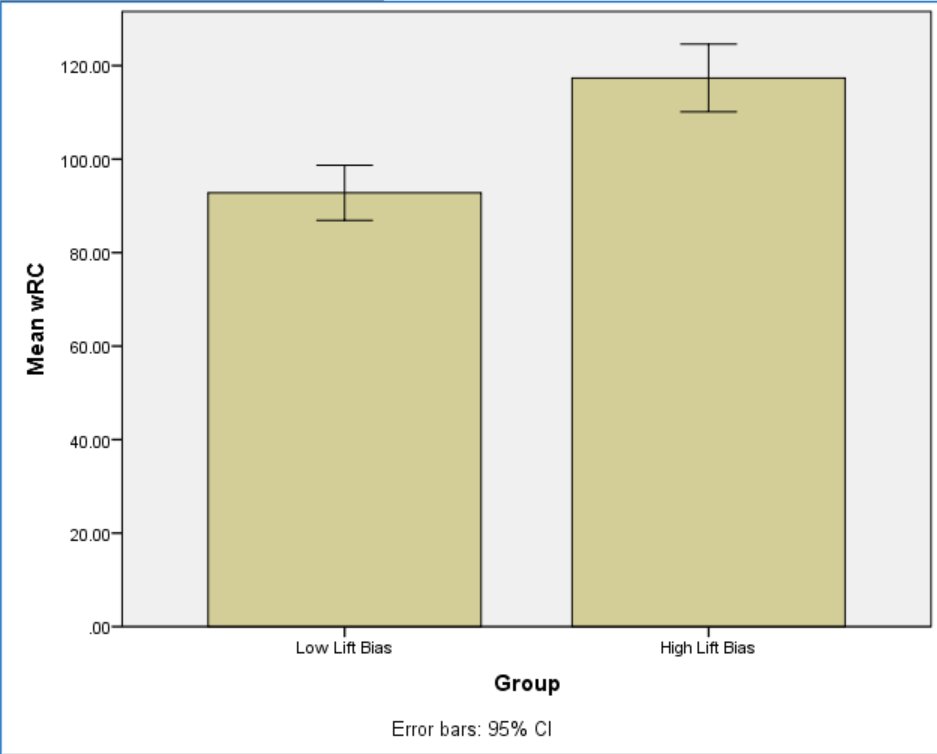
Finally, I compared the two groups on overall production.  The high Lift Bias group had a mean wRC+ of 117, while the low Lift Bias group had a mean of 93.  The players with the largest Lift Bias are, on average, substantially better than league average.  Conversely, the players with the smallest Lift Bias are somewhat worse than the league average. Figure 13 presents the observed means with error bars representing 95% confidence intervals.

Group means: Production
Figure 13.  Mean wRC+ for the Low Lift Bias and High Lift Bias groups. 

The players with a large Lift Bias have basically the same power potential as the players with the least bias, yet they have much more power production.  The extra power production completely accounts for the difference in overall production between the groups, which is substantial.

CONCLUSION

Over the last two articles, I have been detailing a hierarchy of measurable skills that explain the majority of variance in hitting production.  Further, I have demonstrated that there is little trade-off between skills.  Fast exit velocity does not come at the expense of contact, and Lift Bias does not come at the expense of base hits.  There does appear to be a small trade-off between Lift Bias and contact, suggesting that situational hitting could require adjusting swing plane or intended trajectory.

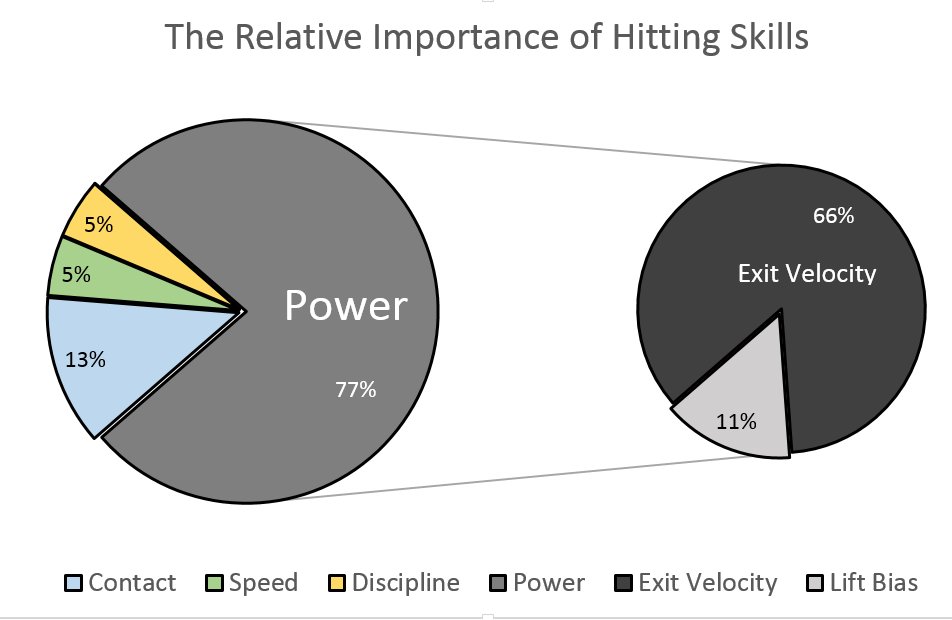
Power is the most important skill to production and is comprised of two sub-skills: Hitting balls harder on average (measured by Average Exit Speed), and generating more Lift Bias (measured by subtracting AvgGB velocity from AvgLD/FB).  The next most important is contact skill, which was estimated by parceling the effect of Fastball% out of True Contact (a location-independent measure of contact), to provide an estimate of real contact ability independent of how a hitter is pitched.  Finally, speed and discipline (represented by Spd and O-Swing%) are equally important skills, but much less important than power. Figure 14 depicts the relative importance of each skill in estimating production.

The relative importance of hitting skills
Figure 14.  The relative importance of hitting skills.

It is tempting to assume this model is causal, when in fact the data are all correlational.  If the data were causal, the conclusions for hitting coaches would be obvious:  a) Optimizing exit speed with efficient mechanics and hard work should be an ongoing goal for every player, b) Players should focus on driving the ball in the air and the hitting coach should help his hitters optimize their Lift Bias, c) Equally important, hitters should practice their contact skills against all pitch types on a situational basis, d) Discipline, which can be trained, should get about half the attention that contact receives, and e) The league is full of underachievers – assuming Lift Bias is a learnable skill.

Science will require experimental evidence before concluding that the skill hierarchy provides a causal explanation of hitting production.  Hitters and coaches may not want to wait around.  Hey, Kevin Pillar! Give me a call…


The Truth About Power, Contact, and Hitting in General

The overarching purpose of this study was to identify the core skills that underlie hitting performance and investigate the extent to which hitters must choose between these skills. The article unfolds in two parts.  In Part 1, I explore the ostensible trade-off between power and contact in search of the optimal approach. Then in Part 2, I show that 66% of variance in wRC+ can be explained by four skill-indicators: power, contact, speed, and discipline.  It will be revealed that increasing hard contact should be of paramount importance to hitting coaches, while contact and discipline are complimentary assets.

PART ONE: IS THERE A POWER-CONTACT TRADE-OFF?

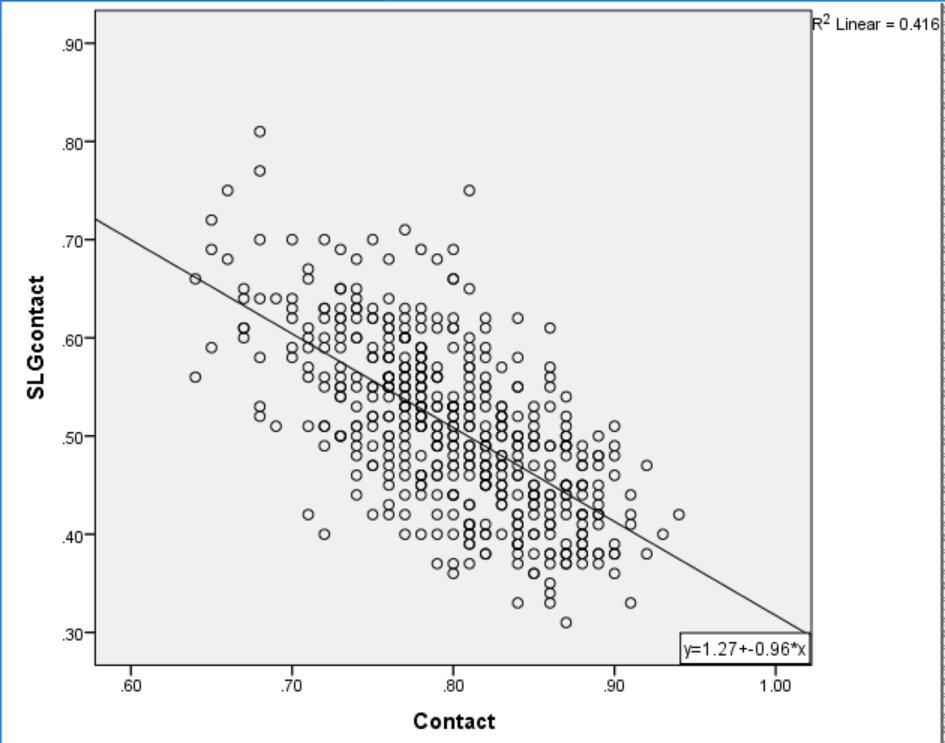
Eli Ben-Porat recently published a terrific study on the trade-off between contact ability and power and I will be building on his findings.  As such, I will be using the same sample as his study, which includes all players since 2008 who have swung at 1000 pitches or more. First, I want to explain why it is assumed that there is a trade-off between power and contact.  Not only is it intuitive that a hitter chooses between swinging for the fence and putting the ball in play — there is also clearly a trade-off between abilities among MLB hitters.  Here is a plot of the relationship between SLG on Contact and Contact%.

SLG and Contact
Figure 1. Contact Rate and SLG on Contact.

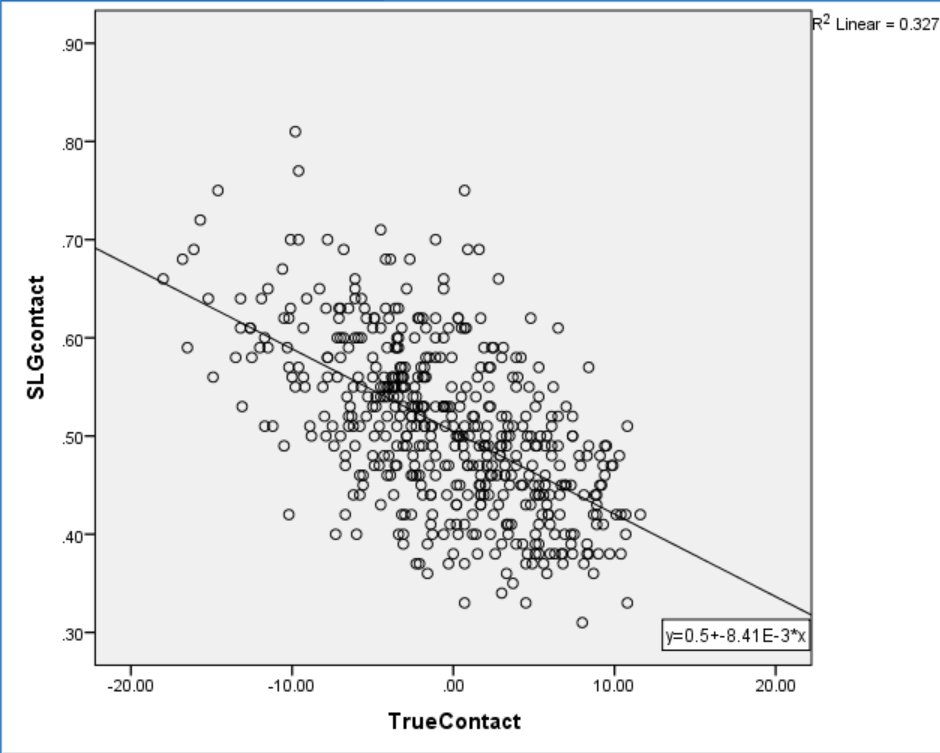
There is a strong inverse relationship between power and contact, explaining 42% of total variance.  However, Ben-Porat cited evidence that power hitters tend to face tougher pitches than light hitters, a factor that is likely to affect their contact rate.  When Ben-Porat controlled for effect of pitch location on contact rate, the relationship between contact and power dropped to an R2 of 33%. Figure 2 plots the relationship between Ben-Porat’s new True Contact, a location-independent measure of contact skill, and SLG on Contact.

SLG and True Contact
Figure 2. True Contact and SLG on Contact.

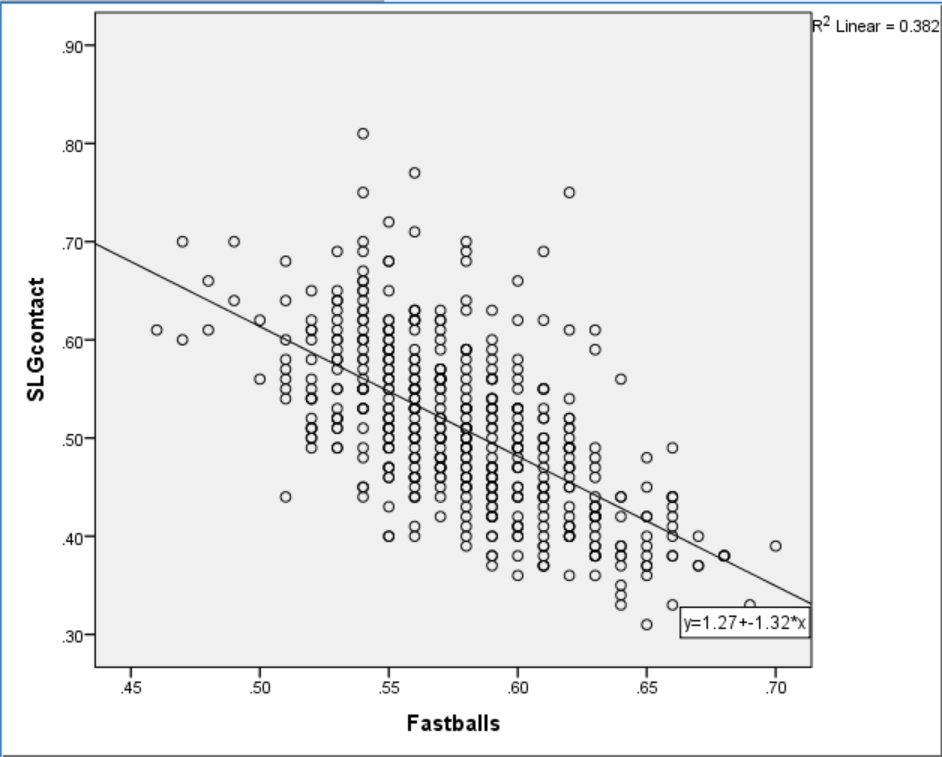
While controlling for location loosened the relationship between power and contact, there still appears to be a significant inverse correlation between the skills.  Is this lingering relationship due to a necessary trade-off between hitting for power and making contact? I propose not.  Instead, consider the relationship between Fastball% and SLG on Contact.

The graph in Figure 3 plots the relationship between percentage of fastballs faced and SLG on Contact.

SLG and Fastball%
Figure 3.  Percentage of Fastballs Faced and SLG on Contact.

Predictably, pitchers tend to throw fewer fastballs to more powerful hitters.  To parcel out the effect of pitch type, I examined the relationship between regular Contact% and SLG on Contact while controlling for Fastball%.  This strategy is similar to Ben-Porat’s approach but controls for pitch type rather than location.  The results of a simultaneous multiple regression analysis indicate that when holding Fastball% constant, Contact% explains just 12% of the variance in SLG on Contact.  In other words, most of the relationship between Contact% and SLG on Contact was due to differences in the amount of fastballs faced.

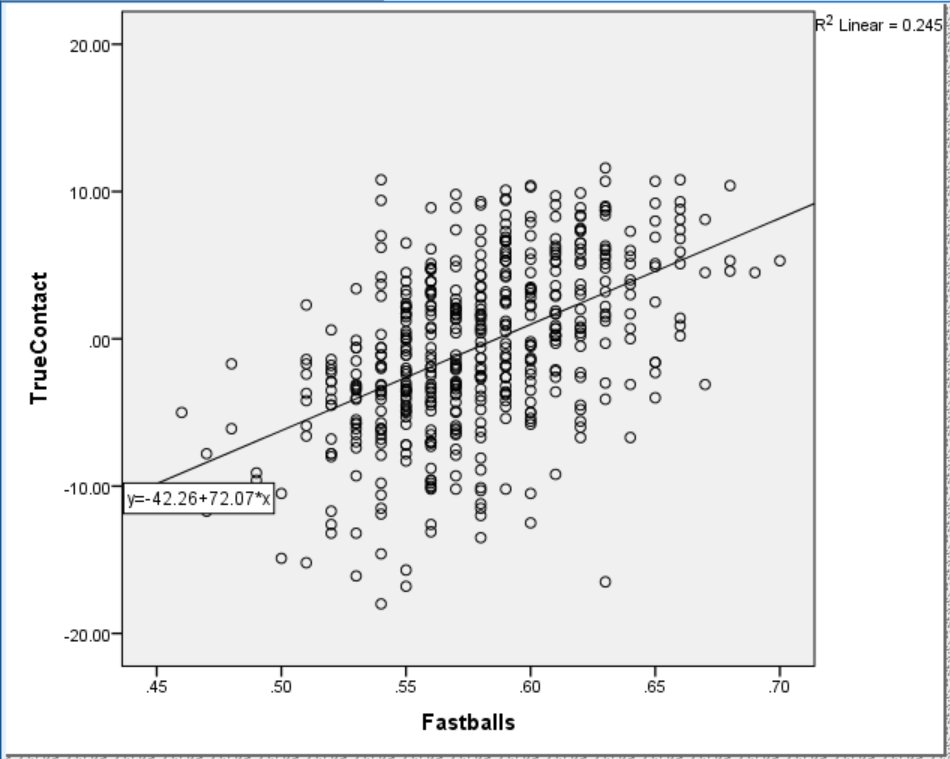
To do a little better, I examined the relationship between Fastball% and True Contact.  Figure 4 shows that Fastball% accounts for about a quarter of the variance in True Contact.  Understandably, as Fastball% increases so does True Contact.

Fastball% and True Contact
Figure 4.  Relationship between True Contact and Fastball%.

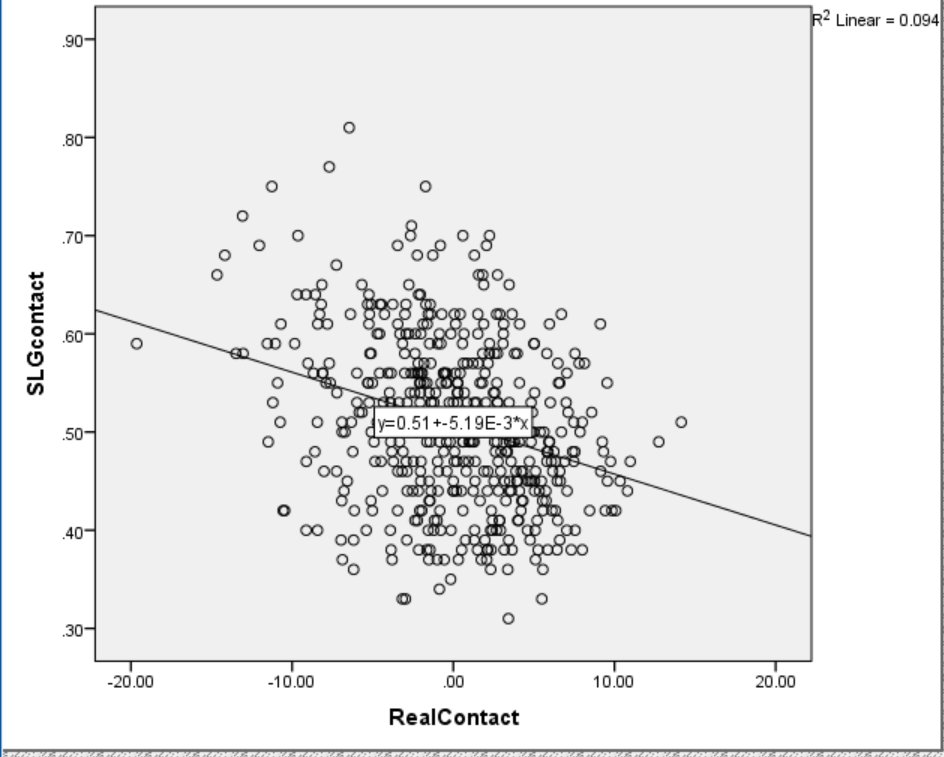
While True Contact controls for the location of pitches faced, it does not account for the proportion of fastballs faced.  When the effect of Fastball% is held constant, True Contact accounts for just 9% of the variance in SLG on Contact.  I computed a new Fastball%-independent version of True Contact, called Real Contact, and plotted it against SLG on Contact in Figure 5.

Real Contact and SLG
Figure 5. Relationship between Real Contact and SLG on Contact.

The plot resembles a shotgun distribution with only a slight relationship between power and contact left. It is possible this remaining relationship is due to what’s left of the “trade-off hypothesis.” If so, I suspected there would be evidence that an approach that maximizes slugging, such as hitting fly balls and pulling the ball, would be associated with lower Real Contact scores.  Instead, FB% explained only 2.6% and Pull% only 2.4% of total variance in Real Contact.  If there is real trade-off between contact and power, I still can’t isolate it.

Dr. Alan Nathan has demonstrated that home runs and base hits are optimized by different swing strategies.  The implication is that there is a trade-off between base hits and power. Perhaps a contact swing is a base-hit swing. I tested this notion, and Figure 6 plots the relationship.

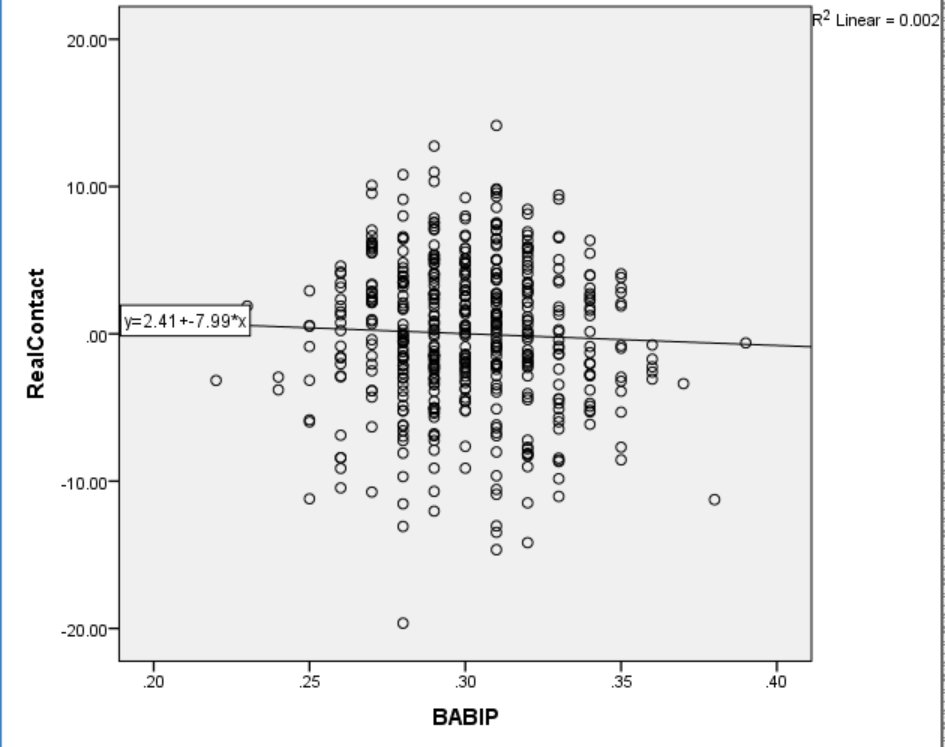
babip and contact

Figure 6.  BABIP and Real Contact.

Surprisingly, contact and BABIP are unrelated.  This is a counter-intuitive null finding, like the non-association between LD% and Hard%. In this case, I think base-hit skill requires more than not-missing.

I can’t test my final explanation, but I think selective sampling could explain the remaining small association between contact and power.  Since hitters need to achieve a minimum level of success to stay in the league, it seems unlikely for hitters to lack both power and contact skills.  Further, a hitter deficient in one skill would need to make it up with the other to avoid being released.  Since I could not find evidence to support an adjustment-based trade-off between power and contact, I assume the skills are independent moving forward.

PART TWO: POWER, CONTACT, SPEED, AND DISCIPLINE

If power and contact are separate skills, how much does each contribute to a hitter’s overall production? What about speed and discipline?  To answer these questions, I conducted a multiple regression analysis with wRC+ as the dependent variable and Hard%, Real Contact, Spd, and O-Swing% included as predictors.  The predictors were chosen to reflect power, contact, speed, and discipline because they measure each construct without including outcome data that make up wRC+. A multiple regression allows us to measure the unique contribution of each predictor on wRC+ as well as the overall variance accounted for by all the predictors.

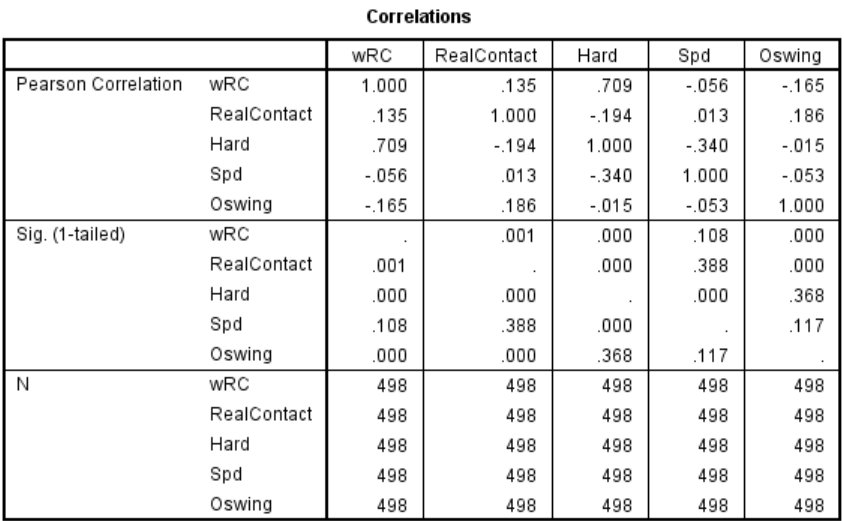
The correlation matrix for the four predictors and one dependent variable are presented in Figure 7.  Only Spd and Hard% have a zero-order correlation over .20, with an R2 of 11.6%.  The four skills are mostly unique, which means the model avoids statistical problems of multicollinearity and singularity.

Matrix
Figure 7. Correlation matrix indicating zero-order correlations in the top row, 1-tailed p-values in the second row, and sample size in the third row.

The results of the multiple regression are presented in Figure 8.  Note the adjusted R2 of .66 indicating that the four predictors explained 66% of total variance in wRC+.

Model Summary
Figure 8. Results of multiple regression.  Hard%, Real Contact, Spd, and O-Swing% predicted 66% of variance in wRC+.

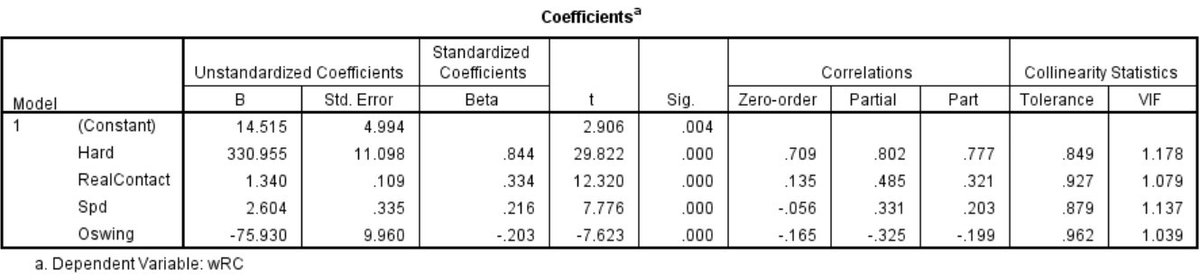
The specific contribution of each measure is indicated in Figure 9.  The Part Correlation statistic describes the unique contribution (R) of each predictor to explaining wRC+. When considering all predictors together, Hard% accounts for 60% of the variance in wRC+. The remaining three skills provide only incremental value compared to hitting the ball hard.

Coefficients
Figure 9.  Coefficients and Correlations from multiple regression.

The Partial Correlation statistic indicates the proportion of the remaining variance explained by each predictor while controlling for the effects of the others.  In other words, when controlling for Hard%, Spd, and O-Swing%, Real Contact explains 24% of the remaining variance in wRC+.

The strength of the multiple regression approach is clear when comparing the zero-order correlations to the partial and part correlations.  In every case, the part and partial correlations are larger, suggesting that each predictor benefits from the inclusion of the others in the model. Further, the relationship between each skill and wRC+ seems more intuitive when the contribution of the other skills is accounted for.  For example, Spd has a slight negative association with wRC+ on its own, but a positive relationship accounting for 11% of the remaining variance when included with the other predictors. It makes sense that speed is helpful, all else being equal.  Similarly, Real Contact and O-swing% have larger, more intuitive relationships to wRC+ when controlling for all predictors.

CONCLUSION

I conducted this research from a coach and player’s perspective, with the goal of identifying the ideal composition of hitting skill. Previous research has already reported a strong association between Hard% and wRC+, and this study only reaffirms the contribution of Hard% to overall production.  Given the same amount of speed, discipline, and contact skill, hard-hit percentage accounts for over two-thirds of remaining variance in a hitter’s wRC+.

A novel finding of this study is that there is little to no trade-off between power and contact ability.  Almost all of the apparent effect was due to differences in how power hitters and light hitters are pitched.  Given the same pitches, power hitters can make as much contact as light hitters. For example, Albert Pujols ranks 10th in the sample in Hard% and 15th in Real Contact.

The truth about hitting is that every hitter is swinging the bat just about as fast as they can. They are racing 95+, so they don’t really have a choice.  That doesn’t leave a lot of room for a hitter to consciously swing easier.  The hitter can choose to take a “shorter” swing, but should only do so if it results in more hard contact (or the same amount and more overall contact). Hitting the ball hard is the name of the game. Making contact, running well, and being disciplined complete the package.


The Grandyman (Still) Can

For every Dontrelle Willis–who continues to get looks from Major League teams despite over eight years of complete ineptitude–there exists a handful of other players who fade into relative obscurity only a year or two removed from a dominant season. All it generally takes is a down year resulting from–or paired with–an injury to send a guy spiraling below the radar. These are often the players that can return the most value during fantasy drafts if you can make the distinction between a year that’s an aberration, and one that is a bellwether for a significant, irreversible decline in skills.

While I can’t say with complete confidence that Curtis Granderson’s 2014 doesn’t fall into the latter category, there were a couple of encouraging things going on below the subpar surface stats that make me think he can return some solid value this year, especially considering where he’s going in most drafts.

Granderson was 33 last year and coming off an injury-shortened season. He was also trading a left-handed pull hitter’s haven in Yankee Stadium for the cavernous confines of Citi Field. All things considered, it was natural to expect some significant regression. And when he hit .136 through his first 100 at-bats of the season, it seemed like the Mets might have had a disaster of Jason Bay-like proportions on their hands.

Fortunately for them, Granderson managed to right the ship to an extent, putting together a couple of excellent months. His final line of .227/.326/.388–dragged further down by a nightmarish .037 ISO, 16-for-109 August–wasn’t spectacular by any stretch. But there were some nice takeaways buried in there.

For one, his bat speed doesn’t seem to have slowed enough to justify the statistical hits he took across the board. Despite seeing 56.3% fastballs–the most he’s seen since 2010 by a wide margin–his Z-Contact % of 85% was in line with his 85.8% career average, and not far removed from the league average of 87%. I suspect the uptick in fastballs resulted from opposing teams banking on an age-slowed swing, but Granderson’s contact rates on high velocity pitches in the zone didn’t suffer for it.

Granderson also set a career high in O-Contact % with a 62.7% rate. This could usually indicate a lack of plate discipline as much as it could a sustained bat speed, except that Granderson’s O-Swing % of 26.2% is roughly the average of what he did in the four years prior. He also managed to post the second-highest walk rate of his career (12.1%) and his lowest strikeout percentage since 2009 (21.6%). These are not particularly impressive rates in their own right, but in the context of Granderson’s career they do help to dispel the notion that last year was the beginning of the end for his hitting ability.

That is not to say, of course, that I foresee a return to the 40 home run, .260+ ISO form that he flashed in his early Yankee years–there’s no way he ever touches the absurd 22 HR/FB% that sustained that run. But with the right field fences at Citi Field moving in–a change that apparently would have resulted in 9 more home runs for Granderson had it been done last season–and some improvement on last year’s uncharacteristically bad .265 BABIP, I would not be at all surprised to see a home run total between 25 and 30 to go along with double-digit steals and a batting average that won’t kill you. And that has value when it is being drafted as low as Granderson currently is.


Trouble With the Aging Curve

Ever since I became enamored by the baseball statistical community, I’ve tried to gather as much information as I could. I registered on several websites dedicated to the analysis of baseball statistics such as baseballprospectus.com or FanGraphs.com or HardballTimes.com. I read every book, article I could get my hands on and even tried my hand at producing my own research and analysis in order to achieve two goals in my life: 1. Publish my research and become a savvy baseball analytical mind; and 2. Work within a baseball organization.

My first basic analysis came in the form of three year projections in order to try my hand at fantasy baseball. Personally, I’m proud to say that my first dip within the analytical waters where fruitful as my projections helped me win my league 3 times out of 5 attempts[1]. But, after many years keeping my projections and questions to myself; I’ve finally felt compelled to start more serious research and publish my questions and results online to share with people interested in these topics. So, without further ado, I give you my first serious publication.

***

Many readers will often find that writers, commentators and analysts highly value a player before they reach their age 30 season. But, once they pass this mark, players will begin to gradually decline; their production will falter, they’re prone to getting injured more than once within the same season, their speed will begin to abandon them. In other words, the shine begins to disappear and is replaced by a shelled version of a player we, the fans, and managers value. Furthermore, I’ve often read in many articles that players even peak at the age of 27 – this being the season where a player will give his (all-time) best performance before beginning that slow decline into retirement.

Now, I have two problems with this:

  1. What stats determine that a player’s best season is his age 27 season?
  2. Does this peak age season vary for every position or are all players subjected to the same aging curve?

To answer the first question, I used player statistics starting from 1960 up to 2013 and looked specifically at power numbers – slugging percentage, isolated power and on-base plus slugging[2]. I then calculated each player’s age in accordance with their birthday and how old they would be by June 30th and took this to be their age-season. Once I had this, I began running histograms in order to determine the lowest performance, highest performance, mean and first and third percentiles.

For this analysis, I only used the data for players who were between 20 and 35 years of aged during any given season. What I found, starting with SLG, was that players – power-wise – don’t reach their peak at 27 but after their 30s. A player’s SLG increases gradually as he gets older until he reaches his age 31-32 season. A player will have a mean SLG of 0.437 by age 27, while, during his age-32 season, the mean SLG will be 0.447 – ten percentile points higher or an increase of 2.3%.

So, as we can see, SLG-wise, a player will show a better performance past his 30th birthday. But maybe I am biased. Maybe if I checked ISO, we will find different results.

What I found were very similar results. A player’s isolated power, again, on the mean, didn’t peak at age 27. The ISO was 0.159. And, the ISO didn’t peak during the age-32 season but a year earlier during the age 31 season. During this season, ISO was 0.167 while the next season it began to decline at 0.165. ISO increases by 5.0% during those five years.

Finally, I decided to take a look at OPS to see if I could find a similar pattern. Again, players mean OPS peaks during their age 32 season, going from 0.784 at their age 27 season to 0.801 by the time they’re 32. It’s not much of an increase (2.2%) but it’s something.

What I can determine, then, is that a player’s power begins to develop once he hits 27 years of age and will gradually increase right up to when he turns 32. But, after this, his power performance will begin to decline, though not by much.

Another thing that I concluded from looking at these three histograms is that, even though there are gradual increases every season.  Player performance – power-wise – will be fairly consistent from one season to the next. Save for the early seasons (21-25 when a player is still developing), there are no surprising jumps in power[3] from one age to the next. Therefore, though we might prefer younger players for cost control reasons, when we need power production, we can’t fully disregard an older player’s power performance. Chances are they will still produce the same.

***

Having checked how power changes as a player ages, I come to my second question: Does the aging curve differ across positions? Well in football – or soccer for Americans – we have four major positions: striker, midfielder, defense and goalkeeper. Through statistical analysis by Arsenal F.C.’s data department, Arsene Wenger, Arsenal’s manager, found that a players decline varies on the position he plays on the field. That is to say, a striker will age differently than a goalkeeper, and a defender will age different to these two positions.

And, as we all know, work at different positions takes a different toll on a player’s body. Catchers will suffer become more fatigued as a season rolls by than players at any other position; shortstops, as well, have a more demanding position that will require more physical effort. We expect different results from each of the three outfield positions. So, it would be natural that players at different positions age differently on the power curve[4].

What I found out was that my thoughts were correct: positioning on the diamond does affect a player’s power performance but not by much. These are the results based on the mean:

Position Peak Age SLG
Catcher 33 0.413
First Base 31 0.451
Second Base 35 0.390
Third Base 34 0.417
Shortstop 35 0.389
Left Field 32 0.441
Center Field 32 0.433
Right Field 32 0.447


As we can see from the data, first basemen will usually be the first position players to peak. After them, the three outfield positions will peak at age 32. Catchers will then follow suit. Finally, the hot corner will peak at 34 and the middle infield will produce more power by the time they turn 35 than any of their previous years.

What we can conclude from this table is the following; because the demand on power from first base more than defense, players will tend to flex their muscles more often than not; whilst primarily defensive positions such as catcher, second base and shortstop will develop more power later in their careers than when they start off. Outfielders, on the other hand, tend to produce power throughout their careers.

The position that does surprise me is the hot corner. I would have expected third basemen to peak earlier in their careers because most players at the position are power hitters. Then again, there are many good defensive third basemen who aren’t big power players (I’m looking at you Juan Uribe).

***

After reviewing all the numbers, I can safely conclude that as players age, power doesn’t decline. On the contrary, power also increases though not by very much. Furthermore, the gradual increase in power at the plate will vary by position, much like a football – soccer – player’s performance will vary according to his position. Therefore, though we may like young players because of their hustle, cost-control and their energy, it doesn’t hurt to carry a few veterans in the lineup, if not to mentor the young ones, to provide some pop within the lineup.


[1] A small sample size, I admit, but nevertheless, a positive achievement as it encouraged me to delve deeper into baseball analytics.

[2] I didn’t look at OBP as I believe that this stat has more to do with a player’s ability at identifying pitch types, though in retrospect, this can also become better as a player ages and gains more experience.

[3] Though there are many outliers as you can see.

[4] I have charts and charts of histograms for each position measuring SLG, ISO and OPS but since I don’t want to oversaturate with information.