The Truth About Power, Contact, and Hitting in General
The overarching purpose of this study was to identify the core skills that underlie hitting performance and investigate the extent to which hitters must choose between these skills. The article unfolds in two parts. In Part 1, I explore the ostensible trade-off between power and contact in search of the optimal approach. Then in Part 2, I show that 66% of variance in wRC+ can be explained by four skill-indicators: power, contact, speed, and discipline. It will be revealed that increasing hard contact should be of paramount importance to hitting coaches, while contact and discipline are complimentary assets.
PART ONE: IS THERE A POWER-CONTACT TRADE-OFF?
Eli Ben-Porat recently published a terrific study on the trade-off between contact ability and power and I will be building on his findings. As such, I will be using the same sample as his study, which includes all players since 2008 who have swung at 1000 pitches or more. First, I want to explain why it is assumed that there is a trade-off between power and contact. Not only is it intuitive that a hitter chooses between swinging for the fence and putting the ball in play — there is also clearly a trade-off between abilities among MLB hitters. Here is a plot of the relationship between SLG on Contact and Contact%.
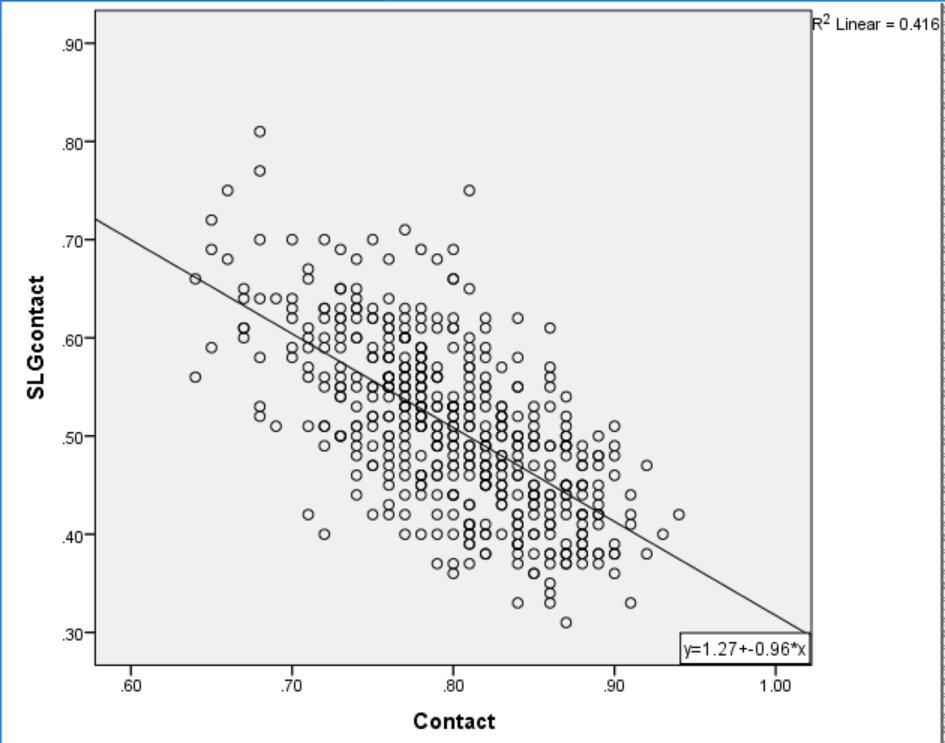
Figure 1. Contact Rate and SLG on Contact.
There is a strong inverse relationship between power and contact, explaining 42% of total variance. However, Ben-Porat cited evidence that power hitters tend to face tougher pitches than light hitters, a factor that is likely to affect their contact rate. When Ben-Porat controlled for effect of pitch location on contact rate, the relationship between contact and power dropped to an R2 of 33%. Figure 2 plots the relationship between Ben-Porat’s new True Contact, a location-independent measure of contact skill, and SLG on Contact.
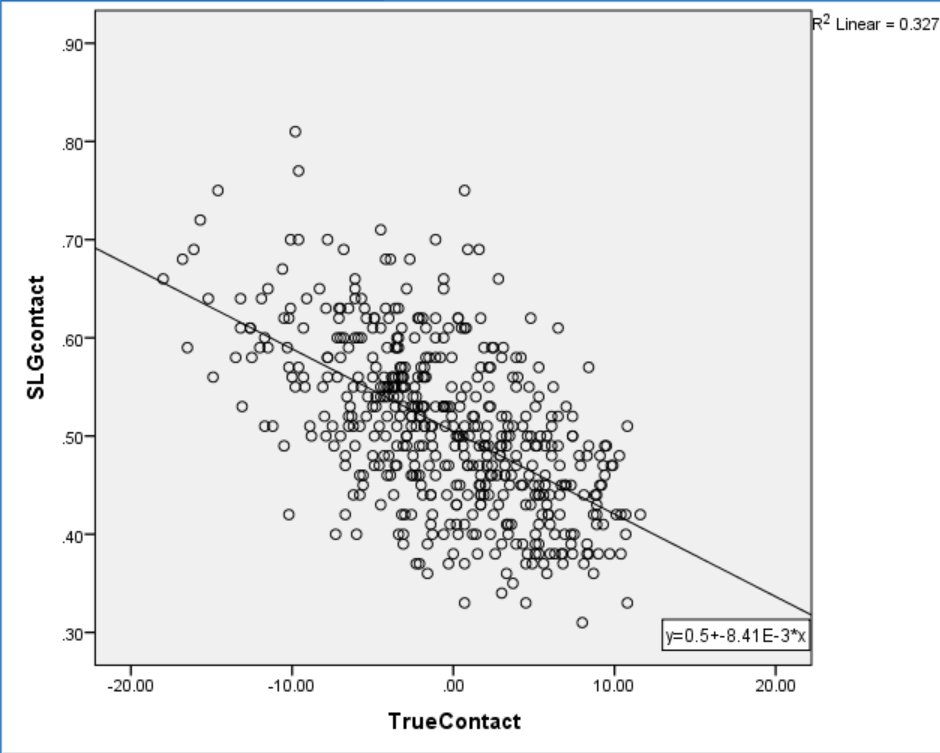
Figure 2. True Contact and SLG on Contact.
While controlling for location loosened the relationship between power and contact, there still appears to be a significant inverse correlation between the skills. Is this lingering relationship due to a necessary trade-off between hitting for power and making contact? I propose not. Instead, consider the relationship between Fastball% and SLG on Contact.
The graph in Figure 3 plots the relationship between percentage of fastballs faced and SLG on Contact.
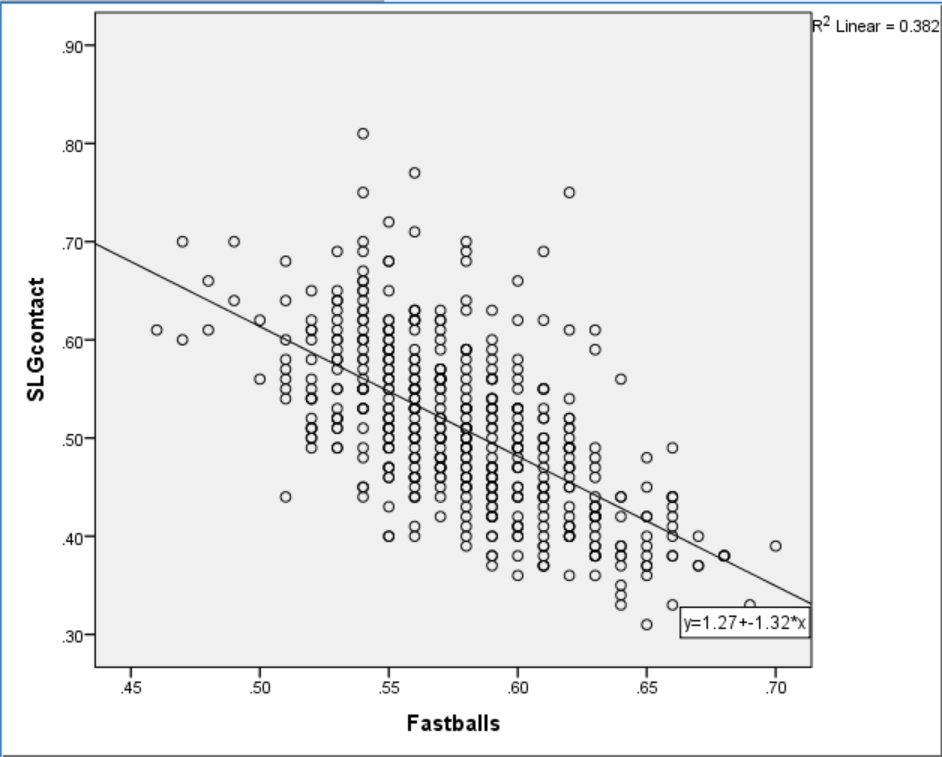
Figure 3. Percentage of Fastballs Faced and SLG on Contact.
Predictably, pitchers tend to throw fewer fastballs to more powerful hitters. To parcel out the effect of pitch type, I examined the relationship between regular Contact% and SLG on Contact while controlling for Fastball%. This strategy is similar to Ben-Porat’s approach but controls for pitch type rather than location. The results of a simultaneous multiple regression analysis indicate that when holding Fastball% constant, Contact% explains just 12% of the variance in SLG on Contact. In other words, most of the relationship between Contact% and SLG on Contact was due to differences in the amount of fastballs faced.
To do a little better, I examined the relationship between Fastball% and True Contact. Figure 4 shows that Fastball% accounts for about a quarter of the variance in True Contact. Understandably, as Fastball% increases so does True Contact.
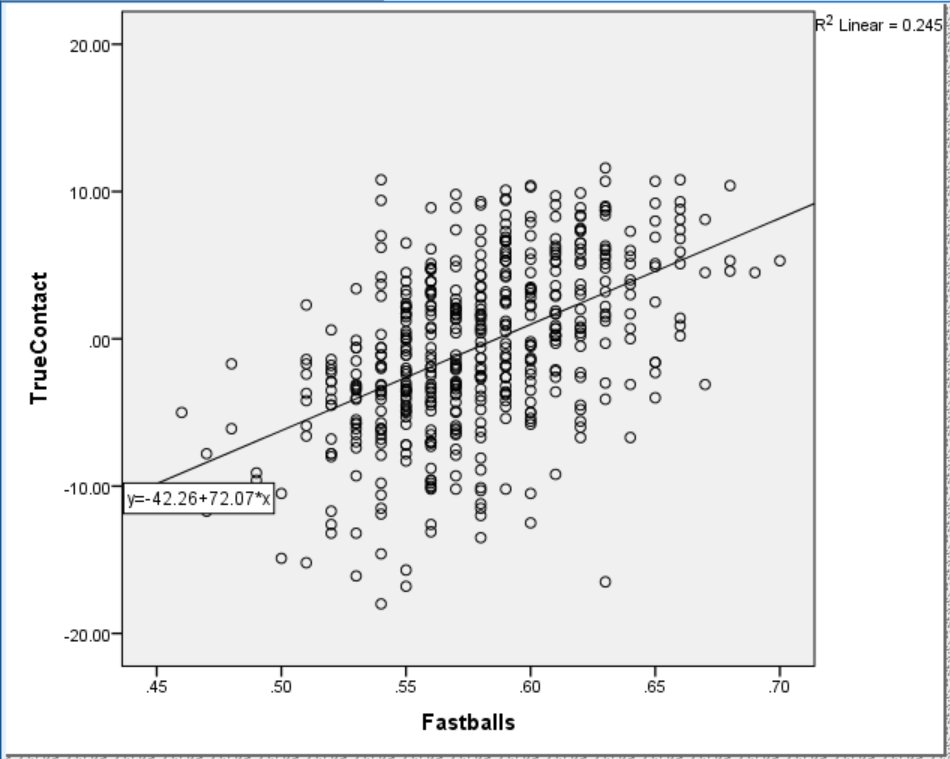
Figure 4. Relationship between True Contact and Fastball%.
While True Contact controls for the location of pitches faced, it does not account for the proportion of fastballs faced. When the effect of Fastball% is held constant, True Contact accounts for just 9% of the variance in SLG on Contact. I computed a new Fastball%-independent version of True Contact, called Real Contact, and plotted it against SLG on Contact in Figure 5.
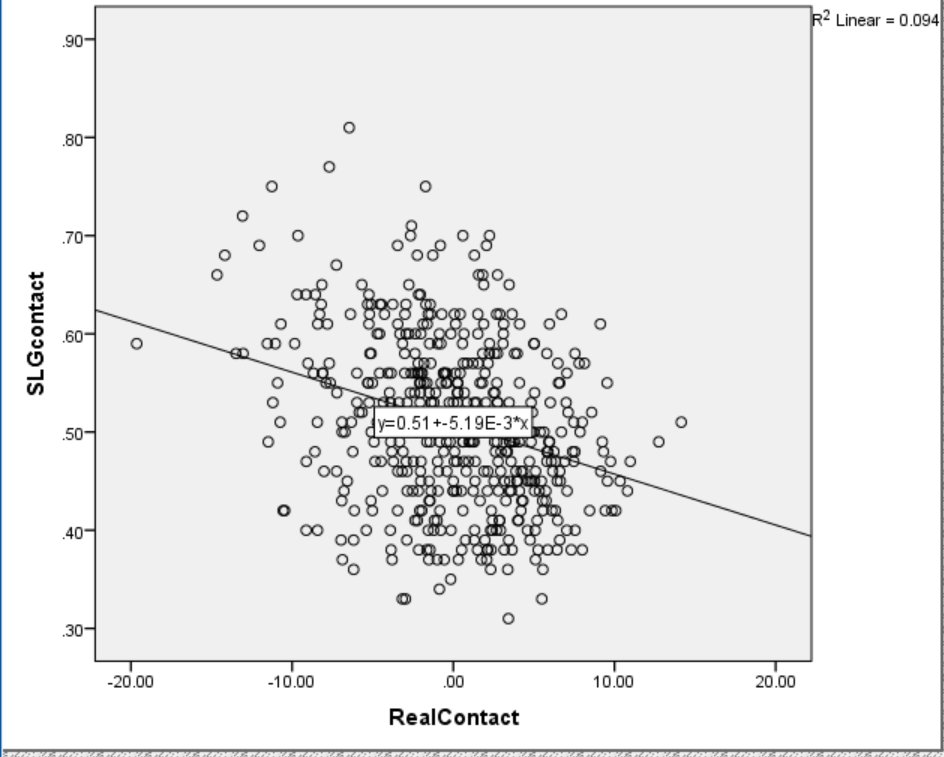
Figure 5. Relationship between Real Contact and SLG on Contact.
The plot resembles a shotgun distribution with only a slight relationship between power and contact left. It is possible this remaining relationship is due to what’s left of the “trade-off hypothesis.” If so, I suspected there would be evidence that an approach that maximizes slugging, such as hitting fly balls and pulling the ball, would be associated with lower Real Contact scores. Instead, FB% explained only 2.6% and Pull% only 2.4% of total variance in Real Contact. If there is real trade-off between contact and power, I still can’t isolate it.
Dr. Alan Nathan has demonstrated that home runs and base hits are optimized by different swing strategies. The implication is that there is a trade-off between base hits and power. Perhaps a contact swing is a base-hit swing. I tested this notion, and Figure 6 plots the relationship.
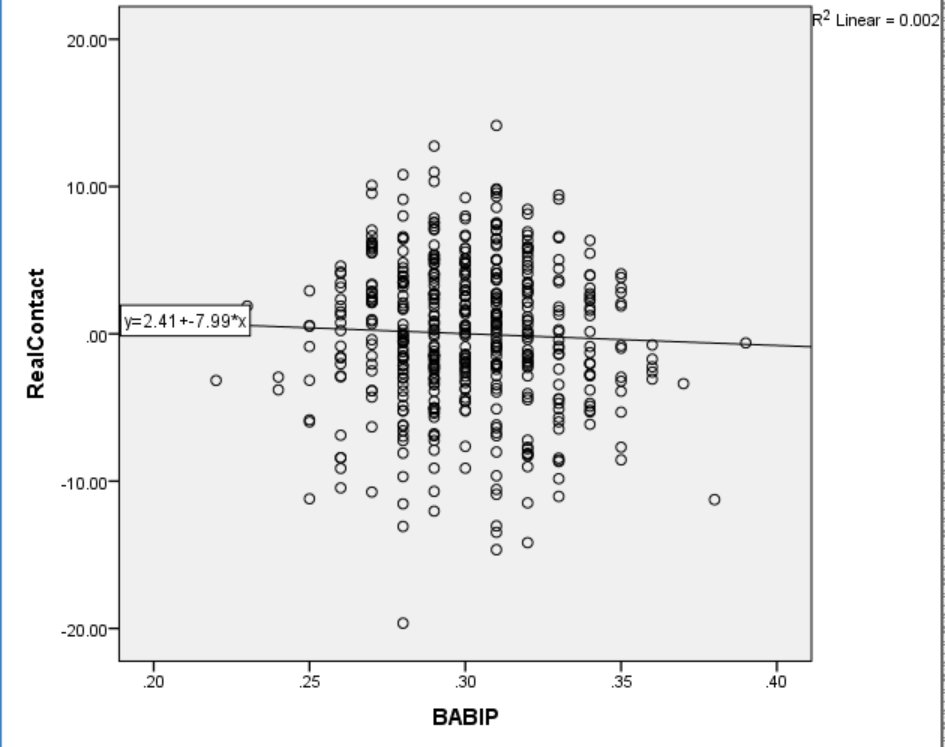
Figure 6. BABIP and Real Contact.
Surprisingly, contact and BABIP are unrelated. This is a counter-intuitive null finding, like the non-association between LD% and Hard%. In this case, I think base-hit skill requires more than not-missing.
I can’t test my final explanation, but I think selective sampling could explain the remaining small association between contact and power. Since hitters need to achieve a minimum level of success to stay in the league, it seems unlikely for hitters to lack both power and contact skills. Further, a hitter deficient in one skill would need to make it up with the other to avoid being released. Since I could not find evidence to support an adjustment-based trade-off between power and contact, I assume the skills are independent moving forward.
PART TWO: POWER, CONTACT, SPEED, AND DISCIPLINE
If power and contact are separate skills, how much does each contribute to a hitter’s overall production? What about speed and discipline? To answer these questions, I conducted a multiple regression analysis with wRC+ as the dependent variable and Hard%, Real Contact, Spd, and O-Swing% included as predictors. The predictors were chosen to reflect power, contact, speed, and discipline because they measure each construct without including outcome data that make up wRC+. A multiple regression allows us to measure the unique contribution of each predictor on wRC+ as well as the overall variance accounted for by all the predictors.
The correlation matrix for the four predictors and one dependent variable are presented in Figure 7. Only Spd and Hard% have a zero-order correlation over .20, with an R2 of 11.6%. The four skills are mostly unique, which means the model avoids statistical problems of multicollinearity and singularity.
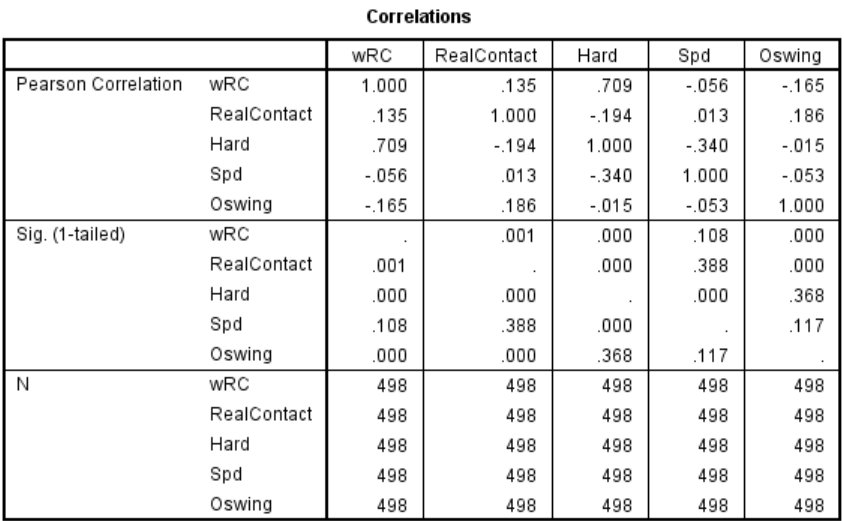
Figure 7. Correlation matrix indicating zero-order correlations in the top row, 1-tailed p-values in the second row, and sample size in the third row.
The results of the multiple regression are presented in Figure 8. Note the adjusted R2 of .66 indicating that the four predictors explained 66% of total variance in wRC+.

Figure 8. Results of multiple regression. Hard%, Real Contact, Spd, and O-Swing% predicted 66% of variance in wRC+.
The specific contribution of each measure is indicated in Figure 9. The Part Correlation statistic describes the unique contribution (R) of each predictor to explaining wRC+. When considering all predictors together, Hard% accounts for 60% of the variance in wRC+. The remaining three skills provide only incremental value compared to hitting the ball hard.

Figure 9. Coefficients and Correlations from multiple regression.
The Partial Correlation statistic indicates the proportion of the remaining variance explained by each predictor while controlling for the effects of the others. In other words, when controlling for Hard%, Spd, and O-Swing%, Real Contact explains 24% of the remaining variance in wRC+.
The strength of the multiple regression approach is clear when comparing the zero-order correlations to the partial and part correlations. In every case, the part and partial correlations are larger, suggesting that each predictor benefits from the inclusion of the others in the model. Further, the relationship between each skill and wRC+ seems more intuitive when the contribution of the other skills is accounted for. For example, Spd has a slight negative association with wRC+ on its own, but a positive relationship accounting for 11% of the remaining variance when included with the other predictors. It makes sense that speed is helpful, all else being equal. Similarly, Real Contact and O-swing% have larger, more intuitive relationships to wRC+ when controlling for all predictors.
CONCLUSION
I conducted this research from a coach and player’s perspective, with the goal of identifying the ideal composition of hitting skill. Previous research has already reported a strong association between Hard% and wRC+, and this study only reaffirms the contribution of Hard% to overall production. Given the same amount of speed, discipline, and contact skill, hard-hit percentage accounts for over two-thirds of remaining variance in a hitter’s wRC+.
A novel finding of this study is that there is little to no trade-off between power and contact ability. Almost all of the apparent effect was due to differences in how power hitters and light hitters are pitched. Given the same pitches, power hitters can make as much contact as light hitters. For example, Albert Pujols ranks 10th in the sample in Hard% and 15th in Real Contact.
The truth about hitting is that every hitter is swinging the bat just about as fast as they can. They are racing 95+, so they don’t really have a choice. That doesn’t leave a lot of room for a hitter to consciously swing easier. The hitter can choose to take a “shorter” swing, but should only do so if it results in more hard contact (or the same amount and more overall contact). Hitting the ball hard is the name of the game. Making contact, running well, and being disciplined complete the package.
Player, coach, researcher. I love the game for its own sake.
This was really interesting and thorough. Thank you for posting this and the considerable work you put in to create it. As a biologist I usually come to Famgraphs to get away from scholarly journal style articles with figure #’s and the like but this was a fine diversion nonetheless 🙂
I think you will run into other biases, specifically in regard how power hitters get pitched to – an advanced concept of hitting is that you need different swings to be able to hit different pitches and pitch locations with power. Its not solely about being pitched less fastballs. Low pitches need to be “dug out” in order to be elevated for power. So a batter needs to do two things, dig out the pitch and hit it with authority. Digging out a pitch to be able to lift it in the air for power requires far more skill, a steeper bat angle, and that steeper bat angle has less of a chance to “square the ball up solidly.”
Thanks for commenting! You’re probably right about a steeper bat angle making contact more difficult. However, True Contact controls for pitch location and Real Contact controls for both location and Fastball%. Thus, I’m not sure differences in how power hitters are pitched can explain these data. The intention was to remove the effect of pitches faced from the analysis.
Nice article. I would imagine these results could even improve with new batted ball data. Using velocity, vertical and horizontal angle, instead of a categorical variable like “Hard%”. Forcing data into arbitrary categories is only likely to increase variance. I will be really interested to see how far new, continuous data, will push the explanatory power of regression analyses.
Thanks! Nice suggestion regarding batted ball data. I have a follow up article in the queue that unpacks Hard% a bit using velocity data. You may find that one interesting as well.