Author Archive

The Tulowitzki Hypothesis

The hypothesis: Troy Tulowitzki has a longer reaction time to pitches than he used to.  Reaction time, in this sense, refers to the overall time it takes Tulo to decide to swing and then execute the swing.  Perhaps he is only getting slower mentally, perhaps only physically, perhaps a mix of both. Regardless the source of his decline, my hypothesis is that Tulo has been slower to react since the beginning of 2015 than he has over the rest of his career. I posit that Tulo’s decline and the league’s increase in velocity have caused him to pass a “tipping point,” which has kneecapped his production.

Now for the evidence.

Here is a profile of Tulo’s swing rates from Brooks Baseball.  The data are from 2008-2014, before his decline.

swing per pitch

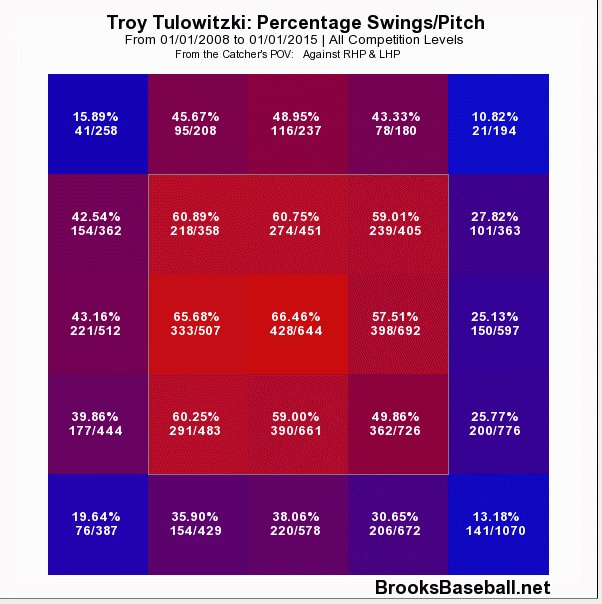
Figure 1. Swings/pitch 2008 to 2014.

Throughout his career, Tulo has preferred to swing at pitches middle in and up in the zone.  Now consider where he did his damage.

slg pitch
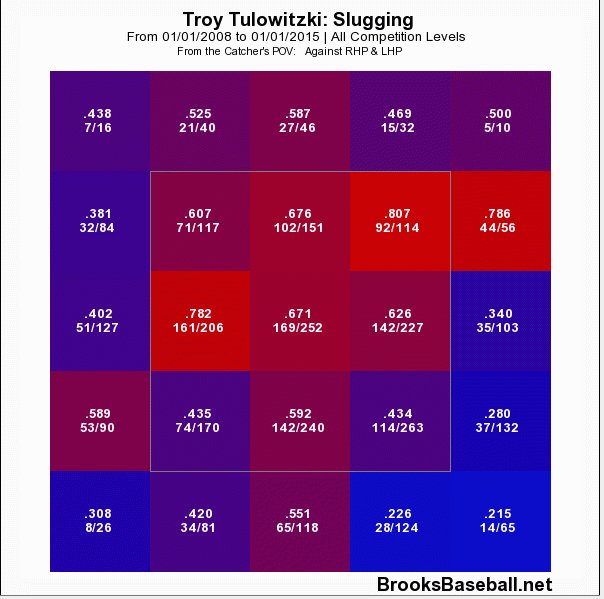
Figure 2. Slugging on contact 2008 to 2014.

Again, Tulo seemed to prefer the ball up.  He was most dangerous in the top two thirds of the zone and he could cover the entire width of the plate.

Location is important because the reaction time required to hit a pitch changes depending on where it is located in the zone.  A pitch gains velocity as it moves up in the zone, or as it moves toward the hitter, while pitches are effectively slower as they move down and away. Historically, Tulo has been most dangerous on pitches in the areas of the zone that require the shortest reaction times to hit.

Now consider how productive he’s been since the beginning of 2015.

slg now
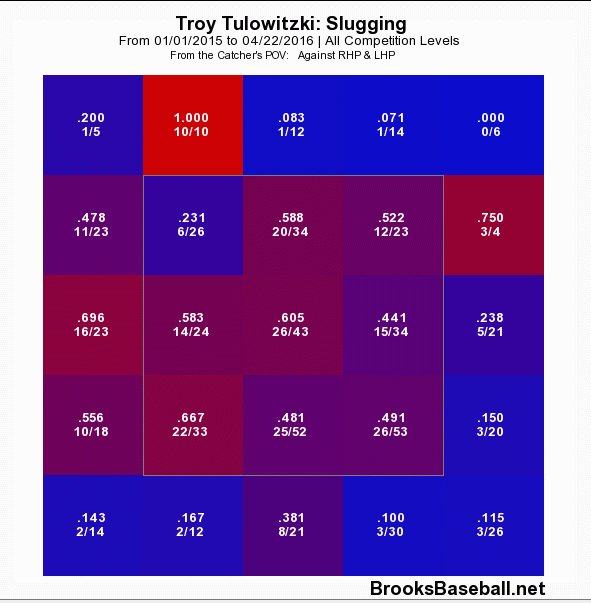
Figure 3. Slugging on contact 2015 to present.

Aside from the overall decline in the production in nearly all zones, it is noteworthy that Tulo’s most productive area has shifted from the top to the bottom of the zone.  From 2008 to 2014, Tulo’s production was highest in the top third, second-highest in the middle, and lowest in the bottom third.  That pattern has flipped, as now he’s most productive at the bottom of the zone and least productive at the top.

While these data are consistent with my reaction-time hypothesis, it’s also possible that Tulo has changed his approach to favour pitches down in the zone.

So let’s dig deeper.

Here is a profile of Tulo’s swing rates in the past year.

swing now
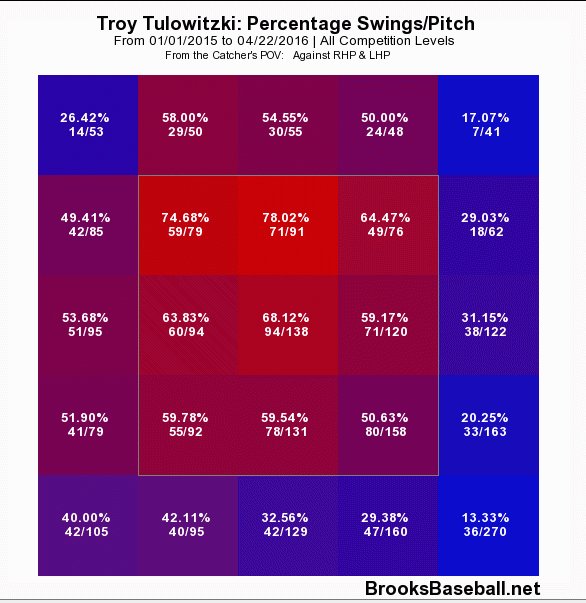
Figure 4. Swing/pitch 2015 to present.

If anything, Tulo has doubled down on his up and in approach, swinging at 75% – 78% of pitches up or up and in.  Tulo is swinging much more often at high pitches, and slightly less often at low pitches.  It doesn’t appear that he switched his approach to attack the bottom of the zone.

Let’s focus specifically on Tulo’s ability to make contact with the hard stuff. The two figures below show Tulo’s whiff-per-swing rates against all fastballs, the first from 2008 to 2014, the second from 2015 to present.

whiffs then
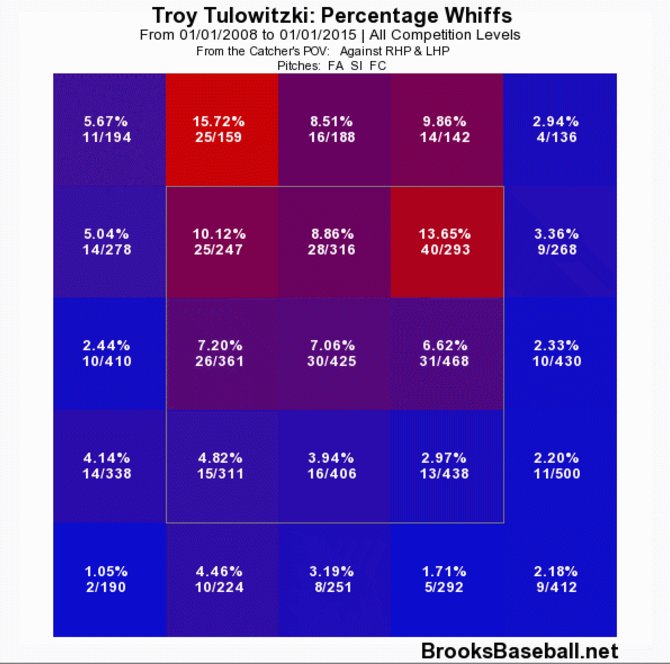
Figure 5. Whiffs/swing, 2008 to 2014.

whiffs now
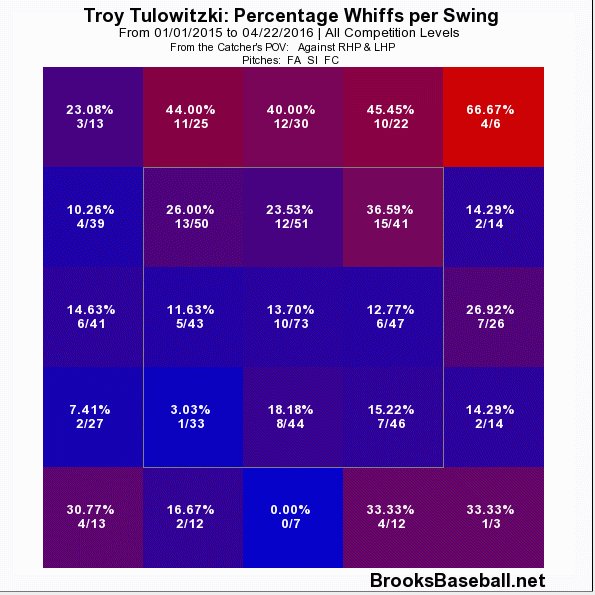
Figure 6. Whiffs/swing 2015 to present.

Tulo has basically lost the ability to handle high fastballs. Historically a high-fastball killer, now Tulo can’t seem to catch up.  He swings and misses more than twice as often on fastballs in all three locations at the top of the zone. Let me spell it out: Tulo whiffs 2.57 times more often up and in, 2.77 times more middle-up, and 2.68 times more often up and away. And it gets much worse when you consider up out of the zone: He’s swung and missed 4.6 times more often at pitches on the outer third and just up out of the zone. Yikes.

While consistent with my hypothesis, swinging through high fastballs isn’t the only deficiency I’d expect if a hitter has lost some reaction-time skill.  Pitch recognition and plate discipline are also affected by a hitter’s reaction ability.

Discipline depends on a hitter’s ability to decide quickly whether a pitch is a strike or a ball. Tulo set a career high last year with an O-Swing% of 30.6%, three full points above his previous high in a season of 27.6%.  Tulo is chasing pitches outside the zone more than ever before.

Pitch recognition depends on a hitter’s ability to recognize pitch type in time to adjust his swing. Here is a chart of Tulo’s average spray angle as a function of pitch type.  Spray angle indicates the direction (left field to right field) that balls are hit on average.  Thus, the more positive the average spray angle the greater the tendency to pull that pitch type.  As you can see, Tulo has historically hit breaking balls and off speed pitches with the same spray angle, suggesting that he was able to recognize and wait back equally well for both pitch types.

spray angle
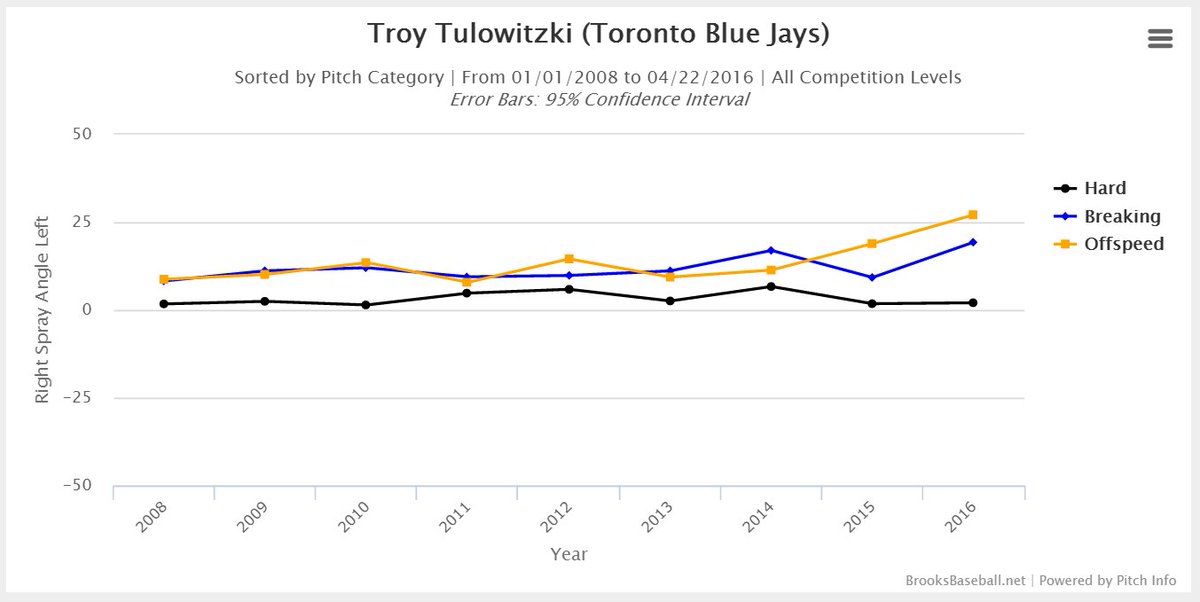
Figure 7. Average spray angle by pitch type, 2008 to present (short seasons in ’12, 14, and ’16).

In 2015 and onward, Tulo has been pulling offspeed pitches much more than breaking balls. The result (which I won’t bother to show you graphically), has been an abundance of roll-over ground balls against offspeed pitches.

Breaking balls are easier to recognize out of a pitcher’s hand than offspeed pitches. So while Tulo is still able to use the earliest information to make an adjustment, he seems unable to make use of later trajectory and spin information that would allow him to recognize and adjust to offspeed pitches.

Maybe this is because his response speed to the later information has slowed, or maybe it’s because Tulo is committing to his swing too early to make the adjustment.  I would guess the latter.

So in summary, the reaction-time hypothesis is supported by evidence suggesting Tulo is most vulnerable when the required reaction time is shortest, he is less able to recognize pitch location in time to lay off, and he is no longer able to adjust to offspeed pitches as well as breaking balls.

A POSSIBLE SOLUTION

I’m a Jays fan and a Tulo fan so I won’t be ending this post with a “Tulo’s washed up” conclusion.  I watch this guy almost every day.  He’s still got the athleticism, the power, the hand-eye, and the swing. That said, the data have me convinced that he needs to make an adjustment.  The first thing I’d try is almost embarrassing to suggest, but I’ll suggest it anyway.  Tulo should swing a lighter bat.

Hear me out. Tulo just turned over the wrong side of the aging curve – especially for a shortstop – and meanwhile the league is throwing faster than ever.  He used to have success with an approach that requires superhuman abilities, and now that he is slightly less superhuman, that approach isn’t working.  Perhaps changing the swing weight of his bat, shaving off an ounce, could allow him to catch up to the pitches he’s not getting to and return him to some semblance of his previous form.

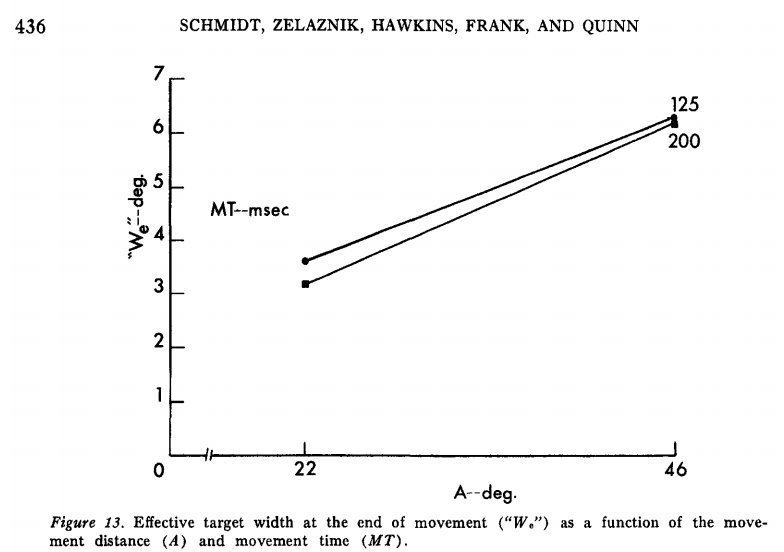
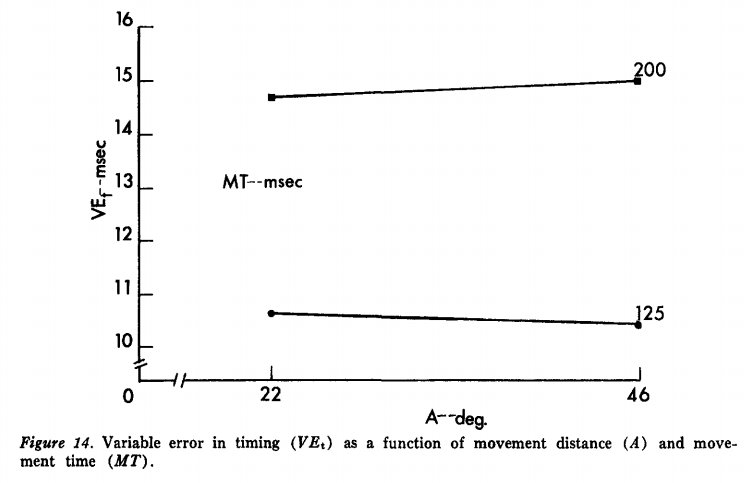
Take a look at the two schematics below (conceptual, not to scale). The full line from Release to Contact represents the timeline of the pitch.  The lines for “Breaking ball,” “Offspeed,” and “Location,” represent the moments when the hitter finally has enough information to process these respective features of the pitch.  Hitters recognize pitch type before location and breaking balls before changeups.  The coloured bars represent the time required to execute the cognitive and physical aspects of the swing.  The decision to swing must be completed by the beginning of the blue bar (response selection), in order for the brain to have enough time to make the necessary commands (response selection) and execute the swing (movement time).

My hypothesis suggests that the length of one or both of the coloured bars has increased for Tulo, while the length of the entire timeline has shortened for him (and everyone else).  I propose that both factors have pushed the blue bar to the wrong side of the deadlines for offspeed and location, causing Tulo to swing at more balls and fail to recognize changeups in time to adjust. The longer reaction time leaves Tulo vulnerable against hard stuff up and in, yet that’s exactly where Tulo made his money throughout the rest of his career. The “Tulo Now” schematic represents things since 2015, while the “Tulo Lighter Bat” figure depicts my proposed solution.

tulo now

tulo light bat

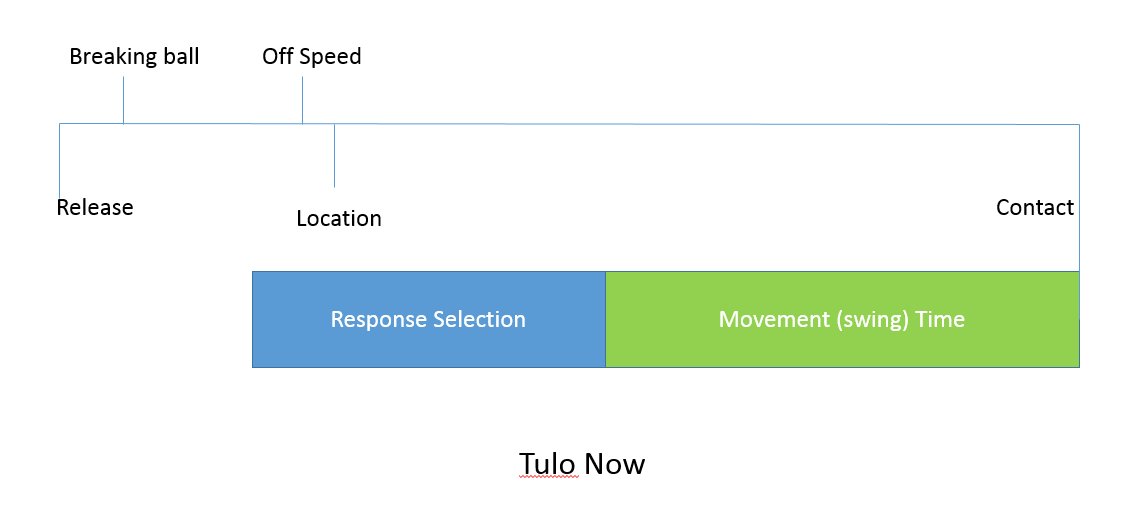
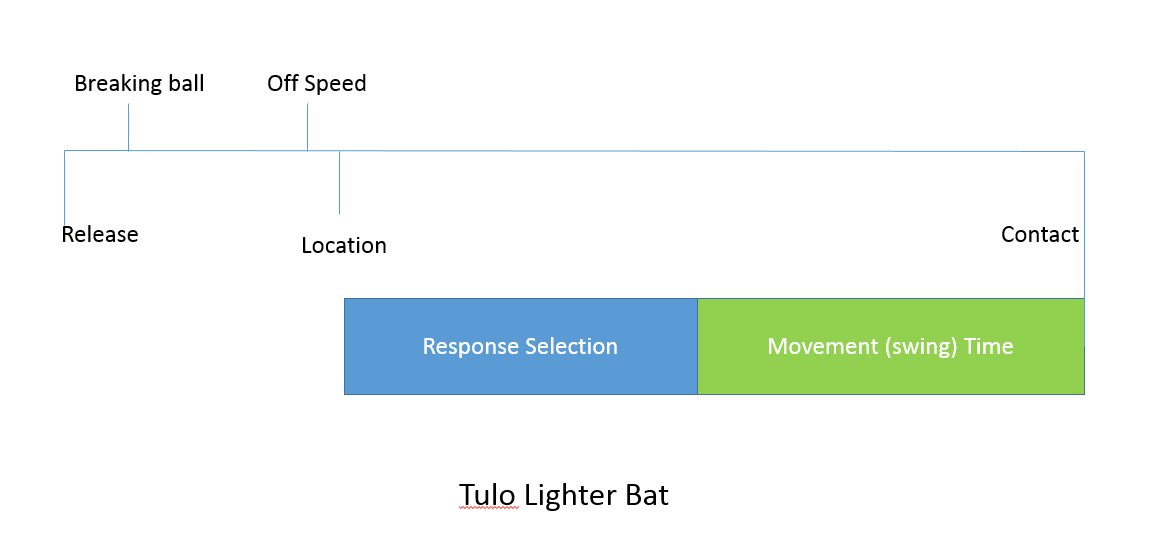
I’m not sure if anything can be done about a longer response selection time, but my hope is that a lighter bat could reduce Tulo’s movement time enough to get him back to the right side of those offspeed and location deadlines.  If Tulo can’t shorten his overall response time, he’s not going to be able to approach the game the same way he has for the rest of his career.  He’ll need to start looking down, looking away, and spitting on high fastballs.  Basically, he’d need to give up on what made him great.

I know trying a new bat might be a hard sell for a guy who won’t give up his 100-year-old beaver tail of a mitt, but I think changing bats might be easier than changing everything else. Including a swing that still looks fantastic.


The Truth About Hitting the Ball Hard

I recently presented evidence that power and contact are independent skills.  An increase in power does not have to come at the cost of contact.  Surely intuition disagrees with these findings and when that happens you should be skeptical. I would be skeptical.

One reason a trade-off between power and contact is intuitive is that we are accustomed to speed-accuracy trade-offs for many everyday actions.  For example, we slow down when we pour a fresh cup of coffee because going too fast is dangerous.  Implicitly, we assume there is a speed-accuracy trade-off when we suggest that hitters can cut down on their swing to achieve more contact. Richard A. Schmidt is like the Bill James of my field — motor behaviour — and in 1979 he and his colleagues published the Theory of Accuracy for Rapid Tasks.  According to Google it has been cited over 1200 times.  While speed-accuracy trade-offs for movement are typical, the theory explains that rapid timing tasks like hitting are an exception to this rule.

The theory is a dense 46-pager including equations, but I’ll provide a couple critical graphs to illustrate its implications to hitting.  First, Figure 1 presents the results of an experiment that investigated the effect of movement distance and movement time on spatial error.

Spatial error
Figure 1. Spatial error (“We”–deg.) as a function of movement time (MT–msec) and movement distance (A–deg).

The results indicate that movement time, that is, movement speed, had almost no impact on spatial error. You’ll notice that the movement times tested in this experiment are conveniently reflective of a short and a long MLB swing (per Zepp).  The movement distances in the experiment were shorter than a swing, and the task far simpler, but the results are suggestive nonetheless.

A second experiment explored the effect of movement speed and distance on timing error.  Unlike the experiment above, movement speed did have an effect on timing error.  Figure 2 presents data indicating that faster movements result in significantly less timing error than slower movements, irrespective of movement distance.

Tempral error
Figure 2. Timing error (VEt–msec) as a function of movement time (MT–msec) and distance (A–deg).

In addition to these two examples, there is a substantial empirical and theoretical framework suggesting rapid timing tasks are exempt from a speed-accuracy trade-off.  Swinging slower does not increase a hitter’s chance to make contact.  On the basis of these data and the data I presented previously, it seems that hitters can try to hit the ball as hard as possible, within reason, without sacrificing contact or base-hit skill.

UNDERSTANDING HARD%

Power, contact, speed and discipline account for 66% of variance in hitting production. Power, measured by Hard%, is by far the most important skill. But what does Hard% measure, exactly?  The description of Hard% can be found in the glossary here.  Basically, Hard% describes the proportion of batted balls that meet an unknown criteria for “hardness,” and depends on hit-type, hang-time, landing-spot, and trajectory.  Importantly, Hard% does not include exit speed in its calculation.

In the plot below, Average Exit Speed for players with a minimum of 190 Abs in 2015 is plotted against their Hard%.  It is pretty clear from Figure 3 that while Hard% doesn’t directly measure exit speed, it does a pretty good job of estimating it.

Exit speed and hard
Figure 3.  Average Exit Speed and Hard%.

Given the tight relationship between Average Exit Speed and Hard%, I wondered if both measures were equally effective at predicting production.  The graphs in Figure 4 and Figure 5 present both power measures plotted against wRC+.

Hard and wRC+
Figure 4. Hard% and wRC+.

Exit speed and wRC+
Figure 5.  Average Exit Speed and wRC+.

Hard% does a better job of predicting production than Average Exit Speed, explaining about 23% more variance.  Since exit speed is a more direct measurement of power than Hard%, it follows non-power related data included in Hard% are relevant to production.  Previous research suggests that hit-type and trajectory are important to the outcome of a batted ball, and since both variables are used to calculate Hard%, it seems likely they contribute to the relationship between Hard% and wRC+.

INTRODUCING LIFT BIAS

Trajectory is tightly linked to outcome and hitters only control the trajectory (or angle) they intend to hit the ball on.  We have no way to measure hitters’ intentions. The only data on vertical launch angle that I’ve been able to access are extremely limited, or incomplete, so we can’t estimate hitters’ intentions based on results.  If we had a database of swing-plane information we could estimate each hitter’s intentions based on his average swing plane relative to the pitch, but we don’t have such a database.  What we do have are data on each hitter’s average exit velocity on ground balls, as well as their average exit velocity on line drives and fly balls.  If we assume that each hitter is trying to hit the ball as forcefully as possible along their intended trajectory, and further assume that over the course of a season exit velocity will be maximal around the force vector intended by the hitter, then we can infer each hitter’s bias toward lower or higher trajectory hits by subtracting their average ground-ball velocity from their average line-drive / fly-ball velocity.  The lower the resultant value, the lower the trajectory we can assume the hitter intended.  I examined the relationship between AvgLD/FB – AvgGB (or, Lift Bias) and Hard% and the results are in Figure 6 below.

Lift Bias and Hard
Figure 6.  Lift Bias and Hard%.

Almost every hitter in the sample hit the ball harder in the air than on the ground.  Only Melky Cabrera, Jason Heyward, and Nick Markakis hit their ground balls harder than their line drives and fly balls in 2015.  As suspected, almost every hitter appears to be trying to hit the ball in the air.  There is an apparent relationship between Lift Bias and Hard%, suggesting that hitters who intend to hit the ball on a higher angle tend to record more hard hits per contact.  To see if this was due to harder hitters choosing to lift the ball more, I examined the relationship between Average Exit Speed and Lift Bias and the results are presented in Figure 6 below.

Exit speed and Lift Bias
Figure 6.  Average Exit Speed and Lift Bias.

Surprisingly, there is practically no relationship between Average Exit Speed and Lift Bias.  This suggests that Lift Bias is associated with Hard% independent of how forcefully a hitter strikes the ball.  Since Lift Bias and Average Exit Speed are independent predictors of Hard%, I modeled the effect of both simultaneously with multiple regression.  The model explained 75% of variance in Hard% overall, and the part and partial correlations are reported in Figure 7 below.

Regression coefficients
Figure 7.  Multiple regression coefficients. 

The part correlation value in Figure 7 indicates the unique variance explained by each predictor.  Thus, Average Exit Speed explained 52% of the total variance in Hard%.  The partial correlation value describes the proportion of the remaining variance explained by one predictor after accounting for the other.  Thus, after accounting for Average Exit Speed, Lift Bias explained 26% of the remaining variance in Hard%.

In order to determine how much of the relationship between Hard% and production can be accounted for by Average Exit Speed and Lift Bias, I plotted predicted Hard% against wRC+.  The results indicate that Average Exit Speed and Lift Bias together account for almost, but not quite all of the relationship between Hard% and wRC+. See Figure 8 below.

Predicted Hard% and wRC+
Figure 8.  Predicted Hard% and wRC+.

If you compare Figure 8 and Figure 4, you can see that real Hard% still explains more of wRC+ than predicted Hard%, but the predicted values are getting close.  Since Hard% is based on the result of each hit rather than a tendency to hit balls harder in the air or on the ground, it makes sense that Hard% should be more related to performance.  It is impressive that two variables not directly measured in Hard% explain so much of its variance, as well as such a high percentage of its relationship to wRC+.

DOES LIFT BIAS COME WITH A TRADE-OFF?

One of the most interesting results described above is the null relationship between exit speed and Lift Bias, suggesting that an increase in Lift Bias may be beneficial regardless of power. Yet again, intuition kicks in protesting that while it might be more effective for power hitters to try to lift the ball, when light hitters lift the ball the result is a fly out. Since Lift Bias is unrelated to exit speed, examining the relationship between Lift Bias and BABIP should give a hint as to whether increasing Lift Bias decreases the chances of getting at least a single.

Lift Bias and BABIP
Figure 9.  Lift Bias and Batting Average on Balls in Play (BABIP).

Lift bias apparently has no relationship to BABIP, which seems counterintuitive.  Does lift bias even have an effect on batted-ball type? Not really.  The relationship depicted in Figure 10 below is the strongest of all, and even then Lift Bias only explains 8% of the total variance in GB%.

Lift Bias and GB
Figure 10. Lift Bias and Ground Ball Rate (GB%).

The launch angle of a batted ball depends more on the offset of the ball and bat at contact than on the attack angle of the swing.  Thus, perhaps it shouldn’t be too surprising that an ostensible measure of swing plane has little relationship to batted ball distribution.  While offset largely determines launch angle, swings that have more positive attack angles (to a point) are more optimal for batted ball distance. If Lift Bias is based on a more positive attack angle, we might expect to see a positive relationship between Lift Bias and HR/FB.  In fact, as shown in Figure 11, Lift Bias accounts for 30% of the variance in home runs per fly ball.

Lift Bias and HR/FB
Figure 11.  Lift Bias and Home Runs per Fly Ball (HR/FB).

Lift Bias has a strong relationship to average distance, and a smaller but still significant relationship to maximum recorded distance as well.  These data suggest that swing plane may be responsible for at least part of the observed Lift Bias, since increased Lift Bias seems to optimize batted-ball distance.

If swing plane does drive Lift Bias, one might expect a trade-off between Lift Bias and contact skill.  Since pitches are typically thrown on a negative angle of around 6 degrees, and attack angles exceeding 6 degrees can result in farther hits, it follows that hitters may be using a more severe uppercut than a 6 degree “level” swing to generate Lift Bias.

I used the Real Contact measure from my previous study to estimate contact skill for the hitters who have data in the 2015 sample.  The results indicated that Lift Bias is negatively associated with Real Contact, accounting for about 20% of the variance. This is the first hint of the nuance between slugging and contact, suggesting that hitters may be using steep swing planes to generate lift.  Conversely, Real Contact was unrelated to Average Exit Speed, confirming the absence of a trade-off between force and accuracy.

COMPARISON OF PLAYERS WITH MOST OR LEAST LIFT BIAS

It still seems counterintuitive that all players would benefit from having a lift bias in the top range of the sample. Is it possible that players at either end of the Lift Bias distribution are especially powerful or light-hitting, causing the appearance of a true relationship but reflecting only selective sampling? To examine the players with the most extreme Lift Bias (or lack thereof), I divided the sample into two groups with the 50 most Lift Biased and 50 least Lift Biased players.  First, I tested for differences in the potential to generate power by comparing the two groups on maximum recorded exit speed. The group with the most Lift Bias had a mean Max Exit Speed of 111mph, while the low Lift Bias group had a mean of 110mph. There is little difference in power potential between the most Lift Biased players and the least.

Next, I tested for differences in power production by comparing the groups on HR/FB.  As you can see in Figure 12, the high Lift Bias group (.167) saw their fly balls leave the park over twice as often as the low Lift Bias group (.074).

Group means: Power
Figure 12.  Mean HR/FB for the Low Lift Bias and High Lift Bias groups. Error bars represent 95% confidence intervals.

Finally, I compared the two groups on overall production.  The high Lift Bias group had a mean wRC+ of 117, while the low Lift Bias group had a mean of 93.  The players with the largest Lift Bias are, on average, substantially better than league average.  Conversely, the players with the smallest Lift Bias are somewhat worse than the league average. Figure 13 presents the observed means with error bars representing 95% confidence intervals.

Group means: Production
Figure 13.  Mean wRC+ for the Low Lift Bias and High Lift Bias groups. 

The players with a large Lift Bias have basically the same power potential as the players with the least bias, yet they have much more power production.  The extra power production completely accounts for the difference in overall production between the groups, which is substantial.

CONCLUSION

Over the last two articles, I have been detailing a hierarchy of measurable skills that explain the majority of variance in hitting production.  Further, I have demonstrated that there is little trade-off between skills.  Fast exit velocity does not come at the expense of contact, and Lift Bias does not come at the expense of base hits.  There does appear to be a small trade-off between Lift Bias and contact, suggesting that situational hitting could require adjusting swing plane or intended trajectory.

Power is the most important skill to production and is comprised of two sub-skills: Hitting balls harder on average (measured by Average Exit Speed), and generating more Lift Bias (measured by subtracting AvgGB velocity from AvgLD/FB).  The next most important is contact skill, which was estimated by parceling the effect of Fastball% out of True Contact (a location-independent measure of contact), to provide an estimate of real contact ability independent of how a hitter is pitched.  Finally, speed and discipline (represented by Spd and O-Swing%) are equally important skills, but much less important than power. Figure 14 depicts the relative importance of each skill in estimating production.

The relative importance of hitting skills
Figure 14.  The relative importance of hitting skills.

It is tempting to assume this model is causal, when in fact the data are all correlational.  If the data were causal, the conclusions for hitting coaches would be obvious:  a) Optimizing exit speed with efficient mechanics and hard work should be an ongoing goal for every player, b) Players should focus on driving the ball in the air and the hitting coach should help his hitters optimize their Lift Bias, c) Equally important, hitters should practice their contact skills against all pitch types on a situational basis, d) Discipline, which can be trained, should get about half the attention that contact receives, and e) The league is full of underachievers – assuming Lift Bias is a learnable skill.

Science will require experimental evidence before concluding that the skill hierarchy provides a causal explanation of hitting production.  Hitters and coaches may not want to wait around.  Hey, Kevin Pillar! Give me a call…


The Truth About Power, Contact, and Hitting in General

The overarching purpose of this study was to identify the core skills that underlie hitting performance and investigate the extent to which hitters must choose between these skills. The article unfolds in two parts.  In Part 1, I explore the ostensible trade-off between power and contact in search of the optimal approach. Then in Part 2, I show that 66% of variance in wRC+ can be explained by four skill-indicators: power, contact, speed, and discipline.  It will be revealed that increasing hard contact should be of paramount importance to hitting coaches, while contact and discipline are complimentary assets.

PART ONE: IS THERE A POWER-CONTACT TRADE-OFF?

Eli Ben-Porat recently published a terrific study on the trade-off between contact ability and power and I will be building on his findings.  As such, I will be using the same sample as his study, which includes all players since 2008 who have swung at 1000 pitches or more. First, I want to explain why it is assumed that there is a trade-off between power and contact.  Not only is it intuitive that a hitter chooses between swinging for the fence and putting the ball in play — there is also clearly a trade-off between abilities among MLB hitters.  Here is a plot of the relationship between SLG on Contact and Contact%.

SLG and Contact
Figure 1. Contact Rate and SLG on Contact.

There is a strong inverse relationship between power and contact, explaining 42% of total variance.  However, Ben-Porat cited evidence that power hitters tend to face tougher pitches than light hitters, a factor that is likely to affect their contact rate.  When Ben-Porat controlled for effect of pitch location on contact rate, the relationship between contact and power dropped to an R2 of 33%. Figure 2 plots the relationship between Ben-Porat’s new True Contact, a location-independent measure of contact skill, and SLG on Contact.

SLG and True Contact
Figure 2. True Contact and SLG on Contact.

While controlling for location loosened the relationship between power and contact, there still appears to be a significant inverse correlation between the skills.  Is this lingering relationship due to a necessary trade-off between hitting for power and making contact? I propose not.  Instead, consider the relationship between Fastball% and SLG on Contact.

The graph in Figure 3 plots the relationship between percentage of fastballs faced and SLG on Contact.

SLG and Fastball%
Figure 3.  Percentage of Fastballs Faced and SLG on Contact.

Predictably, pitchers tend to throw fewer fastballs to more powerful hitters.  To parcel out the effect of pitch type, I examined the relationship between regular Contact% and SLG on Contact while controlling for Fastball%.  This strategy is similar to Ben-Porat’s approach but controls for pitch type rather than location.  The results of a simultaneous multiple regression analysis indicate that when holding Fastball% constant, Contact% explains just 12% of the variance in SLG on Contact.  In other words, most of the relationship between Contact% and SLG on Contact was due to differences in the amount of fastballs faced.

To do a little better, I examined the relationship between Fastball% and True Contact.  Figure 4 shows that Fastball% accounts for about a quarter of the variance in True Contact.  Understandably, as Fastball% increases so does True Contact.

Fastball% and True Contact
Figure 4.  Relationship between True Contact and Fastball%.

While True Contact controls for the location of pitches faced, it does not account for the proportion of fastballs faced.  When the effect of Fastball% is held constant, True Contact accounts for just 9% of the variance in SLG on Contact.  I computed a new Fastball%-independent version of True Contact, called Real Contact, and plotted it against SLG on Contact in Figure 5.

Real Contact and SLG
Figure 5. Relationship between Real Contact and SLG on Contact.

The plot resembles a shotgun distribution with only a slight relationship between power and contact left. It is possible this remaining relationship is due to what’s left of the “trade-off hypothesis.” If so, I suspected there would be evidence that an approach that maximizes slugging, such as hitting fly balls and pulling the ball, would be associated with lower Real Contact scores.  Instead, FB% explained only 2.6% and Pull% only 2.4% of total variance in Real Contact.  If there is real trade-off between contact and power, I still can’t isolate it.

Dr. Alan Nathan has demonstrated that home runs and base hits are optimized by different swing strategies.  The implication is that there is a trade-off between base hits and power. Perhaps a contact swing is a base-hit swing. I tested this notion, and Figure 6 plots the relationship.

babip and contact

Figure 6.  BABIP and Real Contact.

Surprisingly, contact and BABIP are unrelated.  This is a counter-intuitive null finding, like the non-association between LD% and Hard%. In this case, I think base-hit skill requires more than not-missing.

I can’t test my final explanation, but I think selective sampling could explain the remaining small association between contact and power.  Since hitters need to achieve a minimum level of success to stay in the league, it seems unlikely for hitters to lack both power and contact skills.  Further, a hitter deficient in one skill would need to make it up with the other to avoid being released.  Since I could not find evidence to support an adjustment-based trade-off between power and contact, I assume the skills are independent moving forward.

PART TWO: POWER, CONTACT, SPEED, AND DISCIPLINE

If power and contact are separate skills, how much does each contribute to a hitter’s overall production? What about speed and discipline?  To answer these questions, I conducted a multiple regression analysis with wRC+ as the dependent variable and Hard%, Real Contact, Spd, and O-Swing% included as predictors.  The predictors were chosen to reflect power, contact, speed, and discipline because they measure each construct without including outcome data that make up wRC+. A multiple regression allows us to measure the unique contribution of each predictor on wRC+ as well as the overall variance accounted for by all the predictors.

The correlation matrix for the four predictors and one dependent variable are presented in Figure 7.  Only Spd and Hard% have a zero-order correlation over .20, with an R2 of 11.6%.  The four skills are mostly unique, which means the model avoids statistical problems of multicollinearity and singularity.

Matrix
Figure 7. Correlation matrix indicating zero-order correlations in the top row, 1-tailed p-values in the second row, and sample size in the third row.

The results of the multiple regression are presented in Figure 8.  Note the adjusted R2 of .66 indicating that the four predictors explained 66% of total variance in wRC+.

Model Summary
Figure 8. Results of multiple regression.  Hard%, Real Contact, Spd, and O-Swing% predicted 66% of variance in wRC+.

The specific contribution of each measure is indicated in Figure 9.  The Part Correlation statistic describes the unique contribution (R) of each predictor to explaining wRC+. When considering all predictors together, Hard% accounts for 60% of the variance in wRC+. The remaining three skills provide only incremental value compared to hitting the ball hard.

Coefficients
Figure 9.  Coefficients and Correlations from multiple regression.

The Partial Correlation statistic indicates the proportion of the remaining variance explained by each predictor while controlling for the effects of the others.  In other words, when controlling for Hard%, Spd, and O-Swing%, Real Contact explains 24% of the remaining variance in wRC+.

The strength of the multiple regression approach is clear when comparing the zero-order correlations to the partial and part correlations.  In every case, the part and partial correlations are larger, suggesting that each predictor benefits from the inclusion of the others in the model. Further, the relationship between each skill and wRC+ seems more intuitive when the contribution of the other skills is accounted for.  For example, Spd has a slight negative association with wRC+ on its own, but a positive relationship accounting for 11% of the remaining variance when included with the other predictors. It makes sense that speed is helpful, all else being equal.  Similarly, Real Contact and O-swing% have larger, more intuitive relationships to wRC+ when controlling for all predictors.

CONCLUSION

I conducted this research from a coach and player’s perspective, with the goal of identifying the ideal composition of hitting skill. Previous research has already reported a strong association between Hard% and wRC+, and this study only reaffirms the contribution of Hard% to overall production.  Given the same amount of speed, discipline, and contact skill, hard-hit percentage accounts for over two-thirds of remaining variance in a hitter’s wRC+.

A novel finding of this study is that there is little to no trade-off between power and contact ability.  Almost all of the apparent effect was due to differences in how power hitters and light hitters are pitched.  Given the same pitches, power hitters can make as much contact as light hitters. For example, Albert Pujols ranks 10th in the sample in Hard% and 15th in Real Contact.

The truth about hitting is that every hitter is swinging the bat just about as fast as they can. They are racing 95+, so they don’t really have a choice.  That doesn’t leave a lot of room for a hitter to consciously swing easier.  The hitter can choose to take a “shorter” swing, but should only do so if it results in more hard contact (or the same amount and more overall contact). Hitting the ball hard is the name of the game. Making contact, running well, and being disciplined complete the package.


The Risk and Reward of Attempting to Pick Runners Off

Recently, Dave Cameron examined a planned back-pick by Russell Martin and the Blue Jays in Game 1 of the ALDS.  The play didn’t have a chance to happen because Delino DeShields put a 2-1 change up in play.  Not just in play, but on the ground to directly where the second baseman Ryan Goins would have been had he not been breaking for second in anticipation of the pick.  Dave wrote a great article that covered the play in depth, so feel free to go read it here.  In this article, I analyze the strategy of calling for a set pickoff attempt. What I found not only vindicates Martin and the Jays, but also questions one of my longest-held beliefs about pickoffs.

My strategy for evaluating the set pickoff was to calculate the break-even point (BEP) for a pickoff attempt using Run Expectancy (RE), similar to previous analyses on bunting and stealing. To calculate the BEP for a given pickoff attempt, I calculated the RE benefit (to the defense) of an out and the weighted RE cost of a safe call or an error.  This sounds simple enough, but calculating the RE after an error involved some guesswork.

Although errors can result in multiple outcomes, I chose to pick one outcome for each base to simplify the analysis. Thus, I assumed 2 bases for all runners on an errant throw to first, 1 base for all runners on an error to second, and, after much thought, 2 bases for runners on second and 1 base for runners on the corners on an error to third. If you have data that can replace these assumptions, please let me know.  Otherwise, be cognizant of my assumptions when you attempt to make use of the findings.  For example, if there is a slow runner on second, the BEP for a pickoff attempt to a corner will be overly conservative (inflated).  Additionally, I didn’t differentiate between pickoff attempts from the pitcher and the catcher.  The pitcher has a shorter, unobstructed throw, and favorable balk rules when picking to second or third, but still has to deal with the risk of a balk, especially to first, along with the added difficulty of throwing off the mound.  Finally, while calling for a back-pick from the catcher can put a defender out of position, I chose to ignore this factor because a) I assume it is rare for a hitter to find the vacated hole, and b) the defense can choose to avoid contact.

In order to weight the cost of a failed pickoff attempt appropriately, I had to estimate what the error rate would be on attempts.  While we do have data on pitcher error rates on pickoff attempts (around 0.95%), the data are only from throws to first.  Set pickoff plays are more challenging for the defense, so the error rate should be higher than on typical attempts to first.  My solution, in lieu of empirical data from actual set pickoff attempts, was to estimate catchers’ throwing error rates from the 2015 season.  I chose this strategy for two reasons: First, catchers are one of the primary players who can attempt a set pickoff, so it made sense to sample from their performance.  And second, catchers accumulate a large portion of their assists under similar conditions to the pickoff attempt (for example, in 2015 nearly 40% of all catcher assists came from caught stealing).  Thus, I expected catcher throwing error rates to approximate the error rates we would observe on set pickoff plays.

While not a perfect method, I estimated catcher throwing error rate as Throwing Errors / Assists + Throwing Errors + Stolen Bases.  The mean throwing error rate in a sample of catchers (n = 38) who played at least 500 innings in 2015 was 3.6%.  Do you accept that set pickoff plays will result in 3.8 times more errors than typical pickoff throws to first? If not, adjust your own estimates accordingly.

Using the estimated throwing error rate for catchers, the formula for estimating the BEP on a set pickoff attempt is RE cost / (RE cost – RE benefit). In this equation, RE benefit = RE after a pickoff – RE before a pickoff; RE cost = RE before a failed attempt – RE with a failed attempt, and RE with a failed attempt = (RE of a safe call *.964) + (RE of an error *.036).  Using the RE tables found here, I generated Table 1 below.


Runners Outs First Second Third
1 _ _ 0 3.51%
1 3.32%
2 3.24%
1 2 _ 0 3.32% 2.18%
1 4.21% 1.93%
2 9.17% 2.33%
1 _ 3 0 2.37% 0.74%
1 3.47% 1.92%
2 6.72% 5.99%
_ 2 3 0 1.70% 1.41%
1 1.93% 1.73%
2 5.06% 5.06%
1 2 3 0 10.21% 1.97% 1.64%
1 4.85% 2.78% 2.48%
2 7.58% 3.92% 3.92%
_ 2 _ 0 1.54%
1 1.43%
2 1.26%
_ _ 3 0 0.11%
1 1.74%
2 5.61%

Table 1.  Success rate required to attempt a pick at each base.

Table 1 presents the BEP for the defense of (successful pickoffs / attempts) X 100.  In other words, Table 1 provides the minimum expectation of success required for the defense to attempt a set pickoff and it be a break-even strategy. Unfortunately, it is difficult to guess how successful set pickoff attempts typically are.  In Dan Malkiel’s study of pickoffs to first, he found that righties and lefties were successful about 2% and 4% of the time, respectively.  However, Malkiel’s study sampled situations with base-stealers on first, so the stolen-base rate was between 17% and 21%.  It’s impossible to know what percentage of successful pickoffs occurred when the runner intended to steal, but it’s safe to say 2% and 4% success rates are a little high if the runner on first isn’t planning on going. Set pickoffs usually work differently than throws to first, since neither the pickoff nor the steal are always expected. Therefore, the data on picks to first can only serve as a point of reference, helping to calibrate expectations rather than serving as predictions themselves.

One way to assess if teams are over- or under-utilizing set pickoffs is to compare their pickoff to error ratios with the BEPs for that metric. Unfortunately, I could only find data for one special case of the set pickoff: a catcher back-pick to first.  In the Malkiel study, successful back-picks were 96% of back-picks plus errors.  If we assume an error puts the runner on third, the BEP for pickoffs/pickoffs + errors is 50%, suggesting that catchers have room to get much more aggressive in attempting to pick runners off first.  Without more data, it’s difficult to comment further on current MLB behaviour regarding set pickoff plays. Nevertheless, the estimates in Table 1 provide interesting insights into the risks and rewards of pickoff plays. Below, I list six lessons that can be gleaned from Table 1.  At least two of these lessons fly directly in the face of my own long-held beliefs, and maybe yours too!

Lesson 1

If, at any time, the defense notices that it has better than a 15% chance of picking off a runner, they should attempt the pickoff.

Lesson 2

Pickoff attempts require greater confidence with two outs, with three exceptions.  Often, the required success rate is over 5%, requiring a fairly egregious mistake by the runner to warrant a throw. The exceptions to this rule are with a runner on first, a runner on second, or a pick to second with runners on first and second.

Lesson 3

A runner on second with no runner ahead of him should probably be targeted frequently.  The BEPs are consistently low for attempting the pickoff to second, while the runner is motivated to be aggressive by the chance to score a run or steal third. Even failed attempts have the favorable by-product of keeping the runner close, a factor not considered in Table 1.

Lesson 4

Throwing behind the runner on first with runners on first and second or the bases loaded is dangerous.  This doesn’t mean it’s a bad play if the runner on first opens the door, but the defense should be really confident to make the throw.

Now for the lessons that go against everything I thought I knew…

Lesson 5

Pitchers should throw over to third with runners on 1st and 3rd in a steal situation.  Ever since the MLB outlawed the fake-to-third move, pitchers haven’t been allowed to bluff the throw in hopes of catching the runner breaking from first.  Based on Table 1, it seems strange that pitchers ever faked the throw to begin with.  With no one out, the defense would only need to pick the runner off third 8 times per 1000 attempts, or nail the runner stealing second 3 times per 100 attempts, or a combination of the two to break even.  Additionally, if the runner on first breaks for second it’s an easier throw from third than from first, which was often the result with the fake-to-third move.  While many old-school baseball people will object to throwing over to third, the common refrain “he’s not going anywhere!” doesn’t necessarily apply to the 1st and 3rd steal situation.  The runner could be trying to get closer to home so he can steal on the catcher’s throw to second, making it the perfect time to throw over.  Although the third baseman’s positioning will sometimes make a true pickoff attempt at third difficult, the rules do not require the pitcher to throw directly to third.  Thus, teams can make legitimate efforts to get the runner on third when the situation allows it, while other times making throws away from the base solely to catch the runner on first breaking for second.

Lesson 6

The situation that requires the lowest probability of success to attempt a pickoff is when there is a runner on third with no one out.  The defence needs to nab merely 2 runners out of every 1000 attempts to break even. And get this, the BEP on pickoff attempts to third with 0 out is lower than the BEP for typical throws to first, even with the much lower error rate on throws to first (0.95%), and even after adjusting the assumed cost of an error to one base.  Holding probability of success constant, the pickoff attempt to get a runner on third with 0 out is the least risky pickoff attempt possible. The LEAST risky.

Of course, a runner who is on third with no one out should be taking no chances.  But that doesn’t mean a pickoff will never work…