The Truth About Hitting the Ball Hard
I recently presented evidence that power and contact are independent skills. An increase in power does not have to come at the cost of contact. Surely intuition disagrees with these findings and when that happens you should be skeptical. I would be skeptical.
One reason a trade-off between power and contact is intuitive is that we are accustomed to speed-accuracy trade-offs for many everyday actions. For example, we slow down when we pour a fresh cup of coffee because going too fast is dangerous. Implicitly, we assume there is a speed-accuracy trade-off when we suggest that hitters can cut down on their swing to achieve more contact. Richard A. Schmidt is like the Bill James of my field — motor behaviour — and in 1979 he and his colleagues published the Theory of Accuracy for Rapid Tasks. According to Google it has been cited over 1200 times. While speed-accuracy trade-offs for movement are typical, the theory explains that rapid timing tasks like hitting are an exception to this rule.
The theory is a dense 46-pager including equations, but I’ll provide a couple critical graphs to illustrate its implications to hitting. First, Figure 1 presents the results of an experiment that investigated the effect of movement distance and movement time on spatial error.
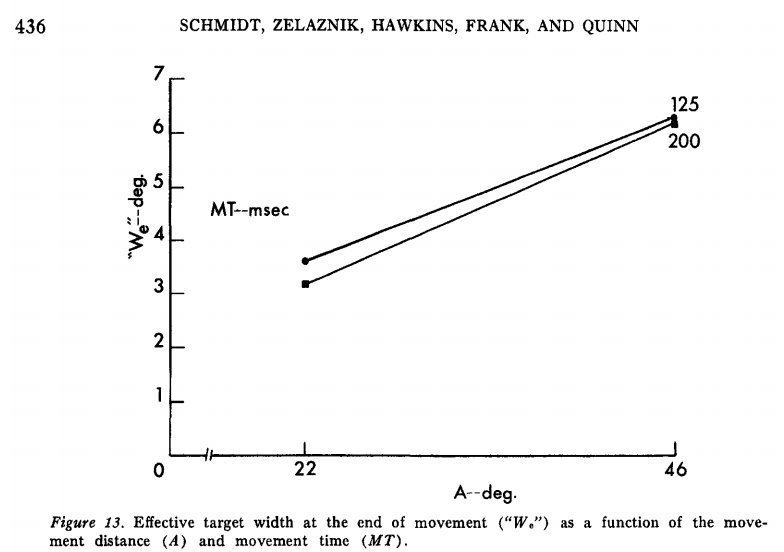
Figure 1. Spatial error (“We”–deg.) as a function of movement time (MT–msec) and movement distance (A–deg).
The results indicate that movement time, that is, movement speed, had almost no impact on spatial error. You’ll notice that the movement times tested in this experiment are conveniently reflective of a short and a long MLB swing (per Zepp). The movement distances in the experiment were shorter than a swing, and the task far simpler, but the results are suggestive nonetheless.
A second experiment explored the effect of movement speed and distance on timing error. Unlike the experiment above, movement speed did have an effect on timing error. Figure 2 presents data indicating that faster movements result in significantly less timing error than slower movements, irrespective of movement distance.
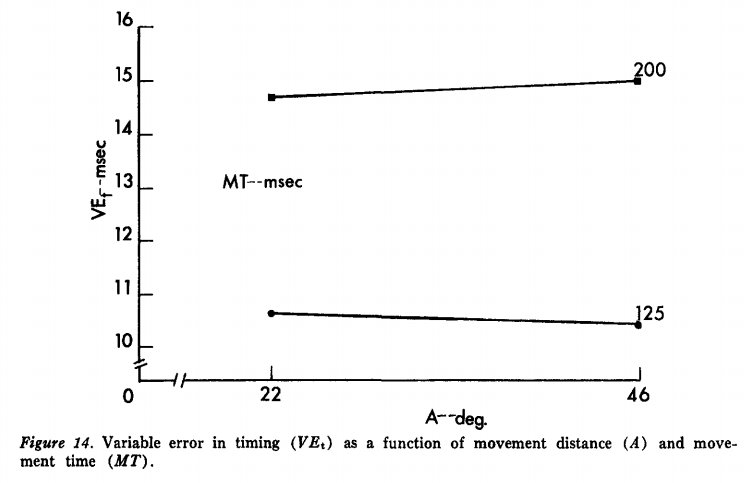
Figure 2. Timing error (VEt–msec) as a function of movement time (MT–msec) and distance (A–deg).
In addition to these two examples, there is a substantial empirical and theoretical framework suggesting rapid timing tasks are exempt from a speed-accuracy trade-off. Swinging slower does not increase a hitter’s chance to make contact. On the basis of these data and the data I presented previously, it seems that hitters can try to hit the ball as hard as possible, within reason, without sacrificing contact or base-hit skill.
UNDERSTANDING HARD%
Power, contact, speed and discipline account for 66% of variance in hitting production. Power, measured by Hard%, is by far the most important skill. But what does Hard% measure, exactly? The description of Hard% can be found in the glossary here. Basically, Hard% describes the proportion of batted balls that meet an unknown criteria for “hardness,” and depends on hit-type, hang-time, landing-spot, and trajectory. Importantly, Hard% does not include exit speed in its calculation.
In the plot below, Average Exit Speed for players with a minimum of 190 Abs in 2015 is plotted against their Hard%. It is pretty clear from Figure 3 that while Hard% doesn’t directly measure exit speed, it does a pretty good job of estimating it.
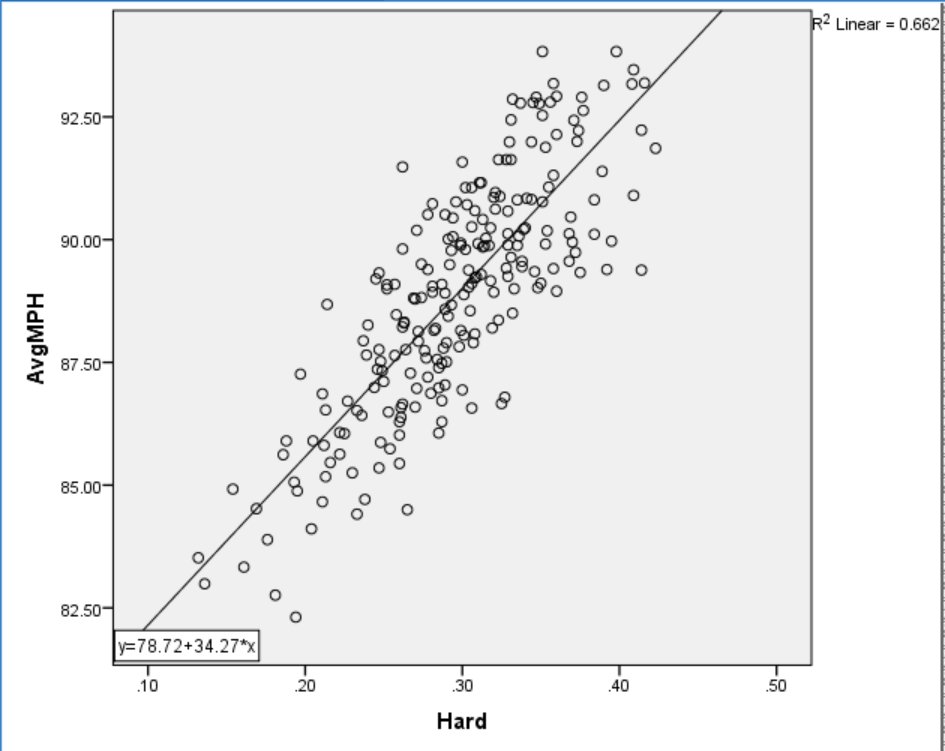
Figure 3. Average Exit Speed and Hard%.
Given the tight relationship between Average Exit Speed and Hard%, I wondered if both measures were equally effective at predicting production. The graphs in Figure 4 and Figure 5 present both power measures plotted against wRC+.
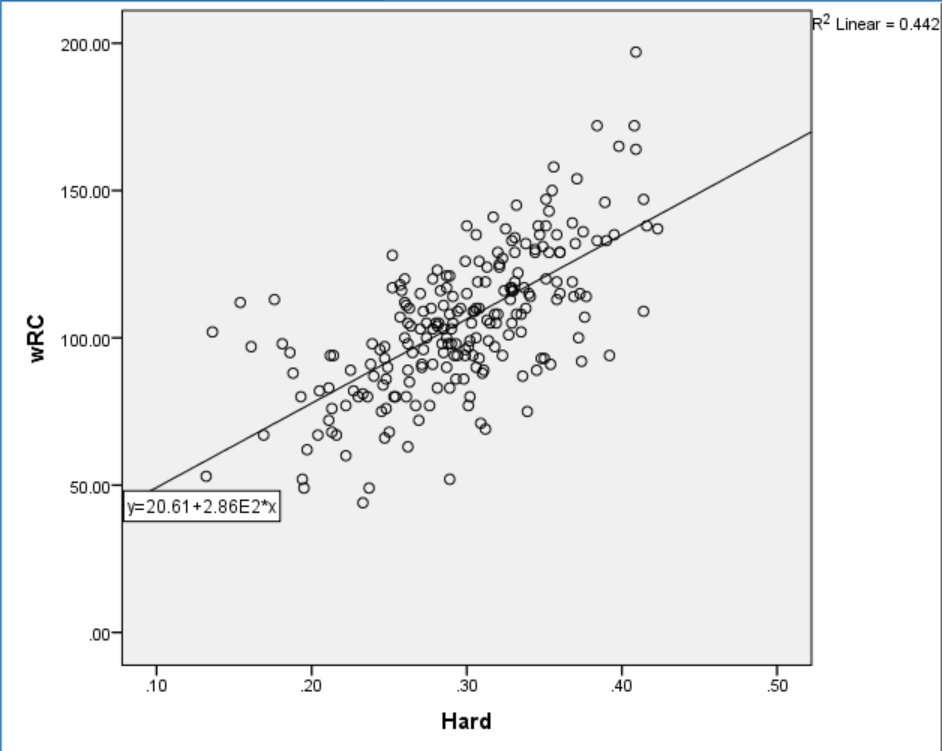
Figure 4. Hard% and wRC+.
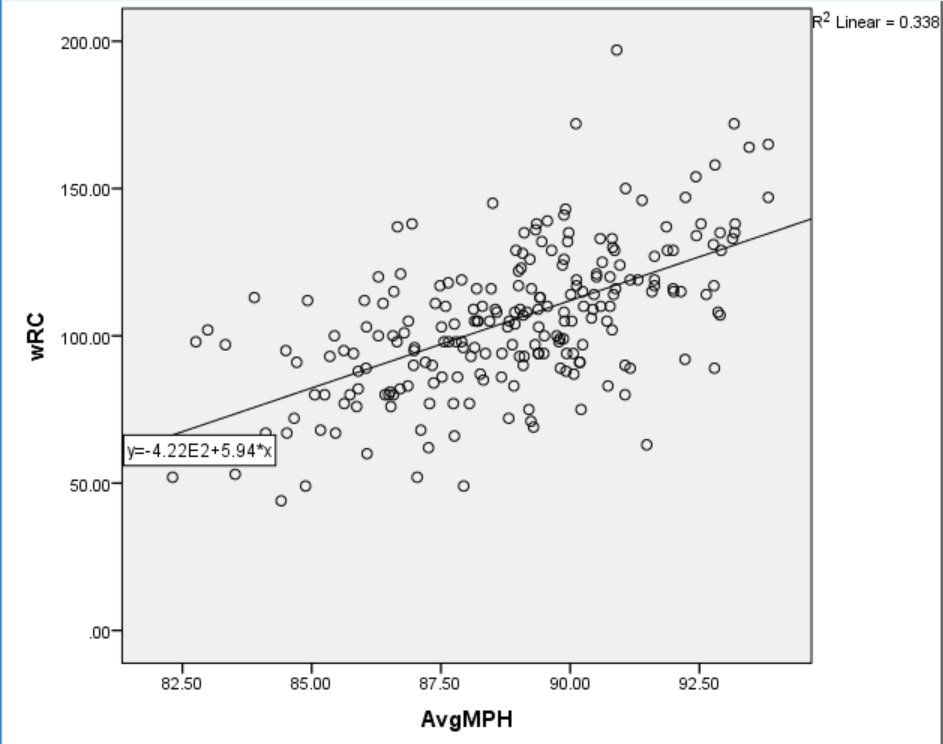
Figure 5. Average Exit Speed and wRC+.
Hard% does a better job of predicting production than Average Exit Speed, explaining about 23% more variance. Since exit speed is a more direct measurement of power than Hard%, it follows non-power related data included in Hard% are relevant to production. Previous research suggests that hit-type and trajectory are important to the outcome of a batted ball, and since both variables are used to calculate Hard%, it seems likely they contribute to the relationship between Hard% and wRC+.
INTRODUCING LIFT BIAS
Trajectory is tightly linked to outcome and hitters only control the trajectory (or angle) they intend to hit the ball on. We have no way to measure hitters’ intentions. The only data on vertical launch angle that I’ve been able to access are extremely limited, or incomplete, so we can’t estimate hitters’ intentions based on results. If we had a database of swing-plane information we could estimate each hitter’s intentions based on his average swing plane relative to the pitch, but we don’t have such a database. What we do have are data on each hitter’s average exit velocity on ground balls, as well as their average exit velocity on line drives and fly balls. If we assume that each hitter is trying to hit the ball as forcefully as possible along their intended trajectory, and further assume that over the course of a season exit velocity will be maximal around the force vector intended by the hitter, then we can infer each hitter’s bias toward lower or higher trajectory hits by subtracting their average ground-ball velocity from their average line-drive / fly-ball velocity. The lower the resultant value, the lower the trajectory we can assume the hitter intended. I examined the relationship between AvgLD/FB – AvgGB (or, Lift Bias) and Hard% and the results are in Figure 6 below.
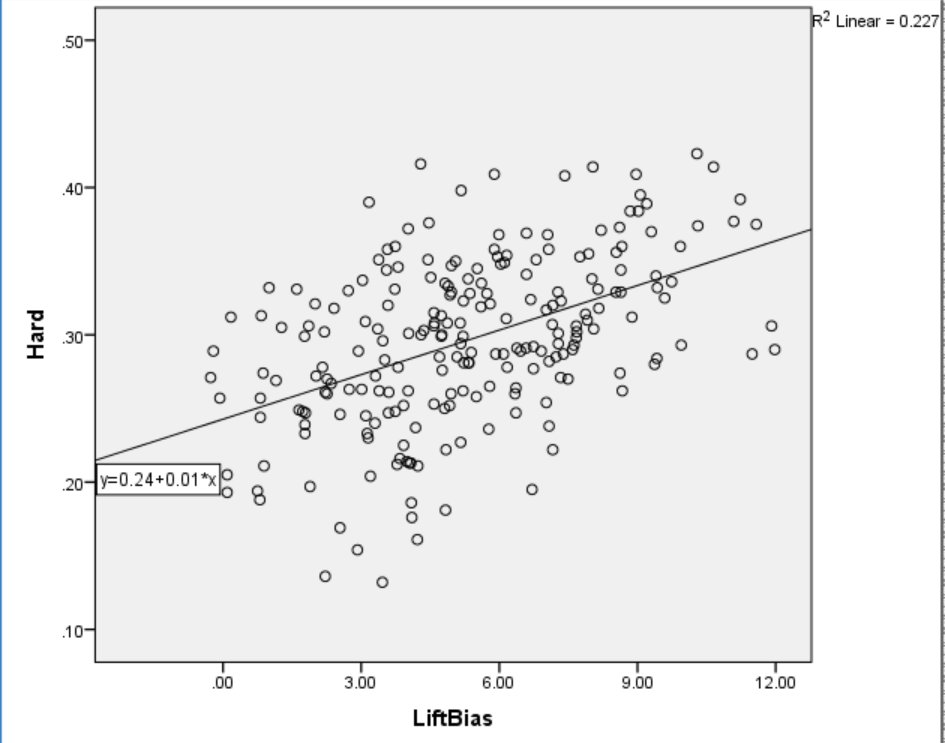
Figure 6. Lift Bias and Hard%.
Almost every hitter in the sample hit the ball harder in the air than on the ground. Only Melky Cabrera, Jason Heyward, and Nick Markakis hit their ground balls harder than their line drives and fly balls in 2015. As suspected, almost every hitter appears to be trying to hit the ball in the air. There is an apparent relationship between Lift Bias and Hard%, suggesting that hitters who intend to hit the ball on a higher angle tend to record more hard hits per contact. To see if this was due to harder hitters choosing to lift the ball more, I examined the relationship between Average Exit Speed and Lift Bias and the results are presented in Figure 6 below.
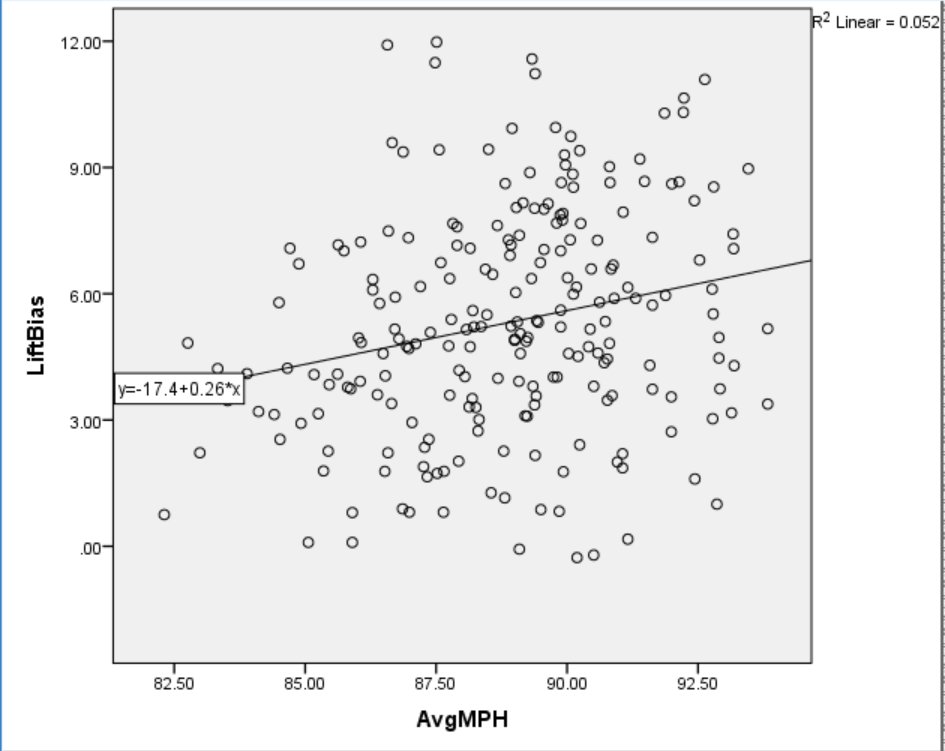
Figure 6. Average Exit Speed and Lift Bias.
Surprisingly, there is practically no relationship between Average Exit Speed and Lift Bias. This suggests that Lift Bias is associated with Hard% independent of how forcefully a hitter strikes the ball. Since Lift Bias and Average Exit Speed are independent predictors of Hard%, I modeled the effect of both simultaneously with multiple regression. The model explained 75% of variance in Hard% overall, and the part and partial correlations are reported in Figure 7 below.

Figure 7. Multiple regression coefficients.
The part correlation value in Figure 7 indicates the unique variance explained by each predictor. Thus, Average Exit Speed explained 52% of the total variance in Hard%. The partial correlation value describes the proportion of the remaining variance explained by one predictor after accounting for the other. Thus, after accounting for Average Exit Speed, Lift Bias explained 26% of the remaining variance in Hard%.
In order to determine how much of the relationship between Hard% and production can be accounted for by Average Exit Speed and Lift Bias, I plotted predicted Hard% against wRC+. The results indicate that Average Exit Speed and Lift Bias together account for almost, but not quite all of the relationship between Hard% and wRC+. See Figure 8 below.
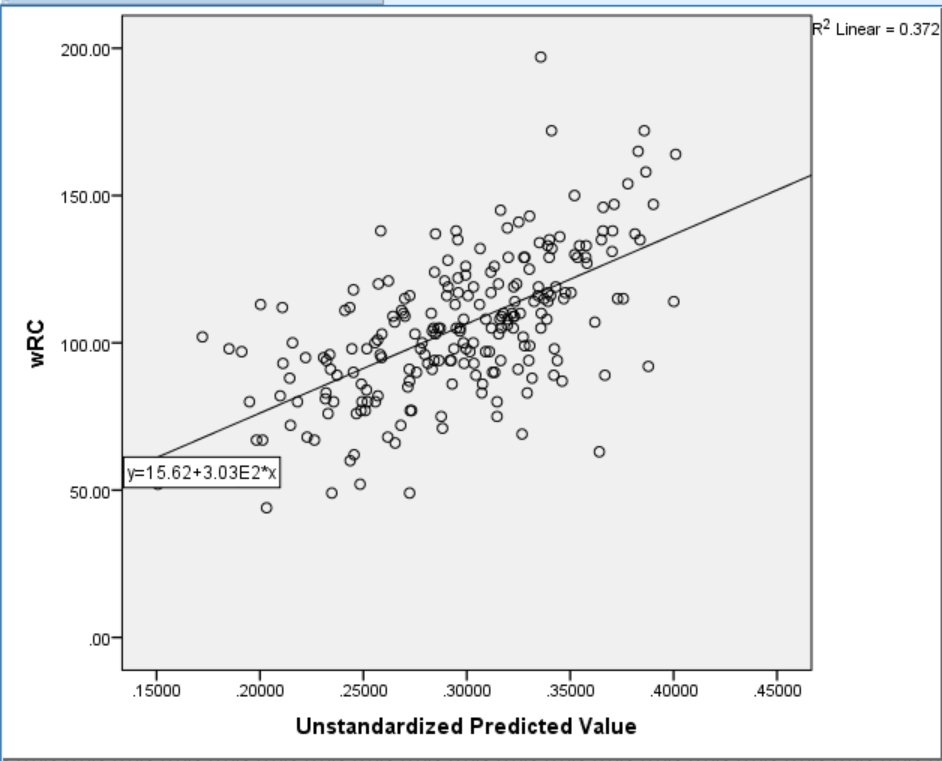
Figure 8. Predicted Hard% and wRC+.
If you compare Figure 8 and Figure 4, you can see that real Hard% still explains more of wRC+ than predicted Hard%, but the predicted values are getting close. Since Hard% is based on the result of each hit rather than a tendency to hit balls harder in the air or on the ground, it makes sense that Hard% should be more related to performance. It is impressive that two variables not directly measured in Hard% explain so much of its variance, as well as such a high percentage of its relationship to wRC+.
DOES LIFT BIAS COME WITH A TRADE-OFF?
One of the most interesting results described above is the null relationship between exit speed and Lift Bias, suggesting that an increase in Lift Bias may be beneficial regardless of power. Yet again, intuition kicks in protesting that while it might be more effective for power hitters to try to lift the ball, when light hitters lift the ball the result is a fly out. Since Lift Bias is unrelated to exit speed, examining the relationship between Lift Bias and BABIP should give a hint as to whether increasing Lift Bias decreases the chances of getting at least a single.
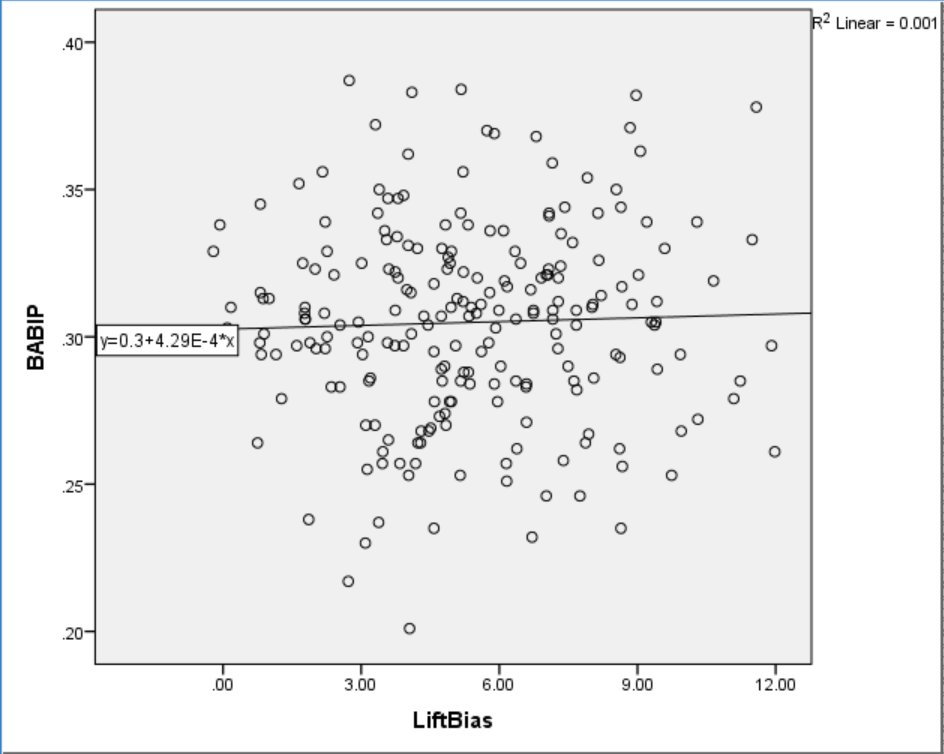
Figure 9. Lift Bias and Batting Average on Balls in Play (BABIP).
Lift bias apparently has no relationship to BABIP, which seems counterintuitive. Does lift bias even have an effect on batted-ball type? Not really. The relationship depicted in Figure 10 below is the strongest of all, and even then Lift Bias only explains 8% of the total variance in GB%.
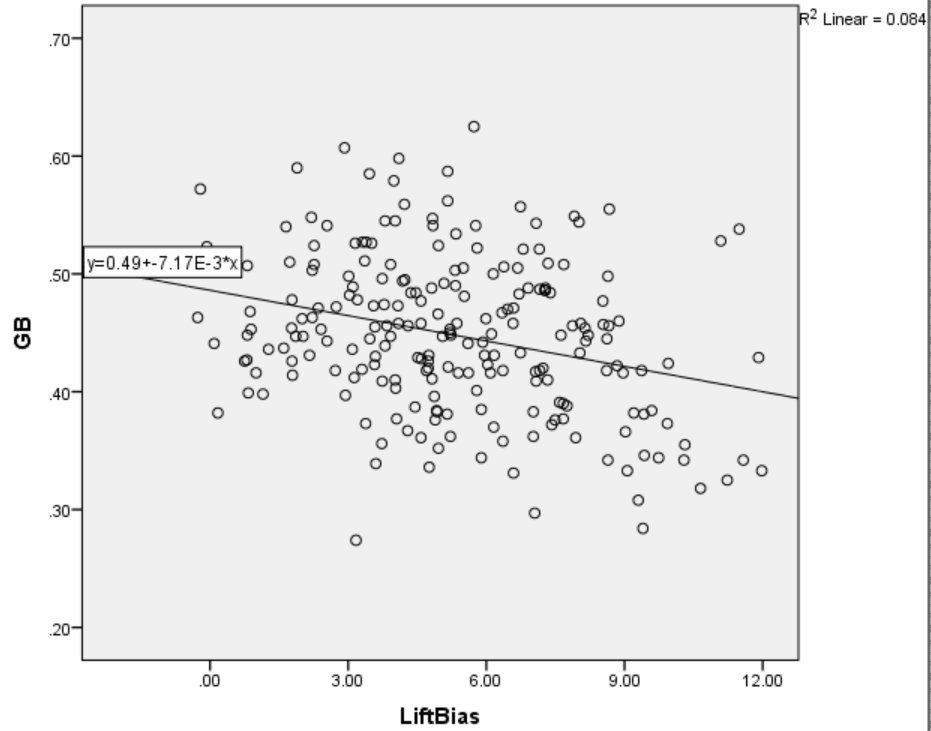
Figure 10. Lift Bias and Ground Ball Rate (GB%).
The launch angle of a batted ball depends more on the offset of the ball and bat at contact than on the attack angle of the swing. Thus, perhaps it shouldn’t be too surprising that an ostensible measure of swing plane has little relationship to batted ball distribution. While offset largely determines launch angle, swings that have more positive attack angles (to a point) are more optimal for batted ball distance. If Lift Bias is based on a more positive attack angle, we might expect to see a positive relationship between Lift Bias and HR/FB. In fact, as shown in Figure 11, Lift Bias accounts for 30% of the variance in home runs per fly ball.
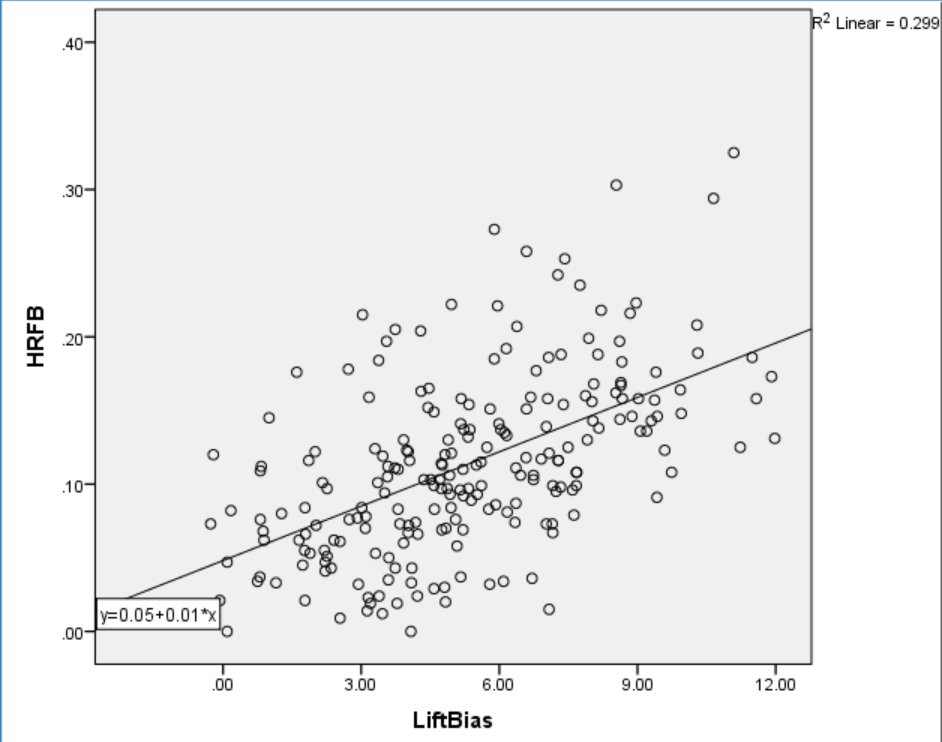
Figure 11. Lift Bias and Home Runs per Fly Ball (HR/FB).
Lift Bias has a strong relationship to average distance, and a smaller but still significant relationship to maximum recorded distance as well. These data suggest that swing plane may be responsible for at least part of the observed Lift Bias, since increased Lift Bias seems to optimize batted-ball distance.
If swing plane does drive Lift Bias, one might expect a trade-off between Lift Bias and contact skill. Since pitches are typically thrown on a negative angle of around 6 degrees, and attack angles exceeding 6 degrees can result in farther hits, it follows that hitters may be using a more severe uppercut than a 6 degree “level” swing to generate Lift Bias.
I used the Real Contact measure from my previous study to estimate contact skill for the hitters who have data in the 2015 sample. The results indicated that Lift Bias is negatively associated with Real Contact, accounting for about 20% of the variance. This is the first hint of the nuance between slugging and contact, suggesting that hitters may be using steep swing planes to generate lift. Conversely, Real Contact was unrelated to Average Exit Speed, confirming the absence of a trade-off between force and accuracy.
COMPARISON OF PLAYERS WITH MOST OR LEAST LIFT BIAS
It still seems counterintuitive that all players would benefit from having a lift bias in the top range of the sample. Is it possible that players at either end of the Lift Bias distribution are especially powerful or light-hitting, causing the appearance of a true relationship but reflecting only selective sampling? To examine the players with the most extreme Lift Bias (or lack thereof), I divided the sample into two groups with the 50 most Lift Biased and 50 least Lift Biased players. First, I tested for differences in the potential to generate power by comparing the two groups on maximum recorded exit speed. The group with the most Lift Bias had a mean Max Exit Speed of 111mph, while the low Lift Bias group had a mean of 110mph. There is little difference in power potential between the most Lift Biased players and the least.
Next, I tested for differences in power production by comparing the groups on HR/FB. As you can see in Figure 12, the high Lift Bias group (.167) saw their fly balls leave the park over twice as often as the low Lift Bias group (.074).
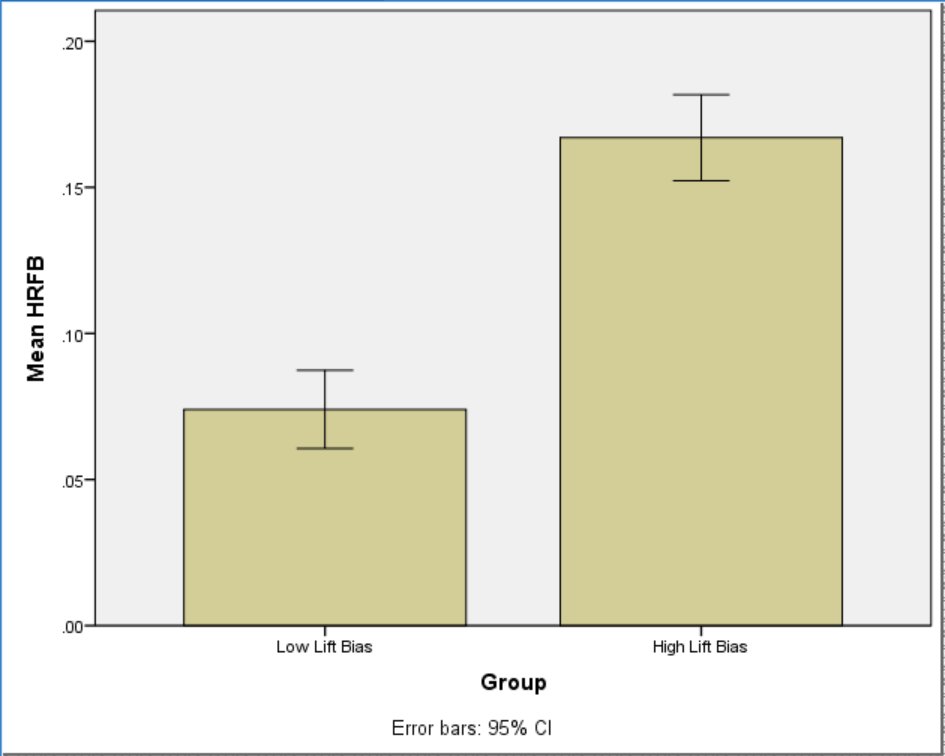
Figure 12. Mean HR/FB for the Low Lift Bias and High Lift Bias groups. Error bars represent 95% confidence intervals.
Finally, I compared the two groups on overall production. The high Lift Bias group had a mean wRC+ of 117, while the low Lift Bias group had a mean of 93. The players with the largest Lift Bias are, on average, substantially better than league average. Conversely, the players with the smallest Lift Bias are somewhat worse than the league average. Figure 13 presents the observed means with error bars representing 95% confidence intervals.
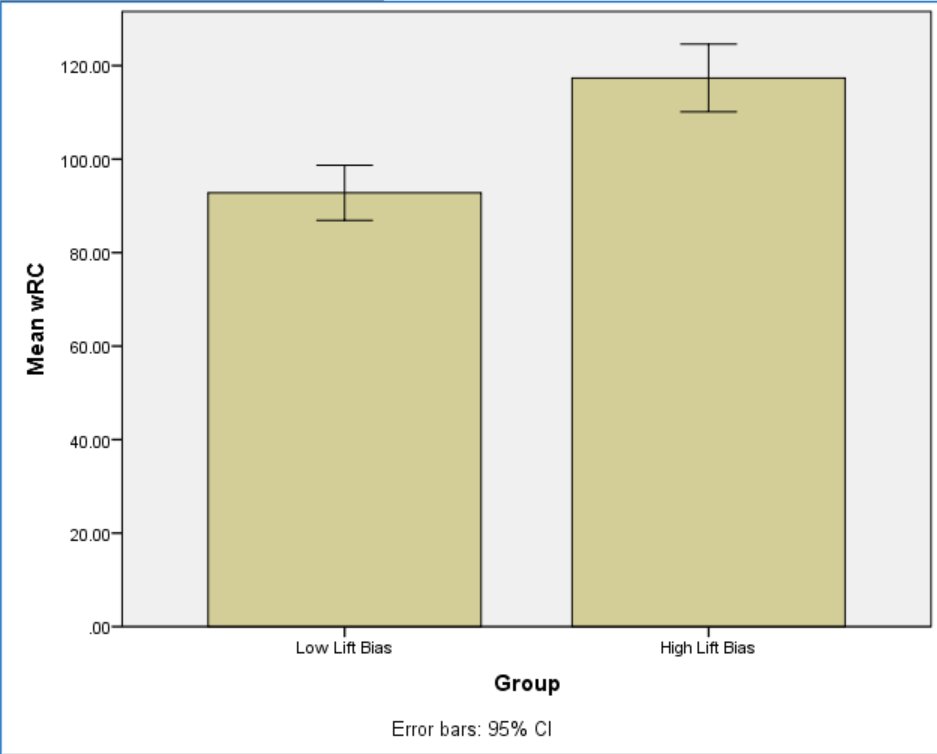
Figure 13. Mean wRC+ for the Low Lift Bias and High Lift Bias groups.
The players with a large Lift Bias have basically the same power potential as the players with the least bias, yet they have much more power production. The extra power production completely accounts for the difference in overall production between the groups, which is substantial.
CONCLUSION
Over the last two articles, I have been detailing a hierarchy of measurable skills that explain the majority of variance in hitting production. Further, I have demonstrated that there is little trade-off between skills. Fast exit velocity does not come at the expense of contact, and Lift Bias does not come at the expense of base hits. There does appear to be a small trade-off between Lift Bias and contact, suggesting that situational hitting could require adjusting swing plane or intended trajectory.
Power is the most important skill to production and is comprised of two sub-skills: Hitting balls harder on average (measured by Average Exit Speed), and generating more Lift Bias (measured by subtracting AvgGB velocity from AvgLD/FB). The next most important is contact skill, which was estimated by parceling the effect of Fastball% out of True Contact (a location-independent measure of contact), to provide an estimate of real contact ability independent of how a hitter is pitched. Finally, speed and discipline (represented by Spd and O-Swing%) are equally important skills, but much less important than power. Figure 14 depicts the relative importance of each skill in estimating production.
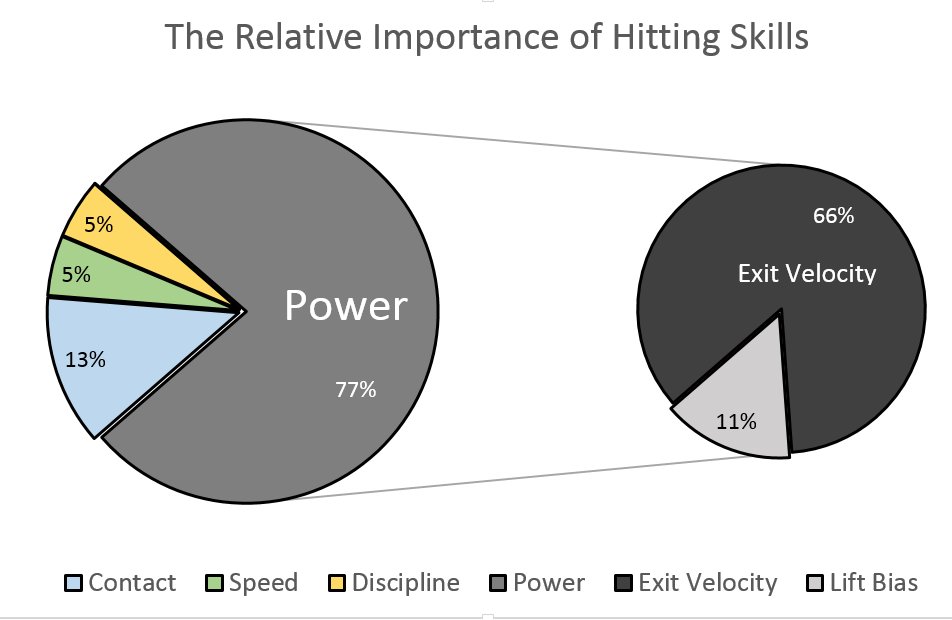
Figure 14. The relative importance of hitting skills.
It is tempting to assume this model is causal, when in fact the data are all correlational. If the data were causal, the conclusions for hitting coaches would be obvious: a) Optimizing exit speed with efficient mechanics and hard work should be an ongoing goal for every player, b) Players should focus on driving the ball in the air and the hitting coach should help his hitters optimize their Lift Bias, c) Equally important, hitters should practice their contact skills against all pitch types on a situational basis, d) Discipline, which can be trained, should get about half the attention that contact receives, and e) The league is full of underachievers – assuming Lift Bias is a learnable skill.
Science will require experimental evidence before concluding that the skill hierarchy provides a causal explanation of hitting production. Hitters and coaches may not want to wait around. Hey, Kevin Pillar! Give me a call…
Player, coach, researcher. I love the game for its own sake.
Hey Brad. Don’t think we’ve ever met. You have done some interesting research. There are a few things I am trying to understand better. Can we open up an off-line dialogue via e-mail? Thanks….Alan Nathan
Hi Alan. Absolutely. mckay_baseball at mail dot com. Look forward to hearing from you.
This is an extremely interesting and well-presented article, nice work
Learned a lot reading this, thanks for putting the great post together!