Archive for plate approach

Is Yoan Moncada’s Breakout Coming?

Yoan Moncada has frustrated talent evaluators over the past two years. He’s about as physically talented as a baseball player can be; while still a prospect, the team here at FanGraphs thought he merited future grades of 60 hit, 60 power, 70 speed, 50 field, and 70 throw, with an OFP of 70 good for No. 1 overall prospect status. Prospects don’t get evaluated much better than that; in fact, a 70 OVR on a position player is as good as it gets. He was the kind of prospect that could headline a trade for a top-five starting pitcher, a bonafide ace, in his prime on a team-friendly contract with three years left.

Flash forward two years, about a year and a half into Moncada’s major league career, and he hasn’t performed quite as billed. Instead, in 901 career plate appearances before Opening Day 2019, he posted a 97 career wRC+ and 3.1 total fWAR, almost exactly league-average or slightly below. His defense at second base has not impressed, and so he’s being moved to the hot corner in the wake of 1) the White Sox whiffing on Manny Machado, and 2) the White Sox drafting “future Gold Glove second sacker” Nick Madrigal with the 4th overall pick in 2018. If nothing changes, he’s be in danger of becoming a utilityman.

Moncada’s offensive struggles are a little unusual. He has two traits required to be an offensive monster — power and patience — in abundance. Last year, his average exit velo of 90.6 mph was in the 86th percentile, while his 4.12 pitches seen per PA was in the 81st percentile. However, those positive traits were offset by the modern game’s bugaboo — strikeouts. Moncada struck out in an ugly 33.4% of his PAs last year, behind only Chris Davis and Joey Gallo, and his career K rate sat at 33.6% this offseason. This is very concerning, as contact issues are a flaw that are difficult to resolve.

The profile above seems to describe a three-true-outcomes hitter like the aforementioned Gallo. Dig a little deeper, though, and you’ll find that how Moncada struck out that often is not normal, and in a sense he doesn’t actually have contact issues, at least not 33.4% bad. He didn’t chase many pitches out of the zone last year — only 23.3% — sitting in the 87th percentile of qualified hitters. Neither does his whiff rate of 12.2% (league average in 2018 was 10.7%) jibe with that huge strikeout rate. Taken together, we can conclude that while Moncada’s contact ability may be somewhat below-average, he limits how much he swings-and-misses by rarely chasing pitches out of the zone. So if Moncada doesn’t chase much, and doesn’t swing and miss that much, how is he striking out so much? Read the rest of this entry »


How Aaron Judge Can Turn the Corner

Yankees right fielder Aaron Judge is, to say the least, an imposing figure in the batter’s box. Judge is one of only three position players in baseball history with a height and weight of at least 6’7” and 255 pounds, respectively – the other two, for those curious, being 1960s power hitter Frank Howard and current Tigers minor league Steven Moya – and with his enormous size comes enormous strength. According to Statcast, 59.5% of Judge’s batted balls last season left the bat with an exit velocity of at least 95 miles per hour, a mark that trailed only those of the Brewers’ Domingo Santana and the Mariners’ Nelson Cruz. Further, Judge’s average exit velocity ranked second among the entire league, with only Cruz ahead of him. However, the player comparison that most swiftly comes to mind is the Marlins’ Giancarlo Stanton, who, incidentally, finished third in average exit velocity last season. When Judge truly barrels up the ball, as exemplified here, his raw power tends to elicit the type of awe usually reserved for Stanton.

Unfortunately for the Yankees, Judge was largely unable to capitalize on this strength in 2016. Although he only saw 95 plate appearances, he batted an uninspiring .179 with an astronomical 44.2% strikeout rate. Even his ISO, above average at .167, was still disappointing for a player claiming raw power as his most prominent attribute.

The Yankees, of course, were fully aware that their right fielder’s approach at the plate needed an adjustment. Said Yankees assistant hitting coach Marcus Thames during spring training:

“I thought [Judge] started expanding a little too much… At the big-league level, the game’s a little bit more physical, it’s a little bit faster and I thought it sped up on him a little bit and he started expanding.”

A cursory look at Judge’s 2016 batting statistics plate surprisingly suggests that plate discipline may not be as big a problem as one would expect based on Thames’ comments. Among 451 position players with at least ninety plate appearances in 2016, Judge’s O-Swing percentage was tied for 119th at 33.6% (27th percentile), and his Z-Swing percentage of 63.5% ranked nearly identically, at 112th (68th percentile).  Judge, surprisingly, rated fairly well in both measures: he chased far fewer balls than the average hitter, and he swung at a healthy percentage of strikes.

His contact rates, on the other hand, did not inspire quite the same sanguinity. Last season, Judge ranked dead last in overall contact percentage, as well as on pitches outside the strike zone. On pitches inside the strike zone, his contact percentage saw a slight improvement relative to his peers, but still ranked 42nd from the bottom. BaseballSavant’s pitch heatmaps suggest that Judge seemed to have the most difficulty with low and away pitches, both in and out of the strike zone. The following graph displays the locations of Judge’s swinging strikes from 2016 (not including foul balls):
2-Judge[A-SwingingStrikes]

As the preceding heatmap illustrates, the crux of Judge’s contact problems occurs in the low-and-away portions in and around the strike zone. However, a heatmap of Judge’s hardest-hit balls (exit velocity >= 100) shows that Judge’s best contact occurs on pitches that aren’t located anywhere near the low and away sections of the zone. In fact, the pitches Judge hits best are on the inside half of the plate:

2-Judge[B-100MPH]

Now, let’s see where Judge’s weaker contact (exit velocity <= 99) falls in the strike zone.

2-Judge[B-99MPH]

So, low and away pitches not only induce a league-leading whiff rate for Judge, but even when he does manage to connect, he connects with his weakest exit velocity. Marcus Thames’ comments, therefore, may require a slight adjustment: Judge didn’t necessarily expand the zone in 2016, but he certainly didn’t make the most efficient use of it. Courtesy of Brooks Baseball, the following graph illustrates Judge’s 2016 whiff rate by zone:

2-Judge[C-WhiffRateX]

From these charts, we can observe Judge’s whiff rate slowly rising from left to right (inside to outside) across the strike zone. To cut down on his high swinging-strike rate, which was the third-highest in the league among those 451 batters, Judge should reduce his swing rate on low and outside pitches – at least, until the count or game situation demands a more aggressive approach. Ahead in the count, however, Judge should look primarily for the middle-in pitches that have produced better and more frequent contact. He shouldn’t even consider swinging at anything on the outer sections of the plate, as he did last season while ahead in the count (heatmap from FanGraphs):

2-Judge[E-AheadInCount]-FanGraphs


As of Tax Day afternoon, the Yankees are only 11 games into the season, so it’s admittedly a bit early to draw any major conclusions. Even so, we should note that Judge has shown signs of legitimate improvement over last year’s campaign. In 33 at-bats, Judge is slashing .276/.364/.621, and although a 175 wRC+, .345 ISO, and 50% HR/FB rate are all but guaranteed to decline, there’s still reason to believe that Judge has made significant strides in his approach at the plate. Last year, Judge saw the 18th lowest percentage of fastballs in the league at 49.8%, a percentage that this season has dipped even further, to 45.5%. Pitchers, expecting Judge to flail as in 2016, have fed him a steady diet of low and away breaking balls. The following chart reflects all off-speed pitches Judge has faced to date in 2017:

2-Judge[D-17Offspeed]

Even with this steady diet of low and away breaking balls, Judge has managed to cut his O-Swing% from 34.9% to 23.9%, and his swinging-strike percentage has fallen from 18.1% to 12.0%. This is especially impressive considering that, like last year, pitchers have thrown him a fairly low percentage of strikes (about 41%).

The Yankees have lots of reason for optimism regarding their young slugger. As the starting right fielder in Yankee Stadium’s less-than-spacious right field, Judge’s value to his team will derive mostly from his batting output. If Judge can consistently lay off of the low and away pitches that gave him problems last year, he’ll have more opportunity to mash the balls that find the inner half of the plate – like this beauty from last Wednesday. If his early 2017 performance is any indication, Judge’s offseason adjustments have the potential to transform him into a Giancarlo Stanton-caliber power hitter.


Losing My Religion: Changing Approach and Changing Results

Every year, we hear about batters taking a new approach at the plate that they expect to generate better outcomes. But, as has often been shown, a lot of player tendencies are hard-wired. Players generally don’t change that much. What happens when they do?

In June, I looked at hitters who were pulling the ball a lot less or a lot more than they had in 2014. The conclusion was that it didn’t really make much of a difference, in aggregate, on offensive performance, although some players did markedly better and some did markedly worse. Now that the full season’s in the books, I decided to take another look at the comparison to see how a change at the plate affects hitting.

To look at this, I selected hitters with 350 or more plate appearances in both 2014 and 2015, corresponding roughly to at least half-time play. There were 173 such players. Using that sample set, I evaluated three observations you hear a lot about modern hitters:

  • They pull too much, allowing infielders to get extra outs by shifting. If they’d hit to the opposite field, they’d do better.
  • They try to hit everything into the seats, resulting in too many infield flies and lazy fly balls to the outfield instead of hitting sharp grounders that can become singles.
  • They’re too passive, getting behind the count by watching pitches.

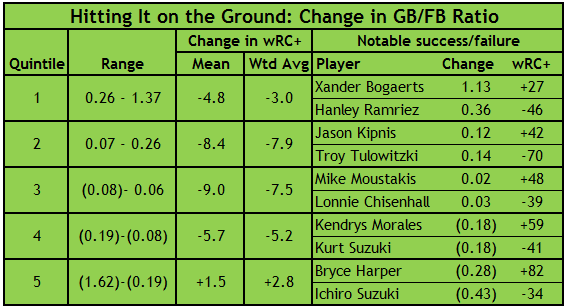
I looked for changes in pull tendency, ground vs. air batted balls, and aggressiveness at the plate, measured by net pull percentage (i.e., percentage of balls pulled minus percentage hit to the opposite field), ground ball/fly ball ratio, and swing percentage as proxies. To gauge the impact of the changes, I looked at change in wRC+, since it is a park- and season-normalized comprehensive measure of hitting.

It’s important, I think, to make a distinction between a change in outcomes to a change in approach. Take pulling the ball. If a batter pulls the ball less from one year to the next, it could be because he’s consciously trying to spray the ball over the field more in order to become less predictable and therefore harder to defend. Mike Moustakas comes to mind. But a batter may pull less because of the effects of age and/or injury, making his bat slower and unable to turn on inside fastballs. Since we can’t divine approach from full-season statistics, we’ll have to satisfy ourselves with outcomes. Among the 173 players in the sample, Victor Martinez had the largest decline in hitting the ball hard, and his wRC+ decline of 90 points was similarly the largest in the group. That doesn’t mean that he went into the season deciding to hit the ball softer, and that his strategy backfired. Rather, it was a reflection of Martinez’s health. A change in outcomes isn’t necessarily reflective of a change in approach.

I ranked the 173 players by their change in pull tendency, ground vs. air batted balls, and aggressiveness at the plate, and divided them into quintiles based on plate appearances. As an example, for pull tendency, the quintiles were players who went the opposite way a lot more (net pull percentage down 7.5% to 25.9%), those who went the opposite way somewhat more (net pull percentage down 3.6% to 7.4%), those who hit about the same (net pull percentage down 3.5% to up 0.1%), those who pulled somewhat more (net pull percentage up 0.2% to 5.0%),and those who pulled a lot more (net pull percentage up 5.0% to 17.8%). I also selected examples of players whose wRC+ was considerably better or worse in 2015 for each quintile. Generally, these were the players at the top or bottom of the rankings, though I did ignore obviously injured underperformers like Martinez and Jayson Werth.

In the tables I’m going to display, there are a lot of negative numbers for change in wRC+. The reason is that among the 173 players with 350 or more plate appearances in 2014 and 2015, the average wRC+ declined by 5.2 points (from 109.6 to 104.4), or 4.3 points (110.9 to 106.6) weighted by plate appearances. While that may be a topic for future research, it’s not a shock, given aging curves, regression, and the emergence of young talent in the majors.

Players who pulled a lot more or went the other way a lot more in 2015 than in 2014 did better than their peers. (Again, the average player’s wRC+ declined by 5.2 points, or 4.3 weighted by plate appearances). Those who went the opposite way a lot more improved relatively, and those who pulled a lot more improved both relatively and absolutely. If there’s a benefit to hitting to the opposite field for pull-happy sluggers who make too many outs by hitting the balls to shifted infielders, we’d see the change in wRC+ decline as the net pull percentage increases. That’s not what happened. Bryce Harper, Chris Davis, and Shin-Soo Choo, among others, benefited from pulling more, not less.

Players’ ground ball tendencies, similar to their pull tendencies, resulted in positive variance at both extremes. Players who hit the ball on the ground a lot more improved relative to their peers, and those who hit it in the air a lot more improved relatively and absolutely. Harper’s an outlier again—he pulled a lot more, hit the ball in the air a lot more, and produced a lot more runs. It’s amusing to see Red Sox teammates Xander Bogaerts and Hanley Ramirez as prime examples of what can go right or wrong if you hit a lot more ground balls.

 The outcomes for players who changed their pull tendency or proportion of balls hit on the ground were equivocal: Players did better at the extremes, but not in the middle. That wasn’t the case for aggression at the plate. In aggregate, batters who swung more did worse than batters who swung less. However, there’s a considerable outcomes vs. approach component here. The players in the bottom quintile—those who swung a lot less in 2015 than 2014—didn’t always have complete choice in the matter, as pitchers rationally chose to pitch more cautiously to hitters like Harper (percentage of pitches in the strike zone declined from 45.0% in 2014 to 41.5% in 2015) and Eric Hosmer (42.7% to 41.1%). But others in that lowest quintile, including Manny Machado, Curtis Granderson, and even A.J. Pierzynski, saw more pitches in the strike zone in 2015 than 2014, but chose to swing less, in and out of the zone, with improved results.

This project turned out to be murkier than I would’ve liked. Did batters who pulled a lot less, or those who it the ball on the ground a lot more, do better in 2015 than they did in 2014? Yes, but so did those who pulled a lot more and hit the ball in the air a lot more. And those are only aggregate figures; in every quintile, there are examples of batters who were a lot better or a lot worse. And we can’t completely tease out the change in approach from the change in a batter’s health or age or the way he’s pitched. About the only thing that seems to be safe to say is that swinging more is a dubious strategy. If a player goes into spring training talking about getting more aggressive at the plate and taking a lot more hacks, we might hope that his batting coach can talk him out of it.