Archive for New York Yankees

Talking The Tauch

You probably didn’t pay much attention (or even notice) when the New York Yankees acquired 28-year-old outfielder Mike Tauchman from the Colorado Rockies in exchange for pitching prospect Phillip Diehl towards the end of spring training on March 23rd. Who could blame you? Tauchman’s major league resume to that point was ugly: a .153/.265/.203 slash line in 69 plate appearances over 52 games for the Rockies.

From 2013 to 2016 in the Rockies’ farm system, Tauchman hadn’t shown much in his age-22 to age-25 seasons. He displayed a decent hit tool but didn’t flash much power, combining for only eight home runs across four minor league seasons. If Tauchman wanted to crack Colorado’s major league roster, he needed to make a change.

Prior to the 2017 campaign, as reported by the New York Times’ James Wagner, Tauchman worked with Justin Stone, a hitting instructor at Chicago-based Elite Baseball Training. With three-dimensional sensors and plates that measure force, Stone, who was hired as a hitting consultant by the Chicago Cubs in 2018, used biomechanics to help Tauchman improve his swing. Stone and Tauchman found that he was transferring energy inefficiently from his lower half to his upper half. In scientific terms, Tauchman’s kinetic chain, or the sequence of movements that make up his swing, was off. With Stone’s help, Tauchman learned to use his lower half better when starting his swing, enhancing the transfer of energy up the kinetic chain.

The results were undeniable. Still in Triple-A, Tauchman improved his wOBA from .322 in 2016 to .399 in 2017 and .420 in 2018. His 139 wRC+ was good for the eighth-best mark in Triple-A in 2017. In 2018, his 153 wRC+ was fourth-best, just behind fellow 2019 breakouts Daniel Vogelbach and J.D. Davis as well as Astros top prospect Kyle Tucker. Tauchman’s power had definitely increased: he tripled his career home run mark with 16 homers in 2017 and swatted another 20 in 2018. The Yankees front office took notice and was intrigued enough by Tauchman’s minor league success to add him as a depth piece just before the 2019 season. Read the rest of this entry »


Why the Yankees Passed on Dallas Keuchel

The Evil Empire is no more.

Throughout history, the Yankees have been portrayed as Major League Baseball’s chief oppressor, needlessly feasting on the weaker, less financially able organizations. For the most part, they’ve fit the bill, never shying away from adding megastars like Jason Giambi, Alex Rodriguez, and CC Sabathia, and thus annually accumulating a payroll much richer than the rest of the league.

Factor in a staggering 27 World Series Championships and it’s not hard to see why opposing teams are a tad resentful. But times have changed.

The 2019 Yankees are built on young talent and depth. Gary Sanchez ($669,800), Gleyber Torres ($605,200), Luke Voit ($573,200), and Clint Frazier ($563,300) are the only Yankees with double-digit home runs and have been major contributors in stabilizing their first-place lineup with franchise-cornerstone Aaron Judge ($684,300) on the IL.

Not only that, but the Yankees have often recently been outbid while vying for the services of marquee free agents.

Most notably, Manny Machado and Bryce Harper, two of the youngest, most talented free agents on the market in history, were both rumored to be interested in joining the Yankees this winter. Machado was dined, but never officially offered a contract. The Yankees chose DJ LeMahieu instead. Harper was supposedly never even given a phone call. Brian Cashman and company felt better bringing back aging Brett Gardner to man left instead.

Manny Machado and Bryce Harper, making approximately $55 million total this season, have a combined 1.8 WAR.

DJ LeMahieu alone, making $12 million in 2019, has 2.4 WAR.

Most recently, the Atlanta Braves outbid the Yankees for the services of former Cy Young Award winner Dallas Keuchel, with the latter viewed at one point as the favorites to land the star.

Most fans were upset. They shouldn’t be. Read the rest of this entry »


James Paxton Is Not the “Next Sonny Gray”

The Yankees kicked off their offseason by acquiring LHP James Paxton from the Seattle Mariners to bolster their starting rotation. You won’t find anybody willing to deny Paxton’s immense talent, but it’s natural for people to scrutinize big acquisitions, especially when the big acquisition is on his way to New York. This scrutiny is best exemplified by a conversation I had with my mother on the day the trade was made. My mom followed the Mets of the mid-to-late 1980s when she lived in Brooklyn, went years without watching baseball, and has watched the Yankees for the past decade by product of my fandom. This leads to the amusing circumstance that she is very familiar with current broadcasters Keith Hernandez and David Cone, all of the recent Yankees players, and almost nobody in between. Our conversation on the day of the Paxton trade went something like this:

Me: The Yankees picked up a hell of a pitcher named James Paxton. I think he’s going to do big things for the Yankees next year!

Mom: Yeah, sure. Isn’t that what you said about Sonny Gray?

Okay — she got me there.

Read the rest of this entry »


What’s Wrong with Gary Sanchez?

To the shock of many around baseball, “The Kraken” has been tamed so far in 2018. Before hitting the shelf with a groin injury in late June, Gary Sanchez had been in the midst of an extended scuffle at the plate. While often at the forefront of critique for his lackluster defensive showing down the stretch in 2017, Sanchez’s offensive struggles have dumbfounded many in the baseball industry. After a historically dominant multiple-month power surge in his 2016 rookie season, Sanchez backed it up with an outstanding 2017 season, to the tune of a .278/.345/.531 line, and he clobbered 33 HR, despite only playing in 122 games due to injury. Sanchez also carried an elite .253 ISO and 130 wRC+ last season, which makes his struggles in this campaign all the more shocking. 2018 has been a disaster of a season so far for Sánchez; he’s slashing .190/.291/.433, accompanied by a decline in his HR/FB% from his stellar career average of 26.1% to 18.4%. Boasting a disappointing 97 wRC+ and .313 WOBA before the injury, Gary Sanchez has largely spent his season searching for answers.

When addressing a player’s stat-line it’s imperative to look at the big picture: Sánchez’s K% is slightly higher in 2018 (23.8%) than 2017 (22.9%), as one might expect from a large decrease in batting average, but this 3.93 % increase in K% doesn’t explain anything as astronomical as an 88-point Batting Average drop-off. Sanchez’s BABIP (Batting Average on Balls in Play) is unsustainably low, currently sitting at .194, despite has career average of .278. While BABIP is dependent on many variables, such as Exit Velocity, Launch Angle Composition, Hang Time, Type of Hit, Defensive Shifts, etc, much of the short-run variance of the metric can be attributed to chance. While Sanchez’s outputs for many of main variables have veered off par from the past in 2018, none of these changes should account for anything close to a 30.2% lower BABIP than what his career average is. Further evidencing the misfortune that has slandered Sanchez’s numbers is that the backstop is carrying an xwOBA of .368, still well above the MLB average of .317 in this category. Some of the Gary Sanchez extended slump can definitely be attributed to horrific luck. His Average Exit Velocity has undergone an insignificant 0.55% decrease— nothing to be too concerned with. However, I was alarmed by seeing that his Average Launch Angle is up from 13.2 degrees in ‘17 to 15.3 degrees this season, given his previously historic HR/FB rates, so I delved its composition.

The problem isn’t so much that Gary has seen his average Launch Angle rise, it’s that his launch angle has been all over the place in 2018: it deviates in all different directions from what it’s been the past two seasons. His ideal xwOBA seems to be somewhere in the range between 20 degrees and 35 degrees, but Gary has been hitting at launch angles that have produced poor xwOBAs (both lower and higher than his ideal launch angle range). Gary’s 2017 Launch Angle %/xwOBA reveals that he was hovering around this range with a large percentage of his swings (the 8 most frequent ranges of 5 Degrees for Sanchez’s swings also happened to be his 8 best xwOBAs and they connect to form the territory of the launch angles from 0 degrees through 40 degrees. Gary’s been below Launch Angles of 0 Degrees and above 40 degrees much more frequently this year, with his 45 degree mark (Sanchez hasn’t homered in his career on any swing with a Launch Angle in this range) being his most frequent range (8.1%), up from the 3.2% last season and 5.7% the previous year. The portion of Gary’s struggles in his control shouldn’t be attributed to his higher average Launch Angle, they should be directed to his increase in frequency of connecting outside his optimal range, which is the real difference between his stellar offensive track record and current output.

I was curious how Sanchez’s HR/FB% could be so much lower this season than from the rest of his career, so this Launch Angle dilemma immediately caught my attention. Accompanied by his altered Launch Angle composition has been an increase in FB% (from 36.6% in ‘17 to 45.0% this season) and a decrease in LD% (from 21.1% in ‘17 to 14.2%). Gary’s IFFB% is also way up from 10.8% last season to 21.1% so far in this campaign. Whether it was a conscious decision or not, there isn’t explanation for why this has happened to one of the games premier HR hitters, but it’s resulted in a significant drop off in Sanchez’s HR/FB%, and limited his production across the board.

Another factor in Sanchez’s extended ’18 slump may be his aggressiveness at the plate. While his BB% has jumped from 7.6% to 11.7% since last season, he hasn’t brought the same aggressive mindset into his at-bats, in general. Sanchez has been more tentative with ambushing pitches in 2018, as his 1st Pitch Swing Rate is down from 29.2% to 24.9%, and his overall swing rate (both O-Zone Swing% and Zone Swing% have been lower than last season) is down from 47.9% to 43.8%. For a player of his abilities, Gary Sanchez has some ugly offensive numbers to begin 2018, due to a combination of poor luck, an ill-fated change in his Launch Angle composition, and increased selectivity at the plate.


What Would it Have Taken for Aaron Judge to be Clutch?

During one of my recent visits to the Fangraphs home page, while scrolling across the leaberboards, I was confronted by a fact I had once known but had long ago forgotten over this slow and tired off-season. Aaron Judge led the league in WAR! as a rookie?! and by quite a wide margin. That happened last season? Shoot just over a year ago Judge was still relatively unknown and Jeff Sullivan was telling us not to underestimate his power.

This realization conjured up memories of last season’s AL MVP vote, how one of Sabermetrics’ patron saints shook the foundations of Sabermetrics’ most prominent statistical achievement, and how article after article were written about clutch hitting.

This, in turn, reminded me of another leaderboard Judge topped last season, this one more dubious. He led (lagged?) the league with the lowest Clutch score. He was fourth in WPA/LI with 5.85 Wins, trailing only this generation’s Mickey Mantle, Judge’s clone, and some guy who plays for the Reds and just a fractional win behind the leader. In contrast, he ranked just 38th in WPA tied with some guy who used to play in Korea. Add this up and he had by far the lowest Clutch score at -3.64 wins, a full win lower than the rest of MLB save for one blue-eyed Cub.

Which led me to ask the question: What would Aaron Judge have had to do to be a clutch batter? And I don’t mean the obvious answer, “Hit better in high leverage situations“. Duh! He batted an astounding 190 wRC+ in low leverage situations to just a 107 in high leverage at bats. But that’s not the answer I was looking for. I wanted to know specifically, what would Aaron Judge have had to do to be a clutch batter? as in what could we change from his epic near MVP season to bring his Clutch stat into the positive?

So I set to find out.

Using Fangraph’s own Play Log, and with plenty of assistance from BaseballSavant.com and Statcast, I decided to play as one of the “Baseball Gods” and see if I could tweak a few of Judge’s plays to make him more clutch. As a “Fair and Just Baseball God” I wouldn’t be aiming to increase Judge’s overall stat line. If I nudge a groundball a little to turn an out into a single in a high leverage situation, I’d do the opposite in a low leverage situation (Judge had nearly 50 PA’s with a Leverage Index, LI, of effectively 0) nudging another grounder into a fielder’s glove for an out.

Thus his overall stat line and his WPA/LI would remain effectively the same, and since in those low leverage situations no (or nearly no) WPA was added, we’ll only be looking at how the play’s I change increase Judge’s WPA.(And I’ll only be going through the plays I add not the ones I’d need to take away.) I also won’t worry about any of the time traveler unintended consequences stuff, I’ll assume that only the single event changes without it affecting other plays in the same game or others. (I’ll let some of the other “Baseball Gods” worry about that stuff…)

Recall the Equation for Clutch:

Clutch = (WPA)/(pLI) – (WPA/LI)

With my rule that Judge’s pLI (0.95) and WPA/LI (5.85) will remain fixed we are just looking to increase Judge’s WPA.

With that lengthy explanation out of the way, let’s begin!:

Judge Initial WPA = 2.10
_________________________________________________________
Situation #1:

July 27th, Bottom 9, 1 Out, Runner on Third, Yankees down 1.
LI = 5.81 – Actual Play – Judge Fly’s Out to Right. – WPA = -.252

We’ll start with a big one, in fact Judge’s second highest leverage play of his season!
With a chance to tie the game in the 9th, Judge just miss-hits the ball sending it not quite far enough to allow the speedy Brett Gardner to score from third. As you can see, similar hit balls all had the same result:

”7/27/2017”
But as my first act as “Baseball God” I’m gonna adjust this hit ever so slightly, notching Judge’s bat up a millimeter to two to lower the Launch Angle of this hit and allow it to carry just a bit further. Something more like this:

”7/27/2017_Alt”
That should be far enough out to score Gardner giving Judge a Sac Fly.

New Play – Sac Fly – New WPA = .112 – Net WPA Change = .364

Judge’s New WPA = 2.46
_________________________________________________________
Situation #2:

August 2nd, Bottom 8, No Outs, Runner on Second, Yankees down 2.
LI = 2.72 – Actual Play – Strike out swinging. – WPA = -.08

Sometimes the job of a “Baseball God” is rather easy. In this case I’ll just need to do some umpire convincing. In this at bat Judge struck out on a 3-2 slider, but earlier in the at bat, after three wild pitches, here was the 3-0 offering from Bruce Rondon:

”8/2/2017”

Ok, sure, most umpires probably call this a strike on a 3-0 count, but I’m gonna go ahead and give this one to Judge. Ball Four!

New Play – Walk – New WPA = .087 – Net WPA Change = .167

Judge’s New WPA = 2.63
_________________________________________________________
Situation #3:

September 19th, Bottom 2, 2 Outs, Runners on Second and Third, Tie Game.
LI = 2.03 – Actual Play – Fly out to Center. – WPA = -.061

Judge crushed a Jose Berrios offering at 107 MPH:

Here’s what it looked like.

He was just a little under this one, wouldn’t take much more to send this ball out. So we’ll make the charge and turn this loud out into a bomb.

New Play – Three Run Home Run – New WPA = .249 – Net WPA Change = .310

Judge’s New WPA = 2.94
_________________________________________________________
Situation #4:

September 9th, Top 9, No Outs, Runner on First, Tie Game.
LI = 3.40 – Actual Play – Fielder’s Choice to third, out at second. – WPA = -.084

Judge grounds one to third, and nearly into a double play.
Here’s what it looked like.

Thing is, Rougned “De La Hoya” Odor is in such a hurry to turn two that it almost looks like he jumps off Second too early. Take a closer look:

”8/2/2017”

Your guess is as good as mine, but here’s the thing: As a “Baseball God“, I don’t have to guess. I’ll just make the throw from third just a little higher and wider pulling Odor off the bag and leaving both runners safe on a throwing error. Did you know that errors count as positive WPA plays?!

New Play – Reach on Error, Throwing Error at Third, Runners safe at First and Second – New WPA = .109 – Net WPA Change = .193

Judge’s New WPA = 3.13
_________________________________________________________
Situation #5:

August 18th, Top 6, 2 Outs, Bases Loaded, Yankees down 1.
LI = 4.52 – Actual Play – Ground Out to Shortstop. – WPA = -.119

Judge hits a sharp ground ball at 103 MPH.

Here’s what it looked like.

Hit hard, but right into Xander Bogaerts‘ glove for a routine out. But per Statcast balls hit at that Velocity and at that Launch Angle become hits about half the time.

One can imagine Judge hitting this ball just a little closer to the pitcher’s mound, and seeing it get past a diving Bogaerts. With the runners going, that hit would easily score 2.

New Play – Ground Ball Single up the Middle Scoring 2, – New WPA = .275 – Net WPA Change = .394

Judge’s New WPA = 3.53
_________________________________________________________
Situation #6:

June 14th, Top 7, No Outs, Runners on First and Second, Tie game
LI = 2.89 – Actual Play – Fly Out to Left. – WPA = -.085

Judge ropes one into left field, where Eric Young Jr. makes an awkward dive for it.

Here’s what it looked like.

Young makes the out, but just barely. Imagine if his dive is just a little more awkward… That ball probably gets by him and clears the bases.

New Play – Bases Clearing Double to Left Field – New WPA = .219 – Net WPA Change = .304

Judge’s New WPA = 3.83
_________________________________________________________
Situation #7:

June 15th, Top 9, No Outs, Bases Empty, Yankees down 1.
LI = 2.88 – Actual Play – Strike Out Looking. – WPA = -.073

Were picking up steam now! And as a “Baseball God” I haven’t had to work very hard changing these last few plays. Now it’s time to work just a little harder.

Leading off a do or die ninth, Judge took three easy balls, then saw and fouled consecutive fast balls. This set up a full count pitch where Santiago Casilla froze him with a beautiful knuckle curve. Here’s what it looked like.

”6/15/2017”
No doubt that’s a beautiful pitch. But guess what? Umpires sometimes miss calls, especially when they get some inadvertant dust in their eye…

New Play – Walk – New WPA = .110 – Net WPA Change = .183

Judge’s New WPA = 4.02
_________________________________________________________
Situation #8:

September 10th, Top 3, 1 Out, Bases Loaded
LI = 2.26 – Actual Play – Sac Fly to Right. – WPA = -.002

In an RBI situation, Judge blasts one.

Here’s what it looked like.

So Judge clearly gets under this pitch… but he still hit it over 300′ and scores a run.
The thing is the next two times up he did this and this!
I’m just gonna do a little rearranging on when these homers take place…

New Play – Grand Slam to Right – New WPA = .256 – Net WPA Change = .258

Judge’s New WPA = 4.27
_________________________________________________________
Situation #9:

April 18th, Bottom 9, 2 Outs, Bases Loaded, Yankees Down 3
LI = 3.86 – Actual Play – Fielder’s Choice to Shortstop, Out at Second. – WPA = -.100

Judge ends the game on a weakly hit grounder to shortstop.

Here’s what it looked like.

Looks like a routine grounder, but per Statcast similar balls become hits about a third of the time. And we don’t really need a hit here, Tim Anderson looks a little shaky fielding the grounder as it hops to his glove. In a critical situation like this who’s to say he doesn’t boot one? The answer is me, the “Baseball God“. I say he boots it…

New Play – Fielding Error at Shortstop, 1 Run Scores – New WPA = .090 – Net WPA Change = .190

Judge’s New WPA = 4.46
_________________________________________________________
Situation #10:

July 21st, Top 3, 1 Out, Runners on First and Third, Tie Game
LI = 2.12 – Actual Play – Sac Fly to Center. – WPA = +.016

Another well struck ball that just stays in the yard for a sac fly.

Here’s what it looked like.

But Judge would get one more try at Andrew Moore that game, and you may remember it. Judge’s next at bat was that time he broke Statcast!

I’m just gonna move that Statcast breaking smash up one AB if you don’t mind…

New Play – Three Run Home Run – New WPA = .216 – Net WPA Change = .200

Judge’s New WPA = 4.66
_________________________________________________________
Ok, awesome we’re 10 plays in, and as a “Baseball God” I don’t feel like I’ve had to work all that hard. But were still only at 4.66 WPA, nearly a win short of our target. It’s time to pull out the big guns. It’s time to perform a MIRACLE!

Situation #11:

July 30th, Bottom 9, 1 Out, Runners on First and Second, Yankees down 2.
LI = 4.78 – Actual Play – Foul out to First. – WPA = -.112

Representing the go ahead run, Judge pops up in foul ground to the first baseman. You can see his hit in blue in the image below.

”7/30/2017”
(As to why this shows up as a -57° LA I think sometimes Miracle Work messes with Statcast…)

Just a lazy pop-up. Not much a “Baseball God” can do to affect this play without revealing myself to the world. So I’ll just void the play and blows this ball a little further to the right and into the seats where Trevor Plouffe can’t catch it!

So I’ve just given Judge a new lease on this particular at-bat. I hope he uses it wisely. I’ll just assume it goes something like this!

New Play – Walk Off Three-Run Home Run – New WPA = .793 – Net WPA Change = .905

What?! You don’t think that’s fair. Tough! I am Beerpope the Baseball God and this is my Miracle, don’t tell me what’s fair!

Judge’s New WPA = 5.57

And with that spectacular finish, we check Judge’s Clutch score:

5.57 / 0.95 – 5.85 = +.01 Wins

And there you have it. Aaron Judge – CLUTCH BATTER. My work here is done.

So what does this all mean? Really I’m not sure. Does the fact that it took 10 twists of fate and one walk-off miracle just to bring Judge barely into the positive show just how deeply un-clutch he was last season? Maybe. But it may also show us how futile it is to focus of how clutch or un-clutch a batter is if an ump call, miss hit, or bounce here or there in just 10 at bats can invalidate the other 600 plus plate appearances in a player’s season.

I’ll leave that determination to the readers.

Now enough with the 2017 Season. It’s time for me to begin contemplating what Miracles to perform thus upcoming season…

Cheers!


The Bad Aaron Judge Comps

Aaron Judge is good.  Some might say he is great.  The front-runner for AL Rookie of the Year and MVP is the face of MLB for 2017, but the face of MLB for the future?  Unfortunately, maybe not.

It’s hard to find something negative to say about the New York Yankees right fielder, but in order to play devil’s advocate and not get our hopes up too high about Aaron Judge, just in the event that he has a down season, I was able to find some rather unflattering comps for the slugger.

First, there’s his minor-league career.  Aaron Judge was a pretty good prospect ranking first in the Yankees’ system in 2015 and 17th in baseball according to MLB Pipeline.  However, just because a prospect is ranked highly does not mean they are without flaws.  Judge would strike out in at least 21 percent of his plate appearances in all levels in the minor leagues.  This article from 2016 even identified Judge’s proficiency to strikeout:  

Judge’s Triple-A debut at the end of 2015 did not go well. He slashed .224/.308/.373, well below both his career levels and expectations. More alarming, he struck out a career high 28.5-percent of the time (74 times in 260 plate appearances). [The 2016 season] has been more of the same. His batting average is a bit deceiving sitting at .284 (heading into this weekend), considering he currently has a nice .354 BABIP compared to last seasons .289. His plate discipline is troubling.

Perhaps the lofty expectations of Judge have him pressing. You simply can’t overlook the fact that his strikeout rate is nearly identical to the small sample size of last season’s Triple-A numbers (27.2-percent). It has to be at least a slight bit worrisome that this is a trend and not a slump. His walk right is dropping daily to a new career low (6.8-percent or eight walks in 103 plate appearances).

The article seems to point to his plate discipline as his main flaw — as other evaluators have — but is overall positive with his prospect status.  But his strikeout tendency should not be overlooked.  He has failed to improve on that statistic in his short major-league career, where he has struck out in 32 percent of his plate appearances between his call-up in 2016 and now.  However, because he also takes his walks, his walk percentage is rather high, which puts him in exclusive company.

Since 2000, there have only been four players with at least 300 plate appearances who have struck out in over 29 percent of their plate appearances and walked in at least 16 percent of them: Jack Cust (2007, 2008, 2010, 2011), Ryan Howard (2007), Adam Dunn (2012), and Aaron Judge (2017).  All of these seasons resulted in wRC+ well above 100, which means that they were productive players; however, these player were known to be the embodiment of the “three-true-outcome” hitters.  Dunn had five consecutive seasons of 40 or more home runs, but also led the league in strikeouts four times; Cust led the league in walks once and strikeouts three times; and Howard led the league in home runs twice and strikeouts twice.  Admittedly, these comps are not encouraging.  Although these players were not horrible in the simplest definition, their careers were short-lived and their production sharply declined.  For Cust and Dunn, it forced an early retirement, and Howard a well-publicized and sad end to an illustrious career.

But it’s not just Aaron Judge’s strikeout and walk percentage — it’s also his raw strikeout numbers.  Judge is on pace to strike out over 200 times this season.  While it’s already been established that he is strikeout-prone, it does not serve him justice that the 200-strikeout threshold is upon him.  No player who has struck out 200 or more times in a season has had a very high average.  As the legendary Pete Rose noted, the highest single-season average for a player with 200 or more strikeouts was .262 (Chris Davis holds that honor).  The short list of 200 single-season strikeout players is a whopping five players long: Mark Reynolds, Adam Dunn, Chris Davis, Chris Carter, and Drew Stubbs.  Kris Bryant had 199 in his rookie season (he was called up late to the bigs due to service-time considerations, so it’s likely that he would have joined this club), and Ryan Howard had 199 twice and Jack Cust had 197 once.  Dunn, Howard, and Cust again…

I love Aaron Judge, and I love 500-plus foot home runs, but we also have to be realistic and rational in our love and praise for the slugger.  The worst thing that the New York sports world can do is rattle this kid if, and when, he goes from being an All-Star to the 25th man on a roster.  There is nothing I want to see more, as a Yankees fan and a baseball fan, than Judge succeed; it’s good for the sport.  But I also don’t want to get my hopes up too high, because nothing stings more than a player of his caliber going down the path of Adam Dunn, Jack Cust, or Ryan Howard.


How Aaron Judge Can Turn the Corner

Yankees right fielder Aaron Judge is, to say the least, an imposing figure in the batter’s box. Judge is one of only three position players in baseball history with a height and weight of at least 6’7” and 255 pounds, respectively – the other two, for those curious, being 1960s power hitter Frank Howard and current Tigers minor league Steven Moya – and with his enormous size comes enormous strength. According to Statcast, 59.5% of Judge’s batted balls last season left the bat with an exit velocity of at least 95 miles per hour, a mark that trailed only those of the Brewers’ Domingo Santana and the Mariners’ Nelson Cruz. Further, Judge’s average exit velocity ranked second among the entire league, with only Cruz ahead of him. However, the player comparison that most swiftly comes to mind is the Marlins’ Giancarlo Stanton, who, incidentally, finished third in average exit velocity last season. When Judge truly barrels up the ball, as exemplified here, his raw power tends to elicit the type of awe usually reserved for Stanton.

Unfortunately for the Yankees, Judge was largely unable to capitalize on this strength in 2016. Although he only saw 95 plate appearances, he batted an uninspiring .179 with an astronomical 44.2% strikeout rate. Even his ISO, above average at .167, was still disappointing for a player claiming raw power as his most prominent attribute.

The Yankees, of course, were fully aware that their right fielder’s approach at the plate needed an adjustment. Said Yankees assistant hitting coach Marcus Thames during spring training:

“I thought [Judge] started expanding a little too much… At the big-league level, the game’s a little bit more physical, it’s a little bit faster and I thought it sped up on him a little bit and he started expanding.”

A cursory look at Judge’s 2016 batting statistics plate surprisingly suggests that plate discipline may not be as big a problem as one would expect based on Thames’ comments. Among 451 position players with at least ninety plate appearances in 2016, Judge’s O-Swing percentage was tied for 119th at 33.6% (27th percentile), and his Z-Swing percentage of 63.5% ranked nearly identically, at 112th (68th percentile).  Judge, surprisingly, rated fairly well in both measures: he chased far fewer balls than the average hitter, and he swung at a healthy percentage of strikes.

His contact rates, on the other hand, did not inspire quite the same sanguinity. Last season, Judge ranked dead last in overall contact percentage, as well as on pitches outside the strike zone. On pitches inside the strike zone, his contact percentage saw a slight improvement relative to his peers, but still ranked 42nd from the bottom. BaseballSavant’s pitch heatmaps suggest that Judge seemed to have the most difficulty with low and away pitches, both in and out of the strike zone. The following graph displays the locations of Judge’s swinging strikes from 2016 (not including foul balls):
2-Judge[A-SwingingStrikes]

As the preceding heatmap illustrates, the crux of Judge’s contact problems occurs in the low-and-away portions in and around the strike zone. However, a heatmap of Judge’s hardest-hit balls (exit velocity >= 100) shows that Judge’s best contact occurs on pitches that aren’t located anywhere near the low and away sections of the zone. In fact, the pitches Judge hits best are on the inside half of the plate:

2-Judge[B-100MPH]

Now, let’s see where Judge’s weaker contact (exit velocity <= 99) falls in the strike zone.

2-Judge[B-99MPH]

So, low and away pitches not only induce a league-leading whiff rate for Judge, but even when he does manage to connect, he connects with his weakest exit velocity. Marcus Thames’ comments, therefore, may require a slight adjustment: Judge didn’t necessarily expand the zone in 2016, but he certainly didn’t make the most efficient use of it. Courtesy of Brooks Baseball, the following graph illustrates Judge’s 2016 whiff rate by zone:

2-Judge[C-WhiffRateX]

From these charts, we can observe Judge’s whiff rate slowly rising from left to right (inside to outside) across the strike zone. To cut down on his high swinging-strike rate, which was the third-highest in the league among those 451 batters, Judge should reduce his swing rate on low and outside pitches – at least, until the count or game situation demands a more aggressive approach. Ahead in the count, however, Judge should look primarily for the middle-in pitches that have produced better and more frequent contact. He shouldn’t even consider swinging at anything on the outer sections of the plate, as he did last season while ahead in the count (heatmap from FanGraphs):

2-Judge[E-AheadInCount]-FanGraphs


As of Tax Day afternoon, the Yankees are only 11 games into the season, so it’s admittedly a bit early to draw any major conclusions. Even so, we should note that Judge has shown signs of legitimate improvement over last year’s campaign. In 33 at-bats, Judge is slashing .276/.364/.621, and although a 175 wRC+, .345 ISO, and 50% HR/FB rate are all but guaranteed to decline, there’s still reason to believe that Judge has made significant strides in his approach at the plate. Last year, Judge saw the 18th lowest percentage of fastballs in the league at 49.8%, a percentage that this season has dipped even further, to 45.5%. Pitchers, expecting Judge to flail as in 2016, have fed him a steady diet of low and away breaking balls. The following chart reflects all off-speed pitches Judge has faced to date in 2017:

2-Judge[D-17Offspeed]

Even with this steady diet of low and away breaking balls, Judge has managed to cut his O-Swing% from 34.9% to 23.9%, and his swinging-strike percentage has fallen from 18.1% to 12.0%. This is especially impressive considering that, like last year, pitchers have thrown him a fairly low percentage of strikes (about 41%).

The Yankees have lots of reason for optimism regarding their young slugger. As the starting right fielder in Yankee Stadium’s less-than-spacious right field, Judge’s value to his team will derive mostly from his batting output. If Judge can consistently lay off of the low and away pitches that gave him problems last year, he’ll have more opportunity to mash the balls that find the inner half of the plate – like this beauty from last Wednesday. If his early 2017 performance is any indication, Judge’s offseason adjustments have the potential to transform him into a Giancarlo Stanton-caliber power hitter.


Gary Sanchez Should Bat Second

What do Mike Trout, Josh Donaldson, Dustin Pedroia, Corey Seager and Manny Machado all have in common? Besides the numerous accolades that they share between the Rookies of the Year, the Silver Sluggers, the MVP awards and the combined 16 All-Star appearances, they all share one less obvious trait: they have more career plate appearances batting second in the lineup than anywhere else. Gone are the days of your team’s best player batting third or fourth. The new normal is now MVP-caliber players batting second. It has worked for Pedroia and the Boston Red Sox, Machado and the Baltimore Orioles, Donaldson and the Toronto Blue Jays and Seager and the Los Angeles Dodgers. Not for nothing, but those teams all made the postseason last year with large contributions from their second-hole hitters AND Trout was the AL MVP for the second time in his career on a last-place Los Angeles Angels team. And as more teams continue to adopt this trend, the New York Yankees should also look to bump up their best hitter.

In an appearance the other week on a YES Network interview, GM Brian Cashman has stated that the Yankees have kicked the tires on splitting Brett Gardner and Jacoby Ellsbury in the lineup. This makes a lot of sense when looking at their game; they both rely on their ability to get on base and set the table more so than their ability to drive in runs. Additionally, both players have slowly, but noticeably, been in decline in recent seasons, primarily due to age and injury. Gardner has been the subject of trade rumors over the past few seasons and Ellsbury has been the ire of the New York media for largely failing to live up to the seven-year, $153-million deal he signed before the 2014 season. River Ave Blues has already had a look at how the Yankees would approach this situation and they have provided a solid solution, but they almost immediately toss out the idea of Gary Sanchez batting there for one reason or another, while Sanchez is most deserving of the promotion.

Sanchez has established himself as the Yankees’ most dominant hitter after bursting on the scene last year. The Yankees, their fans, and the nation all expect Sanchez to hit in the third spot in the lineup, a prestigious position considering the history of the franchise, but moving the young slugger to second would not only better suit the team, but would also play to his strengths. Sanchez, despite the short sample size of 231 plate appearances, has proved to be a pretty good fastball hitter. Of the 294 fastballs he has seen, he has connected for a .328 AVG and .781 SLG, and nine of his 20 home runs. Why does this matter? Traditionally, number-two hitters have seen more fastballs than elsewhere in the lineup, and to further cement his commitment to the fastball, per Brooks Baseball, Sanchez had an exit velocity of 94.3 MPH against the heater (Sanchez ranked in the top 10 in overall exit velocity last year). Young players are also traditionally late to adapt to major-league breaking pitches. Can you blame them when they’re up against this or this?

Secondly, it has been proven that two-hole hitters collect more plate appearances per season than the three through nine spots. This is not new information, but the exact number of plate appearances has been up for debate for years. Beyond the Box Score might’ve ended the debate while also examining how the two hole has changed, stating that “[e]ach drop in the batting order position decreases plate appearances by around 15-20 a year,” which might explain why MVPs Trout and Donaldson have made a living there over the past few seasons. An extra 10-20 plate appearances could mean an extra home run or two over the course of the season. Baseball is a game of inches, but it’s also a game of runs.

With a lineup bereft of veteran power and more intent on utilizing the “Baby Bombers,” as they’ve been so aptly named, moving Sanchez up to second could and should give the lineup a much-needed boost if the reliance on Greg Bird and Aaron Judge should go somehow awry. Veterans Matt Holliday, Chase Headley and Starlin Castro have had good seasons and impressive resumes, but they need to return to All-Star form to carry a team of youngsters and a questionable starting rotation. No one really expects Sanchez to produce at the same rate that he did last year, but perhaps a bump up would allow him to produce at an above-average level again.


The Myth of the Indestructible Catcher Tandem

In the world of sports, the catcher position is kind of weird. Catchers start each play out of bounds, facing a different direction than their teammates. On a more micro level, baseball’s most important in-bounds/out-of-bounds determination, the strike zone, isn’t static as it is other sports; it’s determined on every pitch, and the catcher has a role in making that determination. In a non-contact sport, they’re covered in protective armor. Those of us with lousy knees are in awe just of their ability to do all that squatting.

Catcher is also the only position on modern rosters where there is planned redundancy. Thirteen-man pitching staffs have more or less eliminated platoon tandems, but catching tandems persist. The Pirates don’t carry an extra center fielder to give Andrew McCutchen a rest in the second game of doubleheaders. The Nationals don’t have a second right fielder to play instead of Bryce Harper on day games after night games. The Yankees don’t roster a spare third baseman in case Chase Headley gets hurt or tossed from a game. But every team has to have two catchers, and each of them sees a decent amount of playing time. (The catchers for those three teams in particular, as we’ll see.)

Further, the impact of a catcher injury can be significant. A disabled catcher’s replacement could well be unfamiliar with his pitching staff and opposing hitters’ tendencies, impairing his ability to call a game. He may not know the league’s umpires and their interpretation of the strike zone. He might not be up to speed on his infielders’ shifting tendencies and how that may affect pitch selection and location. And his presence probably means extra work, and extra fatigue, for the team’s other catcher. Just ask a Boston Red Sox fan about the importance of healthy catchers. (That’s a rhetorical suggestion. I don’t recommend actually doing that, unless you want to hear a long exposition about the importance of good free agent signings, a reliable starting rotation, offensive production from your first basemen, keeping your closer and second baseman off the DL…really, it can go on for a while.)

This summer, while attending a Phillies-Pirates game during which the Pirates used both of their catchers, my friend wondered whether the Pirates had the skinniest catchers in the league. (Francisco Cervelli is listed at 6’1″, 205, Chris Stewart 6’4″, 210). While actually putting in the time to figure this out (the answer appears to be “yes,” if you can trust listed heights and weights), I noticed that Cervelli and Stewart had caught all but 17.1 innings for the Pirates in 2015. This was in August, but it remained the case for the entire year. Cervelli caught 1099.2 innings and Stewart 372.2. Combined, that represented 98.8% of all the Pirates’ defensive innings last year. This struck me as notable, as the Pirates had lost the durable Russell Martin to free agency over the winter, replacing him with Cervelli, who’d never played more than 93 major league games in a season previously. The Pirates are famous for their use of analytics, including monitoring player health, with an eye toward injury prevention. Maybe that’s working. Or maybe they’ve figured out something with skinny catchers. Either way, I wondered whether the Pirates’ tandem represented something unusual.

To check, I looked at every team’s catchers since the 1969 start of divisional play. Using this year’s Pirates as my model, I looked for teams for which the top two catchers caught 98.5% or more of all innings. Last year, the average team’s catchers caught 1,446 innings, so I was looking for teams for whom top two catchers were on the field for all but 21.2 innings, on average.

It turns out the Pirates weren’t unique. Brian McCann and JR Murphy caught every inning for the Yankees this year. Wilson Ramos and Jose Lobaton caught all but nine innings for the Nationals. Carlos Ruiz and Cameron Rupp were behind the plate for all but 18 innings for the Phillies. That’s about typical. Since 1969, there have been 240 teams whose top two catchers caught at least 98.5% of all innings during the season, or a little over five per year (closer to four and a half if you exclude strike-shortened seasons).

But totals don’t tell the whole story, since baseball’s expanded from 24 teams in 1969 to 26 beginning in 1977, 28 beginning in 1993, and 30 beginning in 1998. The graph below shows the percentage of teams, per season, with two catchers handling 98.5% or more of the workload. The overall average is 18.6%. There’s a very slight downward trend to the line–the slope is -0.03% (yes, I got the decimals right)–meaning that catchers have been becoming a little less durable over the years, but almost imperceptibly so. (I was tempted to say “a little less durable or managers are giving them more rest,” but other than the occasional Kyle Schwarber, who primarily plays another position but can catch in a pinch, teams just don’t carry three catchers any more, so rest for one catcher in a tandem means playing time for the other.)

(The outlier on the high side is 1994, when there were only 117 games played.)

Teams for which two catchers caught 98.5% or more of innings won, on average, 85 games during the non-strike-shortened seasons. That’s not super impressive, considering the selection bias inherent in this sort of analysis. Specifically, teams with two catchers handling virtually all of the time behind the plate are teams that not only avoid catcher injuries, but also have two catchers good enough that they’d want to have them there all year, contributing to overall team success. In 2014, for example, the Red Sox had three catchers with over 400 defensive innings, in part because none of them could hit: A.J. Pierzynski (540 innings, 71 wRC+), Christian Vazquez (458.1 innings, 70 wRC+), and David Ross (418.1 innings, 71 wRC+). (See, I told you not to ask a Red Sox fan about catchers.)

Still, 85 wins is decent, four games better than .500–that’s the Angels this year. Of the 213 teams for which two catchers caught 98.5% or more of innings in non-strike-shortened years, 77, or 36%, won 90 or more, which is generally good enough to get you into the postseason these days. So there’s certainly an advantage to getting all the work out of two catchers.

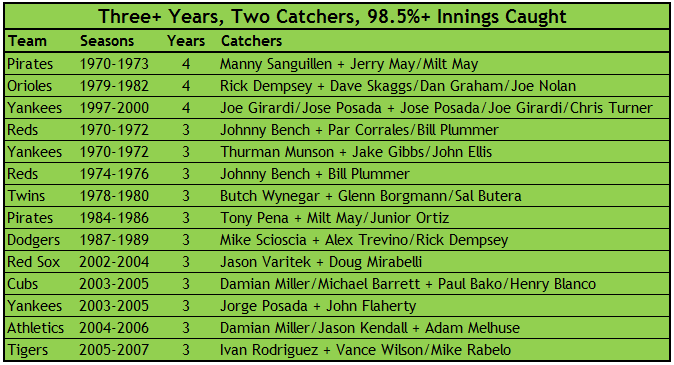
So has anybody cracked the code on keeping their two catchers healthy? I looked for teams that had three or more seasons in a row with two catchers handling 98.5% more of innings. If teams have a secret sauce, they should show up on this list with regularity:

Nope. The closest thing there is the Yankees, who had streaks with Thurman Munson in the 1970s and Jose Posada around the turn of the century. The only other teams to appear more than once are the Johnny Bench Reds and two iterations of the Pirates, over a decade apart and 30 years ago. There’s nothing in this table suggestive that it’s a matter of skill, rather than luck, to keep two catchers on the field all season. Specifically, these teams generally had an All-Star caliber No. 1 catcher who avoided injury with various guys in the backup role. That’s about it. No team has cornered the market on that formula.

So maybe that’s making the criteria too tough. Maybe I should be looking just at back-to-back 98.5%-plus inning performances. Given that, on average, 18.6% of teams had two catchers with 98.5% or more innings caught since 1969, random chance suggests that a team with two dominant catchers has about a one-in-five chance of repeating the following year, like flipping a coin that comes up heads 18.6% of the time. A rate of repeat significantly above that could indicate skill rather than luck. Of the 236 teams, 1969-2014, that had two catchers with 98.5% or more innings caught, 60 repeated the following year, or 25%. That’s not a statistically significant difference (using an N-1 chi-square test, if you were wondering). In other words, there’s no reason to believe that a durable catcher tandem is a matter of anything but good fortune.

So feel good about keeping your two catchers healthy this year, Yankees, Nationals, Pirates and Phillies. Especially the Pirates (111 wRC+) and Yankees (104 wRC+), who got above-average offensive performance from their catchers as well. (The 69 wRC+ Phillies and 62 wRC+ Nationals catchers were among the worst in baseball.) Just don’t assume you’ll be able to keep those two guys on the field all of 2016 as well.


The Method to the Yankees’ Madness

Last week Miles Wray examined an emerging spending pattern of the New York Yankees, suggesting that the club’s approach to free agent spending varies, depending possibly on how many dollars had recently come off their books: They appear to spend each offseason either signing seemingly every premium free agent available (2008-9, 2013-4) or they limit themselves to the bargain bin, focusing on late-offseason signings, reclamation projects, and trades.

While this description is certainly accurate, at least since 2008-9 when this pattern began to emerge, there’s little discussion of why a team would choose to invest in free agency this way.  Presumably, teams like the Yankees, the Dodgers, or the Red Sox, which are capable of fielding significantly higher payrolls than any other team in the league, would prefer to do the opposite: Selecting from a much more limited subset of free agents would limit the advantage gained over other teams.  It’s also not inconceivable that a team with as much money as the Yankees might have concerns that they’d be driving up the entire market, increasing their own cost of acquiring talent.  This approach also has very real impacts on team age and roster flexibility as an entire free agent crop begins to enter their decline years together.

Moreover, the Yankees may very well not be the only team taking this approach.  An argument can be made that the Boston Red Sox are following a similar strategy, albeit at a pace accelerated by their shorter duration contracts they signed in the 2012-3 offseason and their salary-dump trade with the Dodgers four months earlier.  The team signed both Hanley Ramirez and Pablo Sandoval, arguably the two top hitters available in free agency, only a year after they signed precisely one free agent, Mike Napoli, who was their own.

So what does a team gain by going on spending sprees followed by (relative) austerity?  I submit they pursue this approach to gain one thing: draft picks.

Consider for the moment what happens in the case where the Yankees are not following this feast/famine strategy in free agency, and instead they sign a premium free agent each year.  In 2009-10 they might’ve signed Matt Holliday or Jason Bay.  2010-1, Carl Crawford or Jason Werth.  In 2011-2, Fielder/Pujols/Reyes.  In 2012-3 Upton/Hamilton/Bourne/Grienke.  All were free agents tied to compensation, meaning in addition to the dollar-cost of signing that player, the signing team also forfeited a draft pick.  (It’s probably also worth noting how godawful most of those signings look today, but that’s the nature of free agency – The last couple of years are almost always ugly.)  The mechanics of where those picks go have changed since the 2012-3 offseason but the cost to the signing team remains the same: A first round draft pick, or a later round pick if the first round pick is already spoken for.

Instead of signing those players, over that span the New York Yankees signed only a single draft-pick-compensation free agent, Rafael Soriano, 2010-11, and it was over the objections of Brian Cashman.  They kept their first-round draft picks in 2010, 2012, and 2013, and picked up a few compensation picks from departing free agents like Nick Swisher, Javier Vázquez and Soriano.

As Miles points out, however, the Yankees simply can’t stockpile picks and rebuild like a normal team.  This restraint is made possible by lavish spending in the 2008-9 offseason, where the Yankees signed pretty much everybody and then went out and won the World Series.  Signing Teixeira, Sabathia, and Burnett means the Yankees not only forfeited their first round draft pick, but their second and third round draft picks as well.

When viewed in the whole, however, this doesn’t appear to be that bad of a deal for the Yankees.  By moving their spending forward into the 2008-9 offseason instead of spreading it out over four years, they essentially traded their second and third round draft picks in 2009 for first-round draft picks in 2010, 2012, and 2013.  They repeated this approach 2013-4, signing Brian McCann, Jacoby Ellsbury, and Carlos Beltran, and while the early returns from those transactions are not promising, it should be noted that the McCann and Ellsbury deals, at least, were considered sound at the time they were signed.  Beltran?  Not so much.  With the last free agent with draft pick compensation attached off the board, they’re keeping their 2015 first round pick as well.

At a time when the aging curve for older players have suddenly become unforgiving, the value of young players is certainly up, and the Yankees appear to be maximizing their chances of acquiring young talent in the draft by minimizing the draft pick cost of signing free agents.  This approach is remarkably similar to their strategy in the international market, where they’ve determined the best way to acquire talent is not to stick to a limited bonus pool each year, but to sign ten or eleven of the top thirty international free agents, (and possibly one more.)  This approach costs them a great deal of money in luxury tax and international bonus pool “overage” tax, but may make sense given how much surplus value an above-average, cost-controlled young player generates.  Now, if only they could do something with all those draft picks…