Archive for Los Angeles Dodgers

Brian Dozier: Regression, Desperation, and what the Dodgers Provide

As Brian Dozier began a new month with his new Los Angeles Dodgers, it was apropos that Dozier would hit a single, double, and home run in his first game. For Dozier, the Dodgers, and specifically Yasmani Grandal walking off in the bottom of the 10th, August 1 was a magical sort of night. The Dodgers broke a three-game skid to overcome the  Brewers 6-4. regarding momentum, an establishment of tone for the month of August. Having just passed the trade deadline and tied with the Arizona Diamondbacks for the National League West, August represents a fresh start amid a long season – the line between exhaustion and giving the remainder of dwindling energy.

Los Angeles now has Manny Machado, Arizona now has Eduardo Escobar; two players who plug glaring holes to add that last substantive energy. Los Angeles, however, also obtained Brian Dozier – a second baseman who has simply regressed in hitting. He is in a season-long lull, hitting .229 with a .415 SLG, and a 95 wRC+ after finishing at .271, .498, and 125 in 2017. He has never relied on the luck of high BABIP and lucky placement, always an extremely successful hitter for the Minnesota Twins on his own merit. He simply fell flat in a flat batting order.

While not an objective point of analysis, Dozier might just need a change of pace in a new town to start finding the ball again. Open comments to the media regarding Minnesota being ‘comfortable’ and Los Angeles being a team in the race ‘rejuvenating me [Dozier] as a player’ provide surface-level follow-up for the ‘new city – new player’ philosophy.

Considering that Dozier is in the last year of his contract makes him only more of an enigma. The ‘contract-year’ is traditionally when batters inflate their statistics on a bad team for a massive contract in their later years. (Tradition in free-agency, being broken and a topic much written about). With Dozier doing the complete opposite, assuming he has the ability to rejuvenate his career, Los Angeles might be able to hide his genius and buy-low in free-agency. They have attempted to trade for Dozier the past two seasons, hence trading for Dozier has given a subtle chess piece to the Los Angeles front office for the 2019 season.

The importance of Dozier in the Los Angeles lineup is not about dazzling power. While chess piece might be a degrading term, for Dozier, it is a complement to its procedural efficiency. Second base has been Los Angeles’ worst position and Dozier will plug what has been a sloppy turnstile in the batting lineup.

On a micro-level, Dozier’s enigma of a collapse is across the board. He is making 11 percent more contact outside and three-percent less inside contact but is still contacting around 82 percent on the fastball. The only difference, a fall to a .259 from a .298 average. Despite making more contact on sinkers, 83.2 to 86 percent and two-percent less swinging-strikes, he is only hitting at a 126 wRC+ from a 171 wRC+. (And, yes, that is still above average, but a fall for Dozier).

The slider, a pitch never hit for average, has seen seven percent less outside-swings (26.6 to 19.9 percent) and a subsequent drop in outside-contact (60 to 51.2 percent). The result has been 52.4 percent in-field fly-balls, up from 22.2 percent. The worst pitch for Dozier this year has been the curveball, seeing a pitiful .054 average and -50 wRC+. This comes even as he is swinging less at the curve (39.6 to 32.2 percent).

The only pitch Dozier has seen an improvement on is the changeup, hitting at a .333 ISO (.128 in 2017) and a 178 wRC+ (120 in 2017). The main emphasis has been him attacking inside the zone five percent more. This is the same strategy which Dozier held in 2016, when he attacked the inside changeup at 69 percent and hit for a .338 ISO.

The subtle change in Dozier, however, is evident in his attack of the changeup. In 2018, Dozier has been attempting to hit opposite field for changeup power, with incredibly precise hits to right field. He also has gotten lucky on three infield hits. In 2017, however, Dozier was comfortable in pulling changeups to the left-field. While this has been a positive trend for the changeup, on a meta-level, Dozier’s fascination with hitting opposite is putting him on pace for more outs.

The following is a side-by-side comparison of balls resulting in outs for Dozier (per Baseball Savant), with 2018 on the left and 2017 on the right. He is avoiding pulling the ball, and as a result, has patterned his hits into a persistent pattern within a strangely linear line. The same comparison done on balls hit into play with no-outs is further evidence of Dozier attempting to hit balls to opposite field. In short terms, he is attempting to create distinct power by aiming the ball instead of just continuing to comfortably pull.

Conjoining the theory that Dozier will be better on a better Los Angeles roster with what can be termed as ‘futile desperation’ in attempts to hit opposite the field leads back to the subtle change within each micro-pitch. While the meta-level comparison is little changed for swinging percentage, very small, but important tweaks, in Dozier swinging outside exist. Hence, he is trying to walk more.

In other terms, Dozier has been on a bad team, and knowing so, has been attempting to take less risks outside so he walks more while also trying to create more emphatic power by targeting opposite field. He has been trying to mitigate Minnesota’s inefficiencies by playing tighter himself. While one game is hardly a good sample size, there may be an underlying psychological shift in Los Angeles which allows Dozier to relax and comfortably attack the ball.


Corbin Burnes, Spin Rate, and Evolving a Generic Arsenal

He throws a fastball. He throws a slider. He introduces the subtle slight-of-hand with a curve ball. The description could fit one of many relief pitchers who have walked through the doors of Miller Park in Milwaukee. The description is also specific to the debut of Corbin Burnes; a 95 MPH fastball, 2,900 RPM curveball pitcher who paints the plate with spinning fire. The diverse intersection between his fastball, curveball, and more commonly used slider makes Burnes another stable relief pitcher. However, the potential of a changeup with dazzling mechanics have Burnes on pace to fulfill his long-term projection as a starter. The 2018 extended relief situations are only a fine-tuning process, so his meticulous approach will become elegantly meticulous as a starter.

Burnes sample-size is small; three games small. Eventually, as all relievers do, one-bad pitch will create a problematic scenario. The question becomes how Burnes reacts toward that controversy, defining his understanding of strategy negotiation in the MLB. Mechanically, Burnes has the fundamentals to skillfully react, deriving strike-outs with a fastball hitting an average 95.3 MPH, his 87.7 MPH slider with control of a whistling 2,909 RPMs, and his curve ball at an equally mesmerizing 2,922 RPMs.

Comparatively, his slider is one revolution less than Luis Severino, and his curveball has greater spin than Rich Hill or Justin Verlander. Regard, greater effective spin rate does not intrinsically make a pitcher better, but it provides the mechanical solution and optimal projection to build intrinsic control. Spin rate is an essential sign of manipulating batters.

Burnes makes his spin rate effective with a quick release. His pace of pitching further assists in pitch disguise, sitting at 22.8 seconds above the average of 25 seconds. Release points are fairly-well grouped, albeit, the fastball does tend to be released a bit higher than the slider. Maybe more importantly is his curveball is released from the same position as his fastball. Hypothetically, once the change up is released, pitching charts should show that his fastball, curveball, and changeup are released from the same slot. Add in pace of play, and Burnes manipulates batters with intensity and deception.

There are two projection points for Burnes, both unfairly high in Severino and teammate Josh Hader. The purpose is not to heap on all-star expectations early in Burnes’ career, rather to show two optimal styles he can evolve into.

The Severino projection is based upon the quick-pace of play, spine rate, and indication Milwaukee prefers Burnes as a starter. Under this theory, he would need to add in a changeup that can assist in disguising his fastball, forcing batters to swing too early. Severino rose to all-star status on the changeup/slider interlay with distinguished velocity, presenting a velocity map that shows greater control of velocity as he advanced his career. Severino has added two MPH to his fastball (96 to 98 MPH) and increasingly tweaked his changeup – Burnes has the fundamentals to follow this model.

The Hader projection leaves Burnes in the bullpen if his changeup is slow to evolve or a curveball which falls to mediocre control. Hader built a deadeye slider into his arsenal to become a definitive relief pitcher. He has precise control over velocity and placement to set-up pitch one with a fastball, then strike back with a contrasting fastball or slider. Burnes has the fastball quality to match Hader and the ability to control left or right-handed batters. Add in a changeup, and Burnes complements Hader in Milwaukee by becoming a three-pitch, set-up pitcher for innings six through eight.

Through three games in the MLB, Burnes has a swinging-strike rate of 20.5 percent and a first-strike rate of 61.9 percent while hitting the zone 38 percent. His game arsenal shows a favorability to begin with an inside-pitch, then overwhelmingly attack the shadow of the zone. Five of his 20 sliders which have hit the corners of the zone have gone for swinging-strike outs, while another resulted in a ground-out. Six more went for balls, one for a foul, and seven for strikes. Hence, batters have had a hard-time locating his moving slider.

Burnes’ performance against the Los Angeles Dodgers offers insight into his awareness. He relieved Chase Anderson in the fifth with bases loaded and no outs. In a bamboozling play, he worked with catcher Erik Katz to obtain an out on Clayton Kershaw at home. He then threw two sliders to Matt Kemp resulting in swinging-strikes, a fastball outside resulting in a ball which set-up a slider for the final swinging-strike. More importantly, these were pitches with low-contact probability – the one thing which had to be avoided was Kemp obtaining a pop-up to scuttle Joc Pederson or Manny Machado home. Obtaining the punctual strikeout allowed Burnes freedom to throw inside the zone against Max Muncy – any result, including the resulting fly-out, was appropriate, thus Burnes hit Muncy with his 97 MPH fastball.

If Burnes maintains the elegance he showed against Los Angeles, he qualifies to build a skillful foray for Milwaukee either as a starter or reliever. He might be another generic reliever for now; time in the MLB, however, is the one-factor holding him back from creating powerful uniqueness with generic presentations.


Alex Cobb Will Be One of the Gems of This Free Agent Class

Of the pitchers hitting the free-agent market this winter, Alex Cobb is not likely to receive the most fanfare.

Aces Yu Darvish and Jake Arrieta will command contracts north of $100 million. Closers Wade Davis and Greg Holland will do their best to secure four-year deals with big price tags. The whole world is watching every development in the Shohei Ohtani saga. Hell, among midmarket starting pitchers, MLB Trade Rumors predicts Lance Lynn to receive a more lucrative contract than Alex Cobb.

Cobb, who broke in as a full-time starter with Tampa Bay in 2012, has historically shown great promise and good-but-not-great results. He averaged 2.5 fWAR from 2012-2014, lost the next two seasons to Tommy John surgery, then came back with a 2.4 fWAR season in 2017. Cobb has never started 30 games in a season, nor has he ever thrown 200 innings. These facts are concerning to some, but I would argue that he is one of the wisest investments one can make this offseason.

Alex Cobb has evolved as a pitcher through pitch selection. Cobb has a great curveball. You either already know that, or you’re about to find out. He also mixes in a four-seam fastball, a splitter, and a sinker. Right now, curveballs are all the rage in baseball, resulting in tremendous success for pitchers like Rich Hill, Trevor Bauer, and Lance McCullers. They throw their curveballs so often that we can consider the breaking ball, not the fastball, to be their primary pitch. Like Hill, Bauer, and McCullers, Cobb has a quality breaking ball, so it stands to reason he should throw it more often and perhaps eschew his mediocre offerings. With Brooks Baseball, we can track the usage rate on each of his pitches throughout the season.

Look at the first couple data points for the usage rates on his pitches, and then compare them to his points at the end of the season. It’s clear that Cobb began to realize he works best by using the fastball and the curveball exclusively, so he increased his usage rate on those pitches and gradually phased out the splitter and sinker.

The question for Cobb is whether this was a good idea. In Cobb’s career, he’s only posted a strikeout-to-walk percentage (K-BB%) above 15% twice, and only ever so slightly so. He’s not bad in that regard, but it’s not where he makes his bread and butter. Fortunately for Cobb, he is one of the better pitchers in the league at inducing ground balls, which we know is favorable contact. The more grounders Cobb induces, the better he gets, and his curveball is a ground-ball machine. Consider the correlation between the rate at which Cobb increased his curveball usage and his ground-ball rate (GB%) throughout the season:

That’s a pretty strong correlation. It seems that Cobb is ready to join the Hills, Bauers, and McCullerses of the world and ride a high breaking-ball-usage rate to breakout success. Of course, it’s never going to be that easy for Cobb or anybody, but let’s go through one of his starts and parse what we can from the good and bad.

On September 4, Cobb pitched against a red-hot Minnesota Twins lineup and had one of his better starts of the season. His first batter of the game was second-half monster and fly-ball connoisseur Brian Dozier, and he managed to get him out on the first pitch.

It’s been proven that batters from the “fly-ball revolution” can be neutralized if you throw them high fastballs. These hitters are swinging up to lift the ball, but it’s difficult to put much lift on a high pitch coming in fast.

We’re going to focus on the curveball throughout this piece, but here is a fun fact about his fastball. Cobb’s heater sits at 92 MPH and had a spin rate of 2101 RPM this season, which seems pretty pedestrian. However, among starting pitchers with at least 100 batted-ball events involving fastballs, Alex Cobb’s has the 31st lowest exit velocity (87.1 MPH). To put this in perspective, that’s a better mark than James Paxton, Chris Sale, Max Scherzer, Jon Gray, Justin Verlander, and Luis Severino.

Cobb was smart to bait Dozier here, and he reaped the benefits with a first-pitch out to begin the ballgame.

In the second inning, we see Cobb pitching out of the stretch and unleashing a curveball that Ehire Adrianza buries into the ground. This will be the common theme today.

I mentioned earlier that Cobb doesn’t have the K-BB% of Chris Sale or Corey Kluber, so every once in awhile he walks batters. The common thought is that Cobb, who throws so many breaking balls, might end up behind in the count thanks to misplaced curves. Then, to get back in the count, he throws his 93 MPH fastball in the zone, which gets crushed by every hitter expecting it.

This would be a bad habit for Cobb to fall into, but he certainly didn’t in 2017. Consider the list of pitchers who threw the most curveballs while behind in the count this season (via Baseball Savant):There’s Cobb, in fifth place, not far behind Rich Hill himself. All five of these guys have great curveballs, so it makes sense for them to Trust the Process™ and continue dropping the hammer rather than submitting to doom and throwing a predictable fastball in the zone.

After walking the leadoff batter to start the third inning, Cobb knew Joe Mauer could make him pay. So rather than giving Mauer the fastball he wanted, Cobb began the at-bat by dropping a curveball for a strike that even froze the great Mauer.

This changed the whole at-bat, because now Mauer didn’t know whether Cobb would be coming at him with the curve or the fastball. Cobb took advantage of his opportunity, used the fastball to get him in an ideal 1-2 count, and then he went back the curveball and got Mauer to ground into a double play.

Cobb is comfortable throwing the curveball both behind in the count and with runners on base, so he can reap the rewards and induce quite a few double plays. That is an asset. Additionally, Cobb is comfortable throwing his curve from both the stretch (as we saw against Adrianza and Mauer) and from his big windup, as you can see here.

Eddie Rosario is a good hitter who made great strides late in the season, but even he found himself to be another ground-ball victim of Cobb’s curveball.

By the fifth inning, Cobb was almost through his second time against the Twins’ batting order. At this point, they weren’t sure whether to expect the curveball or the fastball, so Cobb was often ahead in the count. Here, he has Eduardo Escobar in a 1-2 count and throws a high fastball that Escobar swings right through.

Everyone in the park was expecting Cobb to throw the curveball to finish Escobar off. From a look at Escobar’s swing, it’s safe to say he was expecting a curveball himself. Cobb’s fastball isn’t necessarily anything special, but the way he uses it to pitch off the curveball can be.

With two outs in the inning, Cobb faced his 18th batter (which would complete his second time through against the opposing batting order). He quickly got Ehire Adrianza into an 0-2 count and then unleashed his best curveball of the night, which Adrianza pounded into the ground for another easy out.

At this point, Cobb had gone through the opposing order twice, pitched five innings, and only given up one run. Teams around the league are beginning to realize that most of their starters simply shouldn’t go out for the third time through the order, even if they are rolling. The Houston Astros just rode using Lance McCullers, Brad Peacock, and Charlie Morton in tandems all the way to the World Series. Those three guys are valuable pieces, and if Cobb is utilized liked this, so is he.

Unfortunately for Cobb, his pitch count was at 85, so his manager decided to bring him out for another inning. The Twins got their third look at Cobb, and I don’t need to cite the statistics to you about what happens at this point. Hitters are smart, so they can pick up on the tendencies of a pitcher if they see him so many times. Alex Cobb, as great at he was through five innings and two times through the order, is no exception to this rule.

Here is Joe Mauer taking an 0-2 curveball from Cobb and driving it into the gap in center for a double.

The important question here is, “was that Cobb’s fault or just a good piece of hitting from Joe Mauer?” Of course, the answer in baseball is always going to be both, but you can see in the embedded GIF that Cobb doesn’t necessarily leave the pitch up. In fact, if you compare it to the curveball that Cobb threw earlier in the game to get Mauer to ground into a double play, it doesn’t look much different — maybe an inch or two higher, at worst. The bigger change is Mauer, who swings like a guy fighting to stay alive in the first GIF, then like he knew exactly what was coming and how to handle it in the second.

This is the “third time through the order” effect in a microcosm. Pitches that fool batters earlier in the game become cookies, so the key is to relieve your pitcher while his pitches still fool the batters. Cobb should not be penalized by us for giving up a double to Mauer there; in 2018, analytical teams will be bringing in a new pitcher in these situations.

In this sense, Cobb is the first free-agent test case for the newest pitching trend in the industry — the tandem starter — one who pitches twice through the order, hopefully gets 15-18 outs, and then gives way to someone else. The Mets, who hired progressive Indians pitching coach Mickey Callaway to be their new manager, have made it clear that all starters not named deGrom or Syndergaard will be shielded from facing lineups more than twice in a game. Baseball has never experienced a shortage of five-inning pitchers in its history, but these changes in pitcher usage are leading to new premiums for these specialists.

It’s as simple as this: every team wants to stock their pitching staff with Alex Cobbs. To be clear, every team wants a Justin Verlander, but there is only one Justin Verlander; even horses Chris Sale and Corey Kluber showed significant wear and tear in October. To combat this dilemma, the Houston Astros deployed Lance McCullers, Brad Peacock, and Charlie Morton in five-inning tandems and rode them all the way to the last out of Game 7.

I expect Alex Cobb will fit into this role quite nicely for whichever team he signs with.


Cody Bellinger’s Ability to Be Great

Cody Bellinger was called up by the Dodgers to the big leagues on April 25th of this year. Coming in at only 21 years of age, Bellinger was looking to make a name for himself. Toward the beginning of the season he would split starts between left field and first base. Eventually Adrian Gonzalez would go down to injury, giving Bellinger the opportunity of being an everyday first baseman. Bellinger rose to the occasion, cementing himself in the history books, as he will be the National League Rookie of the Year. Not only will he achieve this award, but he helped bring his team to the World Series. Before Bellinger’s arrival to the team, the Dodgers were 9 for their first 20 games. The Dodgers would go on to win 104 of their 162 games.

During the course of the season, Bellinger put up incredible numbers. He played in 132 games throughout the year, driving in 97 runs, scoring 87 times, and belting an astonishing 39 home runs, finishing only behind the powerful Giancarlo Stanton (with 59). Bellinger had a respectable .267 batting average while maintaining a .352 on-base percentage and .581 slugging percentage. He was a force at the plate, putting fear into the eyes of many pitchers. Although he didn’t walk so much — only 11.7% of the time — he still managed to have a wOBA of .380, staying in the top 30 for the MLB. On average, he would draw a walk for about every two strikeouts; not the best, but still better than most players belting over 30 homers. His plate discipline was above average for power hitters throughout the season, but come postseason, this would all change.

Throughout much of the postseason, most people were reflecting on Aaron Judge’s struggles, after having himself a historic season at the plate. Judge would break the record for strikeouts in a postseason until Bellinger would then beat this unfavorable record with 29. Through Bellinger’s 15 postseason games, he would belt three home runs, driving in nine runs and scoring 10 times while walking only three times. Most of these statistics happened during the NLDS and NLCS. His wOBA would fall to .295, with a .219 batting average, walking 4.5% of the time, while striking out in an astounding 43.3% of his plate appearances. In fact, in the World Series alone, he would achieve 17 of his 29 strikeouts. Bellinger would struggle immensely at the plate throughout the World Series, with the exceptions of Games 4 and 5.

During the series, the Astros pitching staff would focus on beating Bellinger in on the hands with curveballs falling out of the zone, and with fastballs tailing up and away. Amazingly, Bellinger during the regular season only chased pitches out of the zone 29.7% of the time. This would change immensely as the Astros pitching staff’s effective deception would often pull Bellinger’s bat out of the zone.

In Game 4, Bellinger would face Astros pitcher Charlie Morton in the top of the 5th with no outs in a 1-2 count. Bellinger’s stance is in a more upright position with his bat also in a vertical position. This makes creating torque through his hands a little more awkward, as he rolls his hands into a hitting position. When this curveball begins to spin further in on his hands, it becomes too difficult to bring his hands in further, leading to this awful swing and follow-through shown. His approach on this pitch looks as if he’s trying to hit the ball 500 feet over the right-field wall; not an optimal mindset in a 1-2 count when you know the curveball is coming. His head was nowhere near the zone; he may as well have swung with his eyes closed. This is the position we often saw Bellinger in throughout the World Series when thrown an inside curveball. However, Bellinger would use this at-bat for his next plate appearance.

Now we see later in the game Bellinger is in a 1-1 count facing Morton in the top of the 7th. He knows he’s going to see a curveball in on his hands and adjusts accordingly. His body is in a lower position with his bat in a more angled approach, with his hands staying back, anticipating curveball, looking to stay in on the ball with his hands and drive it to right field. Bellinger manages to fight this pitch off, fouling it back, showing his adjustment helped. His follow-through is also in a significantly better position, with his head staying back looking at the ball, and his body stays in a more balanced stance. This approach, showing that he’s able to make even a small adjustment to making contact with the low and in curveball, led pitchers to start targeting the outside upper half of the zone with the fastball again.

Here we see in Game 4, Bellinger faces Astros pitcher Charlie Morton with a 1-1 count and 0 outs in the top of the 5th. Bellinger’s body is not in an effective hitting position for hitting this outside fastball. His body is falling out away from the zone, his pivot foot is not providing any power, and his hands reach out from his body too far. Bellinger would acknowledge this issue and had this to say before Game 4:

“I hit every ball in BP today to the left side of the infield,” Bellinger said. “I’ve never done that before in my life. Usually I try to lift. I needed to make an adjustment and saw some results today. I’m pulling off everything. Usually in BP I just try to lift, have fun in BP. But today I tried to make an adjustment. I needed to make an adjustment, and so I decided I’m hitting every ball to left field today.”

This is exactly what Bellinger would do.

In the top of the 9th in Game 4 with a 1-0 count and no outs, Bellinger faces Astros closer Ken Giles with runners on. Bellinger has his eyes locked in on the ball as he’s seen this pitch before. He’s using his approach from batting practice earlier to drill this ball into the gap. He keeps his body in an athletic hitting position, keeping his hands in and generating all his power through his lower half, creating torque through his strong hands. We see him drive this ball into the left-center gap, keeping his eyes on the ball the whole way and maintaining a strong follow-through. Bellinger did exactly what he said he would do and helped his team win this game. He would then carry on this adjustment into Game 5, showing people why he will be this year’s NL RoY.

Although Bellinger would fall into his old habits in Games 6 and 7, his ability to recognize where the problem is and the ability he has to adjust is what makes him an effective hitter. Through this, Bellinger will only continue to become better and will continue to become one of the most feared hitters in the league this next season. At only 22 years old now, Bellinger will become the next big star in this great sport we call Baseball.


Gary Sanchez Should Bat Second

What do Mike Trout, Josh Donaldson, Dustin Pedroia, Corey Seager and Manny Machado all have in common? Besides the numerous accolades that they share between the Rookies of the Year, the Silver Sluggers, the MVP awards and the combined 16 All-Star appearances, they all share one less obvious trait: they have more career plate appearances batting second in the lineup than anywhere else. Gone are the days of your team’s best player batting third or fourth. The new normal is now MVP-caliber players batting second. It has worked for Pedroia and the Boston Red Sox, Machado and the Baltimore Orioles, Donaldson and the Toronto Blue Jays and Seager and the Los Angeles Dodgers. Not for nothing, but those teams all made the postseason last year with large contributions from their second-hole hitters AND Trout was the AL MVP for the second time in his career on a last-place Los Angeles Angels team. And as more teams continue to adopt this trend, the New York Yankees should also look to bump up their best hitter.

In an appearance the other week on a YES Network interview, GM Brian Cashman has stated that the Yankees have kicked the tires on splitting Brett Gardner and Jacoby Ellsbury in the lineup. This makes a lot of sense when looking at their game; they both rely on their ability to get on base and set the table more so than their ability to drive in runs. Additionally, both players have slowly, but noticeably, been in decline in recent seasons, primarily due to age and injury. Gardner has been the subject of trade rumors over the past few seasons and Ellsbury has been the ire of the New York media for largely failing to live up to the seven-year, $153-million deal he signed before the 2014 season. River Ave Blues has already had a look at how the Yankees would approach this situation and they have provided a solid solution, but they almost immediately toss out the idea of Gary Sanchez batting there for one reason or another, while Sanchez is most deserving of the promotion.

Sanchez has established himself as the Yankees’ most dominant hitter after bursting on the scene last year. The Yankees, their fans, and the nation all expect Sanchez to hit in the third spot in the lineup, a prestigious position considering the history of the franchise, but moving the young slugger to second would not only better suit the team, but would also play to his strengths. Sanchez, despite the short sample size of 231 plate appearances, has proved to be a pretty good fastball hitter. Of the 294 fastballs he has seen, he has connected for a .328 AVG and .781 SLG, and nine of his 20 home runs. Why does this matter? Traditionally, number-two hitters have seen more fastballs than elsewhere in the lineup, and to further cement his commitment to the fastball, per Brooks Baseball, Sanchez had an exit velocity of 94.3 MPH against the heater (Sanchez ranked in the top 10 in overall exit velocity last year). Young players are also traditionally late to adapt to major-league breaking pitches. Can you blame them when they’re up against this or this?

Secondly, it has been proven that two-hole hitters collect more plate appearances per season than the three through nine spots. This is not new information, but the exact number of plate appearances has been up for debate for years. Beyond the Box Score might’ve ended the debate while also examining how the two hole has changed, stating that “[e]ach drop in the batting order position decreases plate appearances by around 15-20 a year,” which might explain why MVPs Trout and Donaldson have made a living there over the past few seasons. An extra 10-20 plate appearances could mean an extra home run or two over the course of the season. Baseball is a game of inches, but it’s also a game of runs.

With a lineup bereft of veteran power and more intent on utilizing the “Baby Bombers,” as they’ve been so aptly named, moving Sanchez up to second could and should give the lineup a much-needed boost if the reliance on Greg Bird and Aaron Judge should go somehow awry. Veterans Matt Holliday, Chase Headley and Starlin Castro have had good seasons and impressive resumes, but they need to return to All-Star form to carry a team of youngsters and a questionable starting rotation. No one really expects Sanchez to produce at the same rate that he did last year, but perhaps a bump up would allow him to produce at an above-average level again.


Don Mattingly’s Dodgers In the Context of wOBA Expected Runs

Weighted On-Base Percentage (wOBA) is typically considered to be the best measure of offensive ability and effect on runs scored among other rate statistics such as batting average, slugging percentage, and on-base percentage. 89.8% of a team’s runs scored correlates to wOBA between 2005–2015. I decided to look at a team’s performance, measured by how many runs they scored in a season, against the amount of runs wOBA predicted* they would have scored.  (wOBA Expected Runs was calculated based on a linear regression model with runs modeled as wOBA. The adjusted r-squared value of R~wOBA is .898)

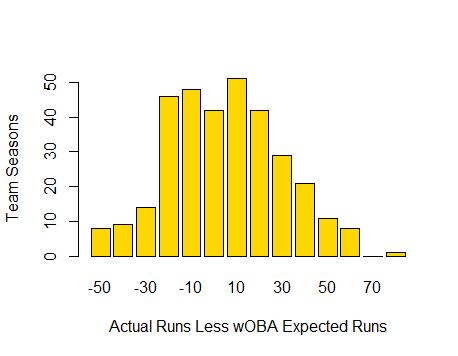
Generally, the results are what you would expect. Teams deviate from their wOBA Expected Runs, but the 50% of the teams (between the 25th and 75th percentile of the observations) range between -17.49 and 16.9 runs from their wOBA Expected Runs.

The outliers even fall within the uncorrelated portion of the relationship between runs scored and wOBA. As stated above, wOBA explains 89.8% of runs between 2005 and 2015. At the far right of the graph is the 2008 Minnesota Twins, who scored 829 runs against their 756 wOBA Expected Runs. The difference, 73 runs, is less than the 10% of runs that is theoretically not explained by wOBA. At the far left of the graph is the 2005 Arizona Diamondbacks who scored 696 runs against their expected amount of 756. Again, this 60-run differential falls within the 10% gap we would expect.

The mean difference of runs scored from the wOBA Expected Runs Scored is minuscule (.003 runs) and the standard deviation from that mean is 24.9 runs. This all strengthens wOBA’s position as the best offensive run predictor.

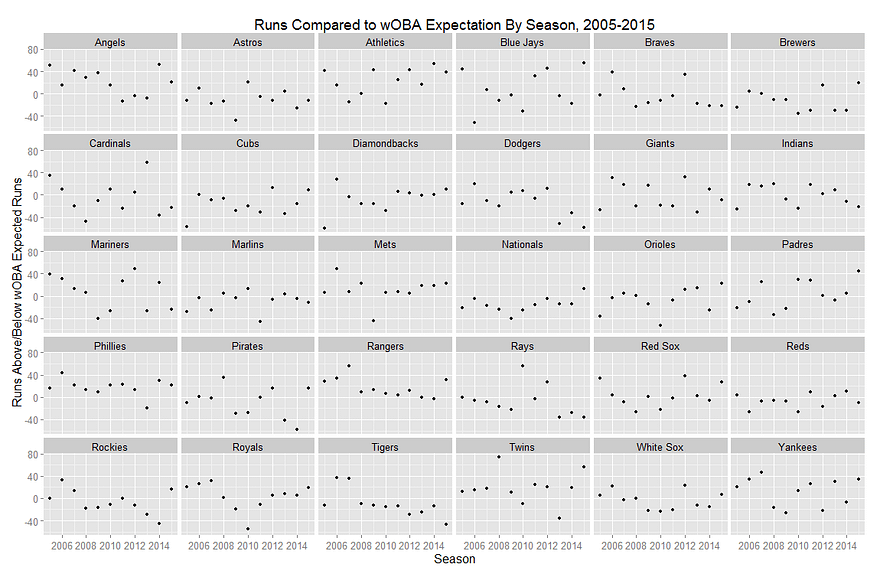
What does this all have to do with Don Mattingly and the Dodgers? The graphs below show each team’s runs scored below or above their wOBA Expected Runs Scored. You’ll see that teams fall within the standard deviation of runs scored less wOBA Expected Runs (-25.93–24.87), with some exceptions. The exceptions that fall outside of that range generally do not display a tendency for extreme over- or under-performance of their wOBA Expected Runs in consecutive seasons; however one team does stand out.

The 2013–2015 Dodgers consistently under-performed their wOBA Expected Runs, with the following differences in the respective seasons from 2013–2015: -51, -33, and -58 runs. To put this in context, only 8 of 330 of teams, or roughly 2%, that took the field between 2005–2015 under-performed their wOBA Expected Runs by more than two standard deviations (-49.8). The 2013 and 2015 Los Angeles Dodgers were two of those teams. No other franchise appears on the list twice, much less twice within three seasons.

In Mattingly’s first two seasons with the Dodgers (2011 and 2012) the results were standard, with a -6 and +12 runs to wOBA Expected Runs differential, but when the Dodgers came under new ownership and started spending to bring in new players things changed. The team got better but their performance in relation to what they were doing got worse.

A glance at the graphs above will show that teams have under-performed their expectations, but never this badly for a three-year stretch. There is luck and there are trends, and the Dodgers are a trend of under-performance. Does this mean Don Mattingly is a bad manager? Maybe. Does it mean that Mattingly was a bad fit for this Dodgers team as constructed? Probably.

It could all be on the hitters; it could all be bad luck, but those seem unlikely. The 2013–2015 Dodgers are the worst offensive under-achievers in the last decade. The results suggest that Mattingly was unable to shuffle a cast of talented and enigmatic hitters into the right order to produce the best sequencing of results. Alternatively, the other narrative is that Mattingly was handed a group of talented and enigmatic hitters that couldn’t execute situational hitting and hit inconsistently. Either way, the Dodgers cost themselves a lot of wins through one, or a combination of the two narratives. The team lost 5, 3, and 5 wins each year, compared to if they met their wOBA Expected Runs, as calculated using the Runs per Win for 2013–2015.

This doesn’t necessarily bode poorly for Mattingly in Miami. The Marlins don’t have the benefit of a deep and talented bench. They are a fairly straight-forward offensive team that should allow Mattingly to write-up consistent lineups so long as the team remains healthy. This is not to say the Marlins will out-perform the Dodgers. It is to say that the Marlins may perform closer to how we would expect them to perform.

However, if the problem did not lie with Mattingly, but instead the Dodgers’ roster, than things do bode poorly for the Dodgers. It will be interesting to see if Dave Roberts can unlock something Mattingly could not; or whether the players are to blame; or whether Los Angeles must wait for Gabe Kapler, baseball’s philosopher-king, to set the runs free.


The NL West: Time Zones, Ballparks, and Social Investing

I think the National League West is the most idiosyncratic division in baseball. Note that I avoided a more disparaging term, like odd or weird. That’s not what I’m trying to convey. It’s not wrong; it’s just…off. Not bad–it’s home to 60% of the last five World Champions, right?–but different. Let me count the ways. (I get three.)

Time zones

EAST COAST BIAS ALERT!

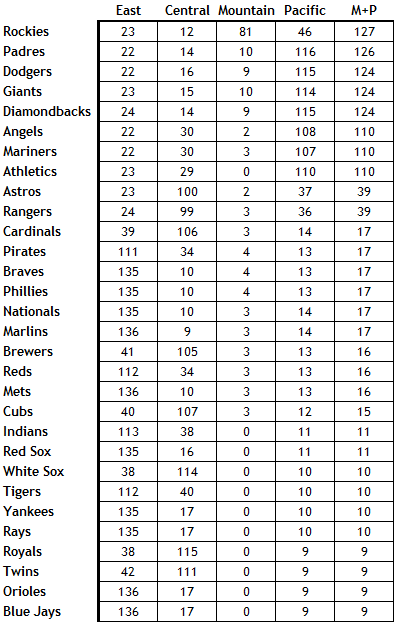
It is difficult for people in the Eastern time zone to keep track of the NL West. Granted, that’s not the division’s fault. But 47% of the US population lives in the Eastern time zone. Add the Central, and you’re up to about 80%. That means that NL West weeknight games generally begin around the time we start getting ready for bed, and their weekend afternoon games begin around the time we’re starting to get dinner ready. The Dodgers, Giants, and Padres come by it naturally–they’re in the Pacific time zone. The Diamondbacks and Rockies are in the Mountain zone, but Arizona is a conscientious objector to daylight savings time, presumably to avoid prolonging days when you can burn your feet by walking barefoot outdoors. So effectively, four teams are three hours behind the east coast and the other team, the Rockies, is two hours behind.

Here’s a list of the number of games, by team, in 2015 that will be played in each time zone, ranked by the number of games in the Mountain and Pacific zones, counting Arizona among the latter:

Again, I’m fully on board with the idea that this is a feature, not a bug. But it’s a feature that means that a majority, or at least a solid plurality, of the country won’t know, for the most part, what’s going on in with the National League West teams until they get up in the morning.

Ballparks

OK, everybody knows that the ball flies in Coors Field, transforming Jose Altuve to Hack Wilson. (Check it out–they’re both 5’6″.) And the vast outfield at Petco Park turns hits into outs, which is why you can pencil in James Shields to lead the majors in ERA this year. But the other ballparks are extreme as well: Chase Field is a hitter’s park; Dodger Stadium and AT&T Park are pitchers’ havens. The Bill James Handbook lists three-year park factors for a variety of outcomes. I calculated the standard deviations for several of these measures (all scaled with 100 equal to league average) for the ballparks in each division. The larger the standard deviation, the more the ballparks in the division play as extreme, in one direction or the other. The NL West’s standard deviations are uniformly among the largest. Here’s the list, with NL West in bold:

  • Batting average: NL West 10.1, AL West 7.2, AL Central 6.5, AL East 5.8, NL East 5.2, NL Central 1.6
  • Runs: NL West 26.5, NL Central 7.9, NL East 6.9, AL East 4.0, AL Central 2.8, AL West 2.7
  • Doubles: AL East 20.3, NL West 11.3, NL East 6.2, NL Central 5.9, AL Central 5.1, AL West 2.9
  • Triples: NL West 50.6, AL Central 49.5, NL East 33.6, AL West 28.3, AL East 27.8, NL Central 11.1
  • Home runs: NL Central 30.2, NL West 23.9, NL East 20.0, AL East 18.7, AL Central 11.3, AL West 11.2
  • Home runs – LHB: NL Central 31.6, AL East 27.4, NL West 25.6, NL East 21.7, AL West 14.7, AL Central 11.7
  • Home runs – RHB: NL Central 32.1, NL West 24.0, NL East 20.0, AL East 14.4, AL Central 13.6, AL West 10.2
  • Errors: AL East 17.7, NL West 12.2, NL Central 11.6, NL East 11.5, AL West 11.2, AL Central 8.2
  • Foul outs: AL West 36.2, AL East 18.3, NL West 16.0, NL Central 15.2, AL Central 13.8, NL East 6.2

No division in baseball features the extremes of the National League West. They ballparks are five fine places to watch a game, but their layouts and geography do make the division idiosyncratic.

Social Investing

You may be familiar with the concept of social investing. The idea is that when investing in stocks, one should choose companies that meet certain social criteria. Social investing is generally associated with left-of-center causes, but that’s not really accurate. There are liberal social investing funds that avoid firearms, tobacco, and fossil fuel producers and favor companies that offer workers various benefits. But there are also conservative social investing funds that don’t invest in companies involved in alcohol, gambling, pornography, and abortifacients. This isn’t a fringe investing theme: By one estimate, social investing in the US totaled $6.57 trillion at the beginning of 2014, a sum even larger than the payrolls of the Dodgers and Yankees combined.

Here’s the thing about social investing: You’re giving up returns in order to put your money where your conscience is. That’s OK, of course. The entire investing process, if you think about it, is sort of fraught. You’re taking your money and essentially betting on the future performance of a company about which you know very little. Trust me, I spent a career as a financial analyst: I don’t care how many meals you eat at Chipotle, or how many people you know at the Apple Genius Bar, you can’t possibly know as much about the company as a fund analyst who’s on a first-name basis with the CEO. So there’s no sense in making it even harder on yourself by, say, investing in the company guilty of gross negligence and willful misconduct in a major oil spill, if that’d bother you.

Note that I said that with social investing, you’re giving up returns. Some social investing proponents would disagree with me. They claim that by following certain principles that will eventually sway public opinion or markets or regulations, they’re investing in companies that’ll perform better in the long run. That’s a nice thought, but social investing has been around for decades, and we haven’t yet hit that elusive long run. The Domini 400 Index, which was started in 1990, is the oldest social investing index. It started well in the 1990s, but has lagged market averages in the 21st century. Now called the MSCI KLD 400 Social Index, it’s been beaten by the broad market in 10 of the past 14 years. It’s underperfomed over the past year, the past three years, the past five years, and the past ten years, as well as year-to-date in 2015. The differences aren’t huge, but they’re consistent. Maybe for-profit medicine in an aberration, but acting on that meant that you missed the performance of biotechnology stocks last year, when they were up 47.6% compared to an 11.4% increase for the S&P 500. Maybe we need to move toward a carbon-free future, but stocks of energy companies have outperformed the broad market by over 100 percentage points since January 2000. I think that most social investing investors are on board with this tradeoff, but some of the industry proponents have drunk the Kool-Aid of beating the market. That’s just not going to happen consistently. In fact, a fund dedicated to tobacco, alcohol, gambling, and defense (aka “The Four B’s:” butts, booze, bets, and bombs) has outperformed the market as a whole over the past ten years.

OK, fine, but what does this have to do with the National League West? Well, two of its members have, in recent years, made a point of pursuing a certain type of player, just as social investing focuses on a certain type of company. The Diamondbacks, under general manager Kevin Towers and manager Kirk Gibson, became a punchline for grit and dirty uniforms and headhunting. (Not that it always worked all that well.) The Rockies, somewhat less noisily, have pursued players embodying specific values. Co-owner Charlie Monfort (a man not without issues) stated back in 2006,  “I don’t want to offend anyone, but I think character-wise we’re stronger than anyone in baseball. Christians, and what they’ve endured, are some of the strongest people in baseball.” Co-owner Dick Monfort described the team’s “culture of value.” This vision was implemented by co-GMs (hey, Colorado starts with co, right?) Dan O’Dowd and Bill Geivett. (OK, O’Dowd was officially GM and Geivett assistant GM, but the two were effectively co-GMs, with Geivett primarily responsible for the major league team and O’Dowd the farm system).

Now, there’s nothing wrong with players who are also commendable people. You could do a lot worse than start a team with Clayton Kershaw and Andrew McCutchen, to name two admirable stars. Barry Larkin was a character guy. So was Ernie Banks. Brooks Robinson. Walter Johnson. Lou Gehrig. All good guys.

But holding yourself to the standards set by the Diamondbacks and Rockies also means you’re necessarily excluding players who are, well, maybe more characters than character guys.  Miguel Cabrera has proven himself to be a tremendous talent and a somewhat flawed person. Jonathan Papelbon has a 2.67 ERA and the most saves in baseball over the past six years, but he’s done some things that are inadvisable. Carlos Gomez, a fine player, second in the NL in WAR to McCutchen over the past two years, has his detractors. Some of the players whom you’d probably rather not have your daughter date include Babe Ruth, Ty Cobb, Rogers Hornsby, Barry Bonds, and many of the players and coaches of the Bronx Zoo Yankees.

I want to make a distinction here between what the Diamondbacks and Rockies did and the various “ways” that teams have–the Orioles Way, the Cardinals Way, etc. There’s plenty of merit in developing a culture starting in the low minors that imbues the entire organization. That’s not what Arizona and Colorado did. They specified qualities for major leaguers, and, in the case of the Diamondbacks at least, got rid of players who didn’t meet them. I don’t know what’s wrong with Justin Upton, but for some reason, Towers didn’t like something about him, trading him away. The Braves make a big deal about character, but of course they traded for Upton, so the Diamondbacks went way beyond anything the Braves embrace.

In effect, what the Diamondbacks and Rockies have done is like social investing. They’ve viewed guys who don’t have dirty uniforms or aren’t good Christians or something the same way some investors view ExxonMobil or Anheuser-Busch InBev. Again, that’s their prerogative, but it loses sight of the goal. Investors want to maximize their returns, but as I said, most social investors realize that by focusing on only certain types of stocks, they’ll have slightly inferior performance. They’ll give up some performance in order to hew to their precepts. Baseball teams want to maximize wins, and there really isn’t any qualifier related to precepts you can append to that.

The Rockies and Diamondbacks were living under the belief that by focusing on only certain types of players, they could have superior performance. It’s like the people who think they can beat the market averages through social investing. It hasn’t happened yet. And, of course, the Diamondbacks and Rockies were terrible last year, with the worst and second-worst records in baseball. Just as social investing doesn’t maximize profits, the baseball version of social investing didn’t maximize wins in Phoenix or Denver.

I’ve used the past tense throughout this discussion. Towers, Gibson, O’Dowd, and Geivett are gone, replaced by GM Dave Stewart and manager Chip Hale in Arizona and GM Jeff Bridich in Colorado. (The Monforts remain.) Last year, the Diamondbacks created the office of Chief Baseball Officer, naming Tony LaRussa, a Hall of Fame manager who’s been less than perfect as a person and in the types of players he tolerates. These moves don’t change that these are both bad teams. But by pursuing a well-diversified portfolio of players going forward, rather than a pretty severe social investing approach, both clubs, presumably, can move toward generating market returns. Their fans, after all, never signed on to an approach that willingly sacrifices wins for the sake of management’s conscience.


Would the Dodgers Have Been Better Off Keeping Andrew Heaney?

Earlier this offseason, the Dodgers and Marlins completed a large trade, with Dee Gordon, Dan Haren, and Miguel Rojas getting shipped to Florida (along with $10 million) while Andrew Heaney, Enrique Hernandez, Austin Barnes, and Chris Hatcher headed out west in return. The Dodgers, whose new front office was in a midst of one of the most ridiculous trading benders in recent memory, then turned around and less than an hour later sent Heaney to the Angels in exchange for second baseman Howie Kendrick. While Heaney was a valuable piece, touted as one of the game’s top left handed pitching prospects who was also considered close to the majors if not already capable of handling it, the Dodgers were clearly happy to get Kendrick in return, an under the radar stud at second base who was worth over four and a half wins last year.

Ignoring the other teams in the trades for a moment, the Dodgers come out of these moves looking much better than they had before. Austin Barnes and Chris Hatcher are both valuable pieces that provide the Dodgers with bullpen and bench depth that they sorely needed. Even if Dee Gordon’s first half was not an aberration, and even if you take issue with both players’ defensive stats, the worst anyone could argue is that both second basemen are close to equal, but most would agree that Kendrick is an improvement over Gordon.

Now obviously, there was more to the trade than their straight up value. Gordon is young and affordable with five more years of team control. Kendrick, while also relatively cheap, is 31 and in the last year of his contract. However, I’m not interested in comparing Kendrick and Gordon. I’m interested in the last piece that the Marlins sent to the Dodgers in their trade, a 23-year-old utility player by the name of Enrique Hernandez. Hernandez broke into the majors for the first time in 2014, playing a total of 42 games with both the Astros and Marlins (he was a part of the Jarred Cosart deal). Among many other skills (which we will soon examine), Hernandez has the ability to play second base, and he was actually pretty decent in his short stint in the majors last year. So what I’m curious to look at is whether the Dodgers are better off with Kendrick manning second and Hernandez on the bench, or whether giving Hernandez the starting job and keeping Heaney might have been the better move for the organization.

Let’s start by examining Hernandez. His primary weapon is versatility, having spent time at SS, 2B, and 3B, as well as all three outfield positions, providing plus defense everywhere he played. On top of that, he also managed to provide value with the bat, posting a .248/.321/.421 line, which was good for a 110 wRC+ last year (I know, offense was crazy down last year). Now granted, that was only in 134 PAs, which leads to the question whether that success was sustainable. Hernandez was not a good hitter in the minors. A 6th round pick in 2009, he averaged an 85 wRC+ across three levels from 2011-2013, and for a while it didn’t look like he was going to amount to anything much. However, something seemed to click in 2014, as he posted above average numbers across three levels, including the big leagues.

So what changed? Well, his strikeout rate dropped (at least in the minors, it spiked once he started facing big league pitching), and his walk rated jumped. He also started hitting for a lot more power, which did manage to carry over to the majors. In an interview with Jimmy Price, Hernandez credited his recent success to a mechanical adjustment in winter ball.

I went into winter ball and decided to figure out what was wrong with my swing. I tried a few things, not really worried about how my season was going, I was just trying to get better and there it was. I tweaked a little something in my batting stance and it clicked. All of the sudden [sic] I was seeing the ball better, recognizing pitches a lot earlier and I started driving the ball again.

These signs (increased walk rate, more power, a mechanical adjustment) all point to a real offensive outbreak as opposed to a fluky few games. On top of that, he even posted a below average BABIP in the majors while still being productive. ZiPS also thinks his breakout is at least somewhat sustainable, projecting him for a .306 wOBA for next year. Combine that with his plus defense, and the system believes he will be worth 2 WAR. While nothing remarkable, that seems like a completely capable starting second baseman.

So now let’s turn our attention to Howie Kendrick, who will be manning second base for the Dodgers on Opening Day, save any Simpsons-esque misfortunes. I suppose injury would be another possibility, but I digress. Kendrick was a top prospect coming up through the Angels system, with sky-high expectations set upon him. While Kendrick didn’t turn into a superstar, he carved out a nice niche for himself, playing plus defense while always being at least average with the bat, sometimes much more. And while he started out his career as an average regular, he turned himself into a well above-average player as he entered his prime, averaging more than four wins per season over the past four years. Last year Kendrick hit a very solid .293/347/397, good for a 115 wRC+. He also provided plus defense, posting a 6.7 UZR. In short, he was really good.

However, next year isn’t necessarily a guarantee of the same thing. ZiPS still likes Kendrick to produce 3.7 WAR, which would be right in line with his past few years. However, Steamer is quite pessimistic, projecting a drop in both offense and defense, and sees Kendrick only being worth 2.4 wins. Let’s split the difference and say that Kendrick will be about a 3-win player next year. Now even here, Kendrick is a clear upgrade over Hernandez, but he does come with some caveats of his own. For starters, Kendrick is 31 years old, and he is also in the last year of his contract that will see him make $9.5 million in 2015. While the salary is a major bargain, the Dodgers will likely have to purchase some of Kendrick’s decline years at the price of his prime years if they sign him to an extension, and he could turn from a bargain into another bad veteran contract.

Now if the Dodgers don’t extend him, they can just take his 2015 and its surplus value, offer Kendrick a qualifying offer at the end of the year, accept the draft pick and move on. Since estimates peg a sandwich round pick to be worth about two wins, we can also factor that into Kendrick’s value. But now we turn our attention to the piece that brought Kendrick to Los Angeles from Not Los Angeles: Andrew Heaney.

The 23-year-old Heaney was highly touted coming up through the minors. He was rated as the Marlins’ number-one prospect by Baseball Prospectus and the number-30 prospect in baseball headed into the 2014 season. Scouting reports were all positive, pegging him with three plus pitches and a repeatable delivery. Bringing all of this from the left side made him all the more attractive. Heaney did nothing to disprove that, starting the year by tearing up AA and holding his own in AAA as well. That culminated with him getting called up to the majors in June when the Marlins were in need of some rotation help.

Unfortunately for them (and Heaney), he was flat-out bad upon reaching the show. Across four starts in June, the young southpaw gave up 15 runs in just 20.2 innings. Heaney only struck out 13 while walking six, but his true enemy was the longball, as he gave up five home runs. Those are all bad totals, which led to his FIP of 6.18. His BABIP of .297 also suggests that he wasn’t really unlucky in any discernible way. These bad outings led to Heaney being sent down on July 6, a day after giving up five runs in just 3.2 innings.

After he spent the rest of the minor league season in Triple-A, the Fish called Heaney back up for another cup of coffee in September, this time using him out of the bullpen. While he wasn’t anywhere near as terrible as his starts in the summer, Heaney wasn’t extremely impressive either, posting a 3.71 FIP in 8.2 innings of long relief. While Heaney is still a highly regarded prospect, and his two stints in the majors are an incredibly small sample size, there are some worrying signs. The home runs are obviously not good, but Heaney also had a Z-Contact% of 93.9. This means that pitches in the strike zone that hitters swung at were hit 94% of the time. That number would have been the highest among qualified starters last year by a lot, and it might suggest that he doesn’t quite have enough to get it by major league hitters, at least not on his fastball.

However, a SwStr% of 9.6 was actually quite good, suggesting he might have to live off his breaking stuff in the show. FanGraphs’ pitch values also support this, rating his fastball as a poor pitch while his slider is average and his change is plus. However, these reasons might have given the Marlins the motivation to move him for Dee Gordon when the opportunity arose. Yet, most scouts (or at least the ones who write on the internet) still look highly upon Heaney. Kiley McDaniel gives him an overall future value of 60, which translates to an above-average starter in the majors. ZiPS also sees potential, projecting the youngster to produce more than a win if given a starting role, albeit with a 4.42 FIP (the system anticipates he’ll still have home run troubles).

But the value of Heaney isn’t what he is now, it’s what he will become. Heaney offers his team six years of team control, his age 23 through 29 seasons. Those are exactly the years you want to control, getting a player right through his prime, then being able to say goodbye as the guy turns 30 and starts to decline. Even if Heaney follows a late aging curve, and doesn’t start realizing his potential until 26, and even if he just becomes a league average starter, it’s still a reasonable expectation that he will produce at least 9 wins over the next six years, save for any injury (which is obviously a realistic but unpredictable possibility).

So, would the Dodgers have been better off keeping Andrew Heaney? Going by ZiPS projections, Heaney and Hernandez combined might be able to provide Kendrick’s 2014 in the aggregate this year, and that doesn’t even include the value the Dodgers would have gained from Heaney in the future. But, there is a lot more to it than that. So even factoring in the potential draft pick or extension Los Angeles might get, the two seem to be more valuable over the long term. However, the Dodgers obviously want to win now. Kendrick not only provides an upgrade over Hernandez for 2014, but they can also fill their fifth slot in the rotation with someone better than Andrew Heaney, which they might have done with the combination of Brett Anderson and Joe Wieland. It also allows the Dodgers to move Hernandez to the bench, where his versatility can be fully utilized. Considering the Dodger’s relatively old infield, it wouldn’t be unreasonable to expect Hernandez to start at least twice a week, possibly more, while providing the team with value on both sides of the ball.

So while keeping Heaney might have provided more value in the long run, it is important to remember that a win now might be more valuable than a win later to a team that is expected to contend for the World Series. Also, the front office folks might not have been as high on Heaney after his brief foray into the major leagues, but they took advantage of an Angels team that still wanted him. Or after already signing Brandon McCarthy, trading for Joe Wieland, and possibly planning on acquiring Anderson as well, the Dodgers might not have wanted to stunt Heaney’s development with another year in the minors. Regardless of the motivation, the LA brass decided that the team was better off with Howie Kendrick than it was with Andrew Heaney. If Heaney turns into a star and Kendrick implodes this year, it might be a move they end up regretting, but this Dodger front office has been executing a very specific game plan all offseason long, and this trade was just another part of it. So odds are they won’t end up regretting this move, because if there is one thing we know for certain, it’s that those guys are much smarter than I am.


Has the Modern Bullpen Destroyed Late-Inning Comebacks?

During the World Series, I submitted an article showing that the team leading Los Angeles Dodger games after six innings wound up winning the game 94% of the time, the highest proportion in baseball. I suggested that maybe that’s why Dodger fans leave home games early; it’s a rational decision based on the unlikelihood of a late-inning rally. (Note: I was kidding. Back off.)

But between the lack of comebacks for the Dodgers and the postseason legend of Kansas City’s HDH bullpen, I wondered: Are we seeing fewer comebacks in the late innings now? The last time the Royals made the postseason, in 1985, the average American League starter lasted 6.17 innings, completing 15.9% of starts. The average American League game had 1.65 relievers pitching an average of an inning and two thirds each. This year, American League starters averaged 5.93 innings, completing just 2.5% of starts. The average game had just under three relievers throwing an average of 1.02 innings each. The reason that starters don’t go as long isn’t my point here, and has been discussed endlessly in any case. But looking at the late innings, today’s batters are less likely to be facing a starter frequently (52% of AL starters faced the opposing lineup a fourth time in 1985, compared to 28% in 2014), reducing the offensive boost from the times-through-the-order penalty. Instead, modern batters face a succession of relievers, who often have a platoon advantage, often throwing absolute gas. The Royals, as I noted, won 94% of the games that they led going into the seventh inning (65-4), and that wasn’t even the best record in baseball, as the Padres were an absurd 60-1. Are those results typical? Has the modern bullpen quashed the late-innings rally?

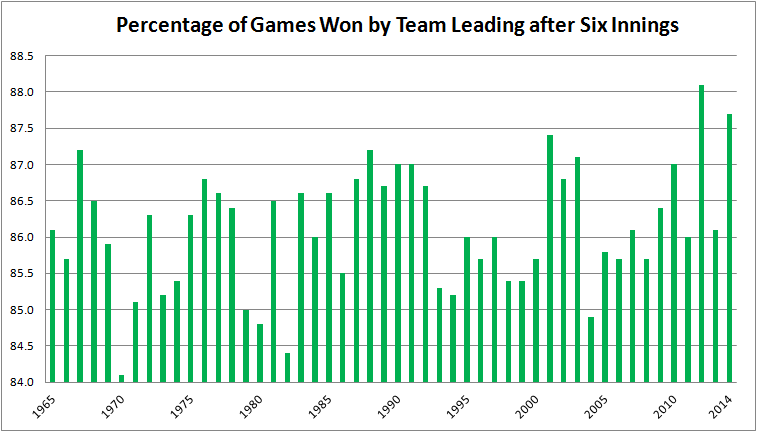
To test this, I checked the percentage of games in each year in which the team leading after six innings was the final victor. (These data are available at Baseball-Reference.com, using the Scoring and Leads Summary.) I went back 50 years, recording the data for every season from 1965 to 2014. In doing so, I got the 1968 Year of the Pitcher; the 1973 implementation of the DH; the expansions of 1969, 1977, 1993, and 1998; the Steroid Era; and the recent scoring lull. This chart summarizes the results:

The most important caveat here is this: In Darrell Huff’s 1954 classic, How to Lie with Statistics, he devotes a chapter to “The Gee-Whiz Graph,” in which he explains how an argument can be made or refuted visually by playing with the y-axis of a graph. This is a bit of a gee-whiz graph, in that the range of values, from 84.1% of leads maintained in 1970 to 88.1% in 2012, is only 4%. That’s not a lot. My choice of a y-axis varying from 84.0 to 88.5 magnifies some pretty small differences. Still, the average team was ahead or behind after six innings 140 times last season, so the peak-to-trough variance is five to six games per year (140 x 4% = 5.6). That’s five or six games in which a late-inning lead doesn’t get reversed, five or six games in which there isn’t a comeback, per team per season.

The least-squares regression line for this relationship is Percentage of Games Won by Team Leading After Six Innings = 85.756% + .015%X, where X = 1 for 1965, 2 for 1966, etc. The R-squared is 0.06. In other words, there isn’t a relationship to speak of. There is barely an upward trend, and the fit to the data is poor. And that makes sense from looking at the graph. The team leading after six innings won 86.5% of games in the Year of the Pitcher, 86.6% when the Royals were last in the Series, 85.7% in the peak scoring year of 2000, and 86.1% in 2013. That’s not a lot of variance. You might think that coming back from behind is a function of the run environment–it’s harder to do when runs are scarce–but the correlation between runs per game and and holding a lead after six innings, while negative (i.e., the more runs being scored, the harder it is to hold the lead), is weak (-0.22 correlation coefficient).

So what this graph appears to be saying, with one major reservation I’ll discuss later, is that the emergence of the modern bullpen hasn’t affected the ability of teams to come back after the sixth inning. Why is that? Isn’t the purpose of the modern bullpen to lock down the last three innings of a game? Why hasn’t that happened? Here are some possible explanations.

  • Wrong personnel. Maybe the relievers aren’t all that good. That seems easy to dismiss. In 2014, starters allowed a 3.82 ERA, 3.81 FIP, 102 FIP-. Relievers allowed a 3.58 ERA, 3.60 FIP, 96 FIP-. Relievers compiled better aggregate statistics. A pitcher whose job is to throw 15 pitches will have more success, on average, than one whose job is to throw 100.
  • Wrong deployment. Analysts often complain that the best reliever–usually (but not always) the closer–is used in one situation only, to start the ninth inning in a save situation. The best reliever, the argument goes, should be used in the highest leverage situation, regardless of when it occurs. For example, when facing the Angels, you’d rather have your best reliever facing Calhoun, Trout, and Pujols in the seventh instead of Boesch, Freese, and Iannetta in the ninth. Managers may have the right pieces to win the game, but they don’t play them properly.
  • Keeping up with the hitters. Maybe the reason teams over the past 50 years have been able to continue to come back in, on average, just under 14% of games they trail after six innings is that hitters have improved at the same time pitchers have. Batters are more selective, go deeper into counts, benefit from more extensive scouting and analysis of opposing pitchers, and get better coaching. So just as they face more and better pitchers every year, so do the pitchers face better and better-prepared hitters.

My purpose here isn’t to figure out why teams in 2013 came back after trailing after six innings just as frequently as they did in 1965, just to present that they did, despite advances in bullpen design and deployment.

Now, for that one reservation: The two years in which teams leading going into the seventh inning held their lead the most frequently were 2012 and 2014. Two points along a 50-point time series do not make a trend, so I’m not saying it’s recently become harder to come back late in a game. After all, the percentage of teams holding a lead were below the long-term average in 2011 and 2013. But I think this bears watching. Pace of game, fewer balls in play, ever-increasing strikeouts: all of these are complaints about the modern game. None of them, it seems to me, would strike at the core of what makes baseball exciting and in important ways different from other sports the way that fewer late-inning comebacks would.


The Unassailable Wisdom of Los Angeles Dodger Fans

Another exit from the postseason deprived the nation of tales of Dodger fandom and their proclivities–Dodger Dogs, Vin Scully, and, of course, leaving the game early. Why they leave early, beats me. Maybe they have premieres to attend. Maybe they’re going to foam parties. Maybe they’re trying to beat the traffic. Me, I don’t know. Like most FanGraphs readers, I’d guess, I have never been invited to a premiere. Or, for that matter, a foam party. (And I’m still not entirely clear as to what one is.) As for beating the traffic, yeah, I get it, average attendance at Dodger Stadium was 46,696 this year, highest in the majors, so I imagine that’s a lot of cars. But Dodger games took an average of 3:14 last year, which means that night games ended well after 10 PM, so one would assume that traffic on the 5 and the 10 and the 101 and the 110 would have eased by then, though I don’t live in a part of the country in which highways are referred to with articles, so what do I know.

Aesthetically, of course, the argument against leaving a game early is that you might miss something exciting–an amazing defensive play, a dramatic rally, last call for beer. That would seem to trump the concerns of early departers.

Especially a rally. A late-innings comeback is one of the most thrilling pleasures of baseball. But that made me wonder: Are they becoming less common? If so, wouldn’t that be an excuse, if not a reason, for leaving early?

During the postseason, you may have heard that the Royals have a pretty good bullpen. (It’s come up a couple times on the broadcasts.*) With Kelvin Herrera often pitching the seventh, Wade Davis the eighth, and Greg Holland the ninth, the Royals were 65-4 in games they led after six innings. Of course, a raw number like that requires context, so here is a list of won-lost percentage by teams leading after six innings:

Team W L  Pct.
Padres 60 1 98.4%
Royals 65 4 94.2%
Nationals 72 6 92.3%
Dodgers 81 7 92.0%
Twins 52 5 91.2%
Giants 62 6 91.2%
Orioles 72 7 91.1%
Indians 67 7 90.5%
Braves 62 7 89.9%
Tigers 70 8 89.7%
Rays 61 7 89.7%
Mariners 68 8 89.5%
Angels 76 10 88.4%
Marlins 51 7 87.9%
Cardinals 69 10 87.3%
Reds 61 9 87.1%
Yankees 67 10 87.0%
Cubs 59 9 86.8%
Brewers 63 10 86.3%
Athletics 65 11 85.5%
Phillies 53 9 85.5%
Mets 64 11 85.3%
Red Sox 52 9 85.2%
Pirates 61 11 84.7%
Blue Jays 61 11 84.7%
Reds 51 10 83.6%
Rangers 45 9 83.3%
Rockies 49 11 81.7%
Diamondbacks 49 12 80.3%
Astros 54 16 77.1%

Sure enough, the Royals did very well. The major league average was 87.7%. Kansas City, at 94.2%, easily eclipsed it. But, as you can see, so did the Dodgers. We certainly didn’t hear about their lockdown bullpen in their divisional series loss to the Cardinals. Presumably, the Dodger bullpen’s 6.48 ERA and 1.68 WHIP over the four games of the series had something to do with that. But during the regular season, the Dodgers held their leads.

How about the other way–what teams were the best at comebacks? Shame on Dodger fans if they were leaving the parking lot just as the home team was launching a rally, turning a deficit into victory. Here’s the won-lost record of teams that were trailing after six innings:

Team W L  Pct.
Nationals 14 54 20.6%
Athletics 12 52 18.8%
Angels 11 48 18.6%
Pirates 11 50 18.0%
Giants 13 60 17.8%
Marlins 14 66 17.5%
Royals 11 58 15.9%
Cardinals 8 47 14.5%
Indians 10 59 14.5%
Tigers 9 54 14.3%
Orioles 8 50 13.8%
Reds 10 64 13.5%
Astros 9 64 12.3%
Mariners 8 57 12.3%
Brewers 8 59 11.9%
Blue Jays 8 60 11.8%
Yankees 7 53 11.7%
Padres 9 71 11.3%
Mets 7 59 10.6%
Twins 9 77 10.5%
Phillies 8 71 10.1%
Red Sox 8 72 10.0%
Diamondbacks 8 73 9.9%
Rays 7 66 9.6%
Cubs 7 71 9.0%
Rockies 7 72 8.9%
Rangers 7 74 8.6%
Reds 5 67 6.9%
Braves 3 60 4.8%
Dodgers 2 54 3.6%

Whoa. Ignoring for now the late-inning heroics of the Nationals, who were able to come from behind to win over one of every five games that they trailed after six innings, look who’s at the bottom of the list! The Dodgers trailed 56 games going into the seventh inning this year, and won only two.

So maybe the Dodger fans who left games early are on to something. I devised a Forgone Conclusion Index (FCI) by combining the two tables above. It is simply the percentage of games in which a team leading after six innings comes back to win the game. For example, the Royals led after six innings 69 times and, by coincidence, trailed after six innings an equal number of times. Their Forgone Conclusion Index is 65 Royals wins when leading after six plus 58 opponents’ wins when the Royals trailed after six, divided by 138 (69 plus 69) games in which a team led after six innings. The Royals’ FCI is thus (65 + 58) / 138 = 89.1%. The team leading Royals games going into the seventh inning wound up winning just over 89% of the time. A Royals fan wishing to leave a game after six innings did so with 89% certainty that the team in the lead would go on to win. (Yes, I know, I should do a home/road breakdown, but this is a silly statistic anyway.)

Here’s the Foregone Conclusion Index for each team last year.

Team FCI   Team FCI   Team FCI
Dodgers 93.8% Rangers 88.1% Giants 86.5%
Padres 92.9% Indians 88.1% Blue Jays 86.4%
Braves 92.4% Tigers 87.9% Nationals 86.3%
Twins 90.2% Phillies 87.9% Diamondbacks 85.9%
Reds 90.1% Red Sox 87.9% Angels 85.5%
Rays 90.1% Yankees 87.6% Reds 85.2%
Royals 89.1% Mets 87.2% Marlins 84.8%
Orioles 89.1% Brewers 87.1% Athletics 83.6%
Cubs 89.0% Rockies 87.1% Pirates 83.5%
Mariners 88.7% Cardinals 86.6% Astros 82.5%

And there you have it. The Dodger patrons leaving the game early weren’t being fair-weather or easily-distracted fans. Rather, they were simply exhibiting rational behavior. They follow the team for which the team leading after six innings was the most likely in the majors to hold on to win. They were the least likely fans to deprive themselves of the excitement of a late-inning comeback by leaving early.

I know what you’re thinking: Single-season fluke. There have to have been more comebacks in Dodger games in recent years, right? As it turns out, yes, but not a lot. The Dodgers were eighth in the majors in Foregone Conclusion Index in 2013 (87.8%) and seventh in 2012 (90.4%). Maybe 2014 is an outlier in which there were an extremely small number of comebacks in their games, but over the 2012-2014 timeframe, only the Braves (91.8% FCI) and Padres (90.9%) have played a higher proportion of games in which the team leading entering the seventh inning has gone on to win than the Dodgers (90.8%).

So keep it up, Dodger fans. Get into your cars during the seventh inning, turn on Charlie Steiner and Rick Monday on the radio, and drive on your incrementally less crowded highways on the way to your premieres and foam parties. You probably won’t be missing a comeback, and by leaving early, you’re expressing your deep understanding of probabilities.


*TBS managed to botch a fun fact about Kansas City’s bullpen. At one point, they posted a graphic stating that the Royals are the first team to have three pitchers–the aforementioned Herrera, Davis, and Holland–to compile ERAs below 1.50 in 60 or more innings pitched. They forgot the key qualifier: Since Oklahoma became a state. The 1907 Chicago Cubs featured three starters with ERAs below 1.50: Three-Finger Brown (1.39), Carl Lundgren (1.17), and Jack Pfiester (1.15). The Cubs’ team ERA was 1.73.