Archive for David Ortiz

The Elite Imperfections of Mike Trout

It’s hard to tell exactly what’s going on with a player when their numbers get skewed. Sometimes its injury, others could be due to team/manager/front office resentment, more often than not it can be attributed to bad luck. However, when numbers begin to become conventional or eclipse career norms on a regular basis, under certain conditions, it behooves me as a curious self-proclaimed ‘baseball scientist’ to look into that.

Today’s subject is one Mike Trout of the Los Angeles Angels. Observe his monthly OPS through his seven seasons in Major League Baseball.

troutMonthOPS

Before I proceed, this is not an indictment or deposition on Trout. This is a scrutinization that will attempt to answer why his OPS drops so sharply once we hit the dog days of summer.

Trout is a great player, no one can deny that. You ask just about any baseball player if they’d like to have numbers like Trout and they’d answer before you even finish the question.

A simple assumption through basic observation would be that it’s the fault of the three true outcomes; striking out more and walking less while his power remains the same or takes a dive as well. Since I don’t have a better explanation yet, we’ll stick with that.

But first, I wanted to see if Trout was any sort of outlier; does the average player peak mid-season, then drop off as Trout does? Sort of.

mlbMonthlyOPS

I see the same dip, somewhat as steep for Trout, in July but followed by a resurgence into August. OK, so nothing extreme; basically the same start with a disjunct finish.

Going back to his monthly performances, what also stood out is that as his at-bats increased, his OPS seemed to decrease. However, that only occurred once he surpassed 500 ABs. In the scatter plot below, the coefficient of determination reveals that just about 60% of Trout’s OPS change is attributed to his increase in ABs. That’s a pretty good interrelationship.

troutScatterOPSAB

So far we know that Trout seems to fade in late summer and that his OPS plummets as his at-bats go up. Is it as simple as that? I can somewhat understand that as the season progresses, players get worn out and, sometimes but not always, their production drops. But the ABs situation makes it more intriguing; you’d think a great hitter is usually always great regardless of the number of times he comes to bat. It doesn’t always follow that the more chances you have the more likely you are to fail.

Remember my original supposition of K/BB/HR variation causing his OPS drop? That’s an invalid inference because we have the same thing happening; as ABs increased, his strikeouts and walks did also. Home runs bounced a little with no correlation to AB figures.

troutPercentIncrease

Trout’s strikeouts did jump quite a bit from June to July while his walks increased at the same rate as his ABs. However, his biggest OPS drop-off was from July to August, so we can’t parallel that to a conclusion. The following month (July to August), his ABs increased at the same 11% with both walks and strikeouts growing at the identical rates.

Not satisfied, I needed a couple of player comps to see if they showed any of the similar tendencies I see with Trout. Using his career wRC+ (the best all-inclusive offensive stat) of 169, I see Joey Votto, Miguel Cabrera, and David Ortiz in his range.

  • Votto- 162
  • Cabrera- 158
  • Ortiz- 151

Now, lets move back to their OPS. I took the quad’s career monthly average and created a comparison chart. Keep in mind we aren’t concerned about the numbers, only the trends.

And, because I’m a cheapskate, I have to use Google Sheets to create this chart which will not let me customize the labels.

 So you have: Trout, Cabrera, Votto, Ortiz

compareCareerMonthlyOPS

Cabrera dips about the same time as Trout but his trend line is much more stable. Votto seems to get better as the season goes on, while Ortiz seems to match pretty well except for his minor improvement in Sept/Oct.

So, is Trout and anomaly? Not really; Oritz has very similar tendencies, but also played twice as long as Trout has. To say for certain they match will take more playing time for Trout. In any case, for a player as good (and highly regarded) as Trout, that drop-off is still vexing.

So, I moved on to check and see if his hitting tendencies change. We can view Trout’s career monthly contact figures to determine if there are any obvious signs that could give any sort of explanation for the drop. Things like putting more balls on the ground instead of the air, contact type such as line drives which end up as hits more often, any infield pop-ups indicating a change in swing path, and directional hitting in regards to beating any sort of “shift” to his hitting proclivities (e.g. more balls are finding well-positioned fielders).

contactTypeTrout
A couple of things stand out. The first being his line drive rate; dropping from 23.6 to 19.2 from June to Oct. Secondly his hard contact; while not a huge difference, we can see less potential for barreled contact. Lastly, as you would expect, his BABIP and OPS drop sharply from June on; .395 to .333 and 1.036 to .919 respectively.

Perhaps looking into what causes line drive as well as his hard contact regression will provide the answer; are there changes in exit velocity and/or launch angle? As a reminder, we only have the data that is available through the Statcast era (2015-2017), so take this with a grain of salt; I’m not sure we can glean much from it but its worth looking because it covers roughly half of his career.

  • June- 13.8 degrees/91.6 mph
  • July- 13.9 degrees/91.4 mph
  • August- 14.3 degrees/91.3 mph
  • Sept/Oct- 14.7 degrees/91.1 mph

There are drops but the change is slow; launch angle changes by nearly one degree and exit velocity declines by .5 MPH. Can we claim that as the cause? It’s hard to say because as I noted, it only covers his last three years.

To reinforce the lack of apparent swing path/tendencies, observe the gif that goes in chronological order from June through Sept. Do you see any pronounced change, because I don’t?

troutLA

Perhaps I’m thinking about this too hard. Perhaps I’m asking the wrong question(s). Perhaps its just the way it is; sometimes you eat the ball and sometimes the ball eats you. As I said before, this isn’t a judgment or doubt on Trout’s ability; when he’s at his worst, he’s still better than most of the other hitters in the league.

This post and others like it can be found over at The Junkball Daily.


The Problem With the Shift

The concept of “the shift” has become more widely used throughout major-league baseball. While some teams shift more than most, others are shifted against more than most. The Shift Era is still relatively new as teams dive deeper and deeper into the analytical realm to increase winning percentage. However, is using the shift actually effective?

I believe that there are certainly situations where the shift should be utilized. Players such as David Ortiz, Albert Pujols, Brian McCann, etc. generally are the style of players to shift against. Older players generally rely more on pulling the ball because they are able to generate more power. These styles of pull-only hitters are usually prime targets for shifting against. My question is, why haven’t these players adapted their swing against the shift?

When learning swing mechanics, you’re taught to square up the baseball and drive the ball where it’s pitched. When shifting, pitchers are forced to make very selective pitches to avoid batters driving the ball the other way through the shift. This is hard for pitchers because it takes away some of their effectiveness. Hitters are beginning to find ways to beat the shift and steal easy hits. If a batter is in a shift situation, they can essentially eliminate pitches towards the outside half of the plate. Knowing the pitcher’s pitch arsenal, the batter can then be selective in his approach. Depending on the count, the batter can determine the next pitch, whether it’s offspeed or a fastball. Obviously a tailing fastball in on the hands is hard not to roll over into the shift, but that’s just good pitching.

Batters are finally beginning to grasp that they can beat the shift by simply putting down a bunt down the line. Or, they can create longer bat lag from their hands letting the ball travel deeper in the zone and taking the ball to the opposite field. The best hitters in baseball are those who can hit to all areas of the field. Charlie Blackmon was shifted against 121 times this year; he hit .412 against the shift. Why in the world would teams shift against him 121 times? Kris Bryant was shifted against 210 times; he hit .364. Players like this who are able to adapt their swing progressions at the plate should not be shifted against this often. Teams are simply giving them easy hits, which lead to runs. The whole point of the shift is to avoid baserunners, right?

Again, there are some batters against whom shifting works. Brian McCann was shifted against 248 times and still hit .243 against the shift, which is still pretty good considering it’s towards the bottom of the league. Lucas Duda was shifted against 241 times, hitting .243; still not terrible. Again, there are situations you can get away with shifting. The only time teams should shift should be with no runners on, strict pull hitters, and with a pitcher who’s comfortable with pitching inside.

When teams shift with runners on, I believe it’s a terrible strategy. It’s considerably difficult turning a routine double play with players out of their positions. Also, it’s difficult to catch runners stealing when you have a third baseman trying to find the bag and make the tag. Players like Dustin Pedroia have taken advantage of teams using the shift with runners on to take the extra base with the third baseman out of position. Players are beginning to find holes in the shift and are taking advantage, leading to runs.

When shifting, I believe the best option is to leave the shortstop between 2nd and 3rd, the second baseman shaded up the middle towards the bag, and the third baseman moving into right field between 1st and 2nd. With the third baseman in this position, he can create the same angle to 1st as when he’s at 3rd. This way players are in more comfortable standard positions, keeping the double play a more viable option. Shifting works in certain situations, but teams need to be more careful as hitters begin to adapt their approaches and steal easy hits, using the shift against the enemy.


An Early Look at the AL MVP Race

[This analysis is also featured in our emerging blog www.theimperfectgame.com]

With less than one month to go, the American League MVP race is very close. While usually nothing is set on stone in early September, during the last few years the AL MVP has been a two-man race (Mike Trout with either Josh Donaldson or Miguel Cabrera). This year, however, features five remarkable candidates: Mookie Betts, David Ortiz, Jose Altuve, Mike Trout and Josh Donaldson. Yes, I expect a few other to grab a few top-five votes (e.g. Cano, Cabrera, Lindor and Machado) but I don’t anticipate the award to fall outside those five players.

Let’s look at the classic, old-school numbers first, which not only are sometimes referenced in casual conversations at local bars and pubs but also frequently (and occasionally unfortunately) followed by voters. I’ve plotted R, RBI, HR, OBP, SLG and SB as percentiles of the entire population. Let’s take a quick look.

Picture

If you like well-rounded players, probably this year you’re excited with Altuve, Trout and Betts, who dominate across the board. In an era where stolen bases keep declining, 20+ SB will get you to the 90th percentile. On the other hand, if you’re into true sluggers, then the show Ortiz has put this season should be one to remember. However, then again, these metrics paint only part of the picture — they don’t take into account when or where each event happened nor they include defense or base running on its most complete form.

Let’s take a deeper look at WAR and a quick indicator for each batting, fielding and base-running performance.


Player WAR wRC+ UZR/150 BsR
David Ortiz 4.0 164 0 -7.4
Jose Altuve 6.6 160 -0.4 0.3
Josh Donaldson 7.1 161 10.6 -0.8
Mike Trout 8.1 175 -2 8.0
Mookie Betts 6.6 138 16.4 8.0

Obviously when we move away from batting, David Ortiz loses ground — he only contributes in one aspect of the game, and while he has been outstanding in the batter’s box, likely it will not be enough for him to win. When we adjust by park and league, we realize the Trout – Betts race for the best OF is not as close as I initially thought. Trout has quietly put a(nother) great season on an awful team (again) — he’s already at 8.1 WAR and a 175 wRC+, with both easily leading the league. His defense is slightly below average at best but he compensates by running extremely well. Altuve and Donaldson have had similar seasons offensively. However, Altuve is having a down season in both defense and base-running (remarkably low on Ultimate Base Running (UBR), which measures how frequently and effectively a runner takes an extra base via running). Betts drives his value largely from his defense, where he’s settled in nicely as one of the best OF this year.

One of the metrics I tend to assess when I look at awards is how performance was spread the entire season. I want an MVP to be someone that I rely throughout the year, not only during a hot stretch. Additionally, having a big month can really uplift the numbers and build up a misleading argument in favor of someone. Let’s understand how wRC+ is split by month.

Picture

This picture to me is interesting for a couple of reasons. First, part of the argument on Betts’ candidacy is that he’s getting better, and delivering when it matters the most — in the middle of a pennant race. After a below-average March/April, Betts has been a beast since July, when Ortiz cooled off a bit. Now, then again, Mike Trout has also followed an upward-trending curve — peaking at 206 in August — and his lowest point is at 144, which is the highest of all lowest points in the sample. From my perspective, if everything else is equal, I’d rather have a Trout-esque curve than Donaldson’s one, who has the highest single-month wRC+ (213 in June) but also with the largest swing (118 difference between May and June). And then you have remarkably constant Altuve — with the narrowest gap between highest and lowest points throughout the season and at least 140 wRC+ in any given month.

Now, most of what we have shown up to now is context-neutral. An argument could be made that every single game is worth the same, regardless of whether it’s in April or July — what’s really important is to deliver in key, high-leverage situations. There is where true MVPs show their full potential to influence a team and define its fate. As they say, a home run against a non-contender team when you are losing by five runs is not as valuable as a game-winning double against our wild-card-rival’s closer in the 9th inning. I’ll admit neither OPS in high-leverage situation or Win Probability Added (WPA) is the perfect metric to evaluate this, but they provide a very good proxy to how well they have fared in tough, game-changing situations. If you are not familiar with WPA, please click here.

Picture

Again we see the usual suspect — Mike ‘King’ Trout — leading not only this graph but the MLB with his 5.66 WPA, closely followed by Josh Donaldson, and they’re the only two players from this sample to have a higher OPS in high-leverage situations than in low-leverage ones. Interestingly, Boston’s Betts and Ortiz’s OPS go down 9% and 15% respectively when the stakes are high. I definitely don’t want to say that Altuve’s 0.841 OPS in high leverage is bad, but I certainly want to recognize Donaldson’s and Trout’s clutchier performance.

Another way of looking at the MVP is to ask yourself: Where would that team be if that player wouldn’t have been part of it? While in essence it is impossible to know for sure the answer, a nice proxy is to measure what percentage of position-player WAR is that player responsible for, i.e. what percentage share does this player represent.

Player WAR Team WAR %
David Ortiz 4.0 28.7 14%
Jose Altuve 6.6 18.8 35%
Josh Donaldson 7.1 21.4 33%
Mike Trout 8.1 17 48%
Mookie Betts 6.6 28.7 23%


Well, this is another way to see Mike Trout’s leadership on the field. Almost half of the Angels’ WAR have Trout’s name attached to it, which is amazing. (For reference, the leaders in this table are Khris Davis and Marcus Semien with 122% (2.2 WAR each out of 1.6 Athletics total WAR). Now, Donaldson and Altuve have, too, a remarkable 33% and 35% of their total, but probably Betts falls short again with his 23%.

At the end, when all is said and done, it looks like numbers indicate it should go down to a Donaldson vs. Trout race, just as it was in 2015. Ortiz has had an amazing season but his base-running and defense (or lack thereof) limit his overall impact on his team. Betts is definitely an exciting, five-tool player, but his performance hasn’t been as good as Donaldson’s or as consistent as Trout’s. Additionally, Boston’s talent-loaded team reduces his value (this is the opposite of the Trout-Angels argument – how valuable can you be when your team would perform well, even if you’re not there?). His future is extremely bright though. Finally you have Altuve, who may have a legitimate case but falls (a bit) short on overall performance to Donaldson and Trout. Houston has under-performed and arguably that’s a worse outcome than Trout’s, because we knew the Angels were going to be bad, but we thought the Astros would be better.

Last year, Donaldson built his case with a magnificent August, when he posted a 1.132 OPS and Toronto got to first place in the AL East. This year it was Trout who had a torrid August, but the Angels are not in the wild card race. It surely seems to me as if we are measuring the MVP as a team award. Though I understand the rationale of having an MVP on a winning team, there is more to it. If I had a vote, and still being a few games away from the end of the season, I’d support Trout in his quest for his second MVP (as of today), but it looks like momentum and narrative are gaining traction around Donaldson — who has posted much better numbers than in his MVP season — Altuve — who brings new blood to the MVP discussion and might get an extra push if Houston makes it to the playoffs — and Betts — who is clearly the face of Boston’s extremely talented young generation. They, though, despite great Septembers, will post worse numbers than Trout. Yes, the Angels are a bad team — but to what extend is that Trout’s fault? What else could he have done? When did ‘valuable’ translate into ‘winning by himself beyond reasonable expectations’? When did we change this award to ‘best player on the best team’? In 2012 it was Cabrera’s Triple Crown and in 2015 it was Donaldson’s ‘ability’ to get Toronto to the postseason for the first time in many years. In 2016, Trout has been comprehensively better, avoided any deep slumps during the season, and performed very well under pressure and shown that you can put counting stats up on a bad team. We are running out of excuses this year.


The Contours of the Steroid Era

One of the things I enjoy most about FanGraphs Community–really, I’m not just apple polishing here–is the quality of the comments. After I came up dry trying to explain the increase in hit batters to near-historical levels in recent years, a commenter led me to what I feel is the correct path: Batters are more likely to be hit when the pitcher’s ahead on the count (and thereby more likely to work the edges of the strike zone, where a miss inside may hit the batter), and the steady increase in strikeouts has yielded an increase in pitchers’ counts on which batters get hit. Similarly, on December 30, when I wrote about how larger pitching staffs have adversely affected the performance of designated hitters, I got this smart comment from Jon L., reacting to my contention that the relative (not absolute) rise in DH offensive performance (measured by OPS+) from 1994 to 2007 probably wasn’t related to PEDs because the improvement was relative to increasing offensive levels overall:

I think it was clearly a PED thing. Players were able to build strength and muscle mass to enhance hitting prowess, and were willing to take the hit on baserunning and agility that comes with toting more weight around. And why not? The money’s in hitting. PEDs were more appealing to players with some initial level of slugging ability, and disproportionately benefited DH-type skills.

That made me think about the Steroid Era (or the PED Era, or, as Joe Posnanski put it, the Selig Era). Generally, I avoid this issue. I listen to SiriusXM in my car, and when I’m on MLB Network Radio and the discussion turns to PEDs, I change the station. I’ve had enough of it for this life, and of course it’ll keep going into overdrive every year around this time with all the Hall of Fame posturing. And, of course, there are commentators like Joe Sheehan who attribute the change in offense since drug testing was instituted to changes in contact rate rather than, as he calls them, “sports drugs.” I’m not making a call on any of that here.

But Jon L.’s comment made me look at the era in a different light. As I noted in my piece, between 1994 and 2007, the average OPS+ for designated hitters was 109. Prior to that, it was 104, and since then, it’s been 106. Those 14 years between 1994 and 2007 represent the high-water mark for DH offense. both absolutely and relatively. In the 42 years in which the American League has had a designated hitter, there have been 28 seasons in which the OPS+ for DHs was 105 or higher: Every season from 1994 to 2007, but just half of the remaining 28 years.

So I’m going to start with the years 1994-2007 as my definition of the Steroid Era. I’m not saying they’re the right answer. They do fit in with the record for DHs, and I’d note that those fourteen years account for 23 of the 43 player-seasons, and 14 of the 23 players, hitting 50+ home runs in a season. (And that doesn’t include 1994, when six players–Matt Williams, Ken Griffey Jr., Jeff Bagwell, Frank Thomas, Barry Bonds, and Albert Belle–were on pace for 50+ when the strike ended the season.) But maybe the Steroid Era started, as Rob Neyer recently suggested, in 1987, following Jose Canseco’s Rookie of the Year season. That’s the same starting point the Eno Sarris points to in this article from 2013. Maybe it ended in 2003, the last year before drug testing commenced. I’ll get to that later.

To test Jon L.’s hypothesis, I looked at Bill James’s Defensive Spectrum, which puts defensive positions along a continuum:

DH – 1B – LF – RF – 3B – CF – 2B – SS – C

For purposes of this analysis, let’s just say that the defensive spectrum rates positions as offense-first through defense-first. (It’s more nuanced, having to do with the availability of talent, but that’s not important here.) DHs, obviously, are asked only to hit, not to field. On the other end of the spectrum, players like Clint Barmes and Jose Molina get paid for the glove, not their bat.

For each position, I looked at their relative hitting (measured by OPS+, the only relative metric I could find with positional splits going back to the implementation of the DH). Obviously, overall offense increased across baseball during the Steroid Era. That’s not at issue. Rather, I’m looking for the contours of the increase: Did some types of players benefit more than others? That’s the beauty of relative statistics. Since they average to 100 overall, they’re effectively a zero-sum game. In pretty much identical playing time, Justin Upton’s OPS+ improved from 124 in 2013 to 132 in 2014. That means that the rest of his league, in aggregate, lost 8 points of OPS+ over Upton’s 642 or so plate appearances from 2013 to 2014. Taking that logic to positions, if one position goes up, as the DHs did from 1994 to 2007, another position has to go down.

I compared three ranges of seasons:

  • The Steroid Era; fourteen years from 1994 to 2007
  • The fourteen prior seasons, 1980-1993
  • The seven seasons since

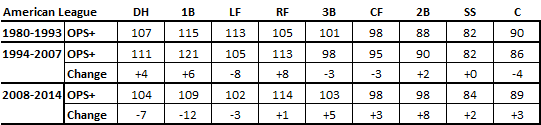
If, as Jon L. suggests, the Steroid Era disproportionately helped sluggers, we’d expect to see OPS+ rise for the left end of the spectrum and fall for the right end. If, as I contended, the increase in DH productivity was more due to the influx of very skilled hitters in the DH role (Edgar Martinez, David Ortiz, Travis Hafner, and others) than something systematic, the change in OPS+ among positions would be pretty random. Here are the American League results (source for all tables: baseball-reference.com):

It turns out that other than a somewhat idiosyncratic drop in production among left fielders (Rickey Henderson’s best years were before 1994, while left fielders Jim Rice, George Bell, and Brian Downing were all high-OPS stars of the 1980s), Jon L.’s hypothesis looks correct. Collectively, DHs, first basemen, and corner outfielders added ten points of OPS+ during the Steroid Era (two-three per position) while center fielders and infielders lost eight points (two per position – totals don’t sum to zero due to rounding). After 2007, the hitters’ positions lost 21 points of OPS+ (five per position) while the fielders’ positions picked up 21 (four per position).

Again, these are relative changes. American League center fielders batted .267/.330/.401 from 1980 to 1993, an OPS of .731. They hit .273/.339/.423 from 1994 to 2007, an OPS of .762. Their absolute numbers improved. But relative to the league, they declined. Offensive performance shifted away from glove positions to bat positions in the American League during the Steroid Era, and back toward the glove guys thereafter.

What’s an increase of two or three points of OPS+, as occurred for DHs from 1994-2007, worth? In the current environment, it’s about 14-20 points of OPS. That’s about the difference in 2014 between Indians teammates Yan Gomes (122 OPS+) and Lonnie Chisenhall (120 OPS+), or Royals teammates Eric Hosmer (98) and Billy Butler (95), or Twins teammates Trevor Plouffe (110) and Joe Mauer (107). (Man, it must be tough to be a Twins fan.)

So what does this mean? Maybe PEDs worked better for sluggers than for fielders, i.e., maybe they boosted sluggers’ batting skills more than other players’. Maybe sluggers took more drugs. I don’t know, and I really don’t care–as I said, I’m tired of the PED talk. But to swing back to Jon L.’s comments on my piece, I think I was too glib in attributing the increased relative performance by DHs from 1994 to 2007 to players and strategy alone. Looks like chemicals may have played a role.

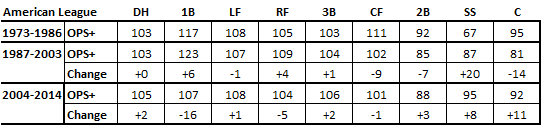
But wait, I’m not done. I mentioned the lack of definition of the Steroid Era. If I use the Neyer/Sarris starting point of 1987 and the last pre-testing season of 2003 as an endpoint, things change a bit. Stretching out the definitions of the eras to 1973-1986 as pre-steroids and 2004-present as post-steroids, here’s what I get:

That’s not as dramatic. Yes, there’s still a shift in OPS+ from the five positions on the right of the defensive spectrum to the four on the left during the Steroid Era, and back again thereafter. But it’s smaller and much less uniform. DHs and left fielders have actually done a bit better since the end of the differently-defined Steroid Era. That’s less compelling.

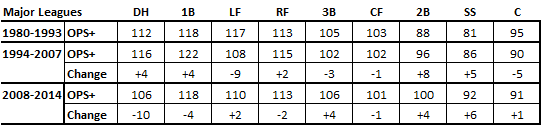
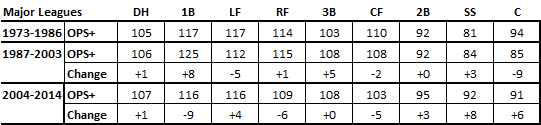
And the Steroid Era didn’t affect just the American League, of course. Of the 24 player-seasons between 1990 and 2007 in which a player hit 50+ home runs, half the players were in the National League (12 and a third, given that Mark McGwire split time in 1997 between Oakland and St. Louis en route to 58 homers), including all seven seasons of 58+ (seven and a third including McGwire’s 1997). And if you throw the NL into the mix the relationship breaks down more, regardless of how you define the Steroid Era, looking more random than systematic:

The shift of offense to bat-first positions during the Steroid Era is much less pronounced when looking at the two leagues combined, If there were an incontrovertible trend, we’d see plus signs for DHs, first basemen, and corner outfielders in the Steroid Era and minus signs thereafter, and the opposite for infielders and center fielders. That’s not the case.

So while the data aren’t altogether compelling, I’ll concede Jon L.’s point: The Steroid (or PED, or Selig) Era didn’t just boost offenses overall, it changed the contour of offensive performance, shifting some production away from the glove-first positions to the bat-first positions. There was an uptick not only in offensive performance as a whole, but particularly in offensive performance generated designated hitters, first basemen, and corner outfielders. However, the magnitude of the effect is dependent on the league and the years chosen, which indicates that it’s not strong. So I’m sticking with my view that there was an unusual concentration of talent playing DH from the mid-1990s to the mid-2000s. Designated hitters generated more offense, both absolutely and relatively, from 1994 to 2007 than in any other period. The underlying reason may be partly the Steroid Era, but we can say that those years were also the Edgar Martinez era.


The Ghosts of Designated Hitters Past and Designated Hitters Yet to Come

Among the flurry of deals announced over the past month and a half, a couple raised eyebrows:

(That’s how the transactions were listed on mlb.com. I have no idea why Billy Butler, who started 108 games at DH in 2014 and 35 at first base, is listed as a DH, but Kendrys Morales, who started 71 games at DH and 26 at first, is listed as a first baseman.)

The logic behind these signings made sense superficially: The A’s signed Butler, who was the Royals’ DH in 2014, because Oakland DHs hit a middle-infielder-esque .215/.294/.343 last year. The Royals signed Morales to take Butler’s place. What was a little more surprising was the money: three years for $30 million for Butler, two years for $15.5 million plus an $11 million mutual option/$1.5 million buyout in 2017 for Morales.

The reason that’s surprising is that both were below-average hitters in 2014. Butler had a wRC+ of 79 as a DH, while Morales’s was 62. Among the eleven players with at least 200 plate appearances at DH last season, Morales’s wRC+ ranked eleventh and Butler’s ninth.

That’s the thing about designated hitters: They play the ultimate You had one job… position. All they’re supposed to do is hit. There will never be a Derek-versus-Ozzie, bat-versus-glove debate about DHs. They’re all bat. And while wRC+ doesn’t encompass baserunning contributions, DHs are generally plodders like Butler, who went from first to third on a single only once in 31 opportunities last year, so that doesn’t differentiate them. (There have been only 12 seasons in which a player’s gotten more than 15 stolen bases as a DH, and five of those were by one guy, Paul Molitor.)

(Another DH fun fact: The American League adopted the designated hitter after the 1972 season, when the league batted .239/.306/.343, equating to a .297 wOBA. The worst season since then? 2014: .253/.316/.390, .312 wOBA.)

Designated hitters are paid to hit, not to field and run. So why do DHs who are below-average hitters stay on rosters, much less sign multi-year free agent contracts? Before I try to answer that, here’s another tidbit about designated hitters. This is a list of the number of American League players, by position, who qualified for the batting championship last year (i.e., 502 plate appearances):

  • Catchers: 1
  • First basemen: 4
  • Second basemen: 8
  • Shortstops: 9
  • Third basemen: 7
  • Left fielders: 5
  • Center fielders: 7
  • Right fielders: 5
  • Designated hitters: 1

Salvador Perez was the only player to amass 502 plate appearances as a catcher. That’s understandable, given the demands of the position. But why was David Ortiz the only player to get 502 plate appearances as a DH? It’s clearly not the physical strain of being a designated hitter. So let’s lower the bar a bit and count the number of players, by position, to get 400 plate appearances–regulars, if not batting title qualifiers:

  • Catchers: 9
  • First basemen: 10
  • Second baseman: 11
  • Shortstops: 11
  • Third basemen: 11
  • Left fielders: 7
  • Center fielders: 10
  • Right fielders: 7
  • Designate hitters: 4

Yikes. That makes it look even worse. There were fewer regular designated hitters than there were regulars at any other position. Has this always been the case: unremarkable hitters who aren’t even regulars?

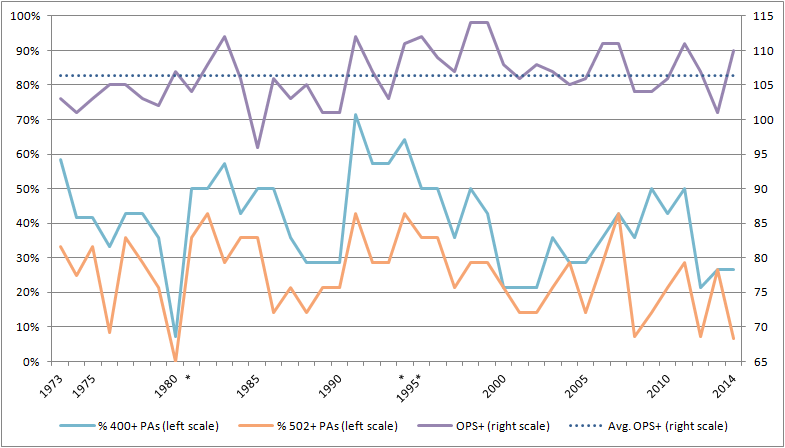
To answer this question, the chart below shows, for every season since the advent of the DH in 1973, the percentage of teams with a DH with 502 plate appearances, the percentage with a DH with 400 plate appearances, and the aggregate OPS+ for all DHs. (I chose the percentage of teams, rather than the the number of DHs, to account for the increase in American League teams from 12 in 1973 to 14 in 1976 and 15 in 2013. And I used OPS+ because that’s the only relative  metric I could find with splits data going all the back to 1973.)

*Strike-shortened year; playing time data prorated.
Source: baseball-reference.com, using the Play Index Split Finder.

As you can see, there were roughly three eras for DHs:

  • 1973-1993: Teams trying to figure out how to optimize the position, with playing time and performance fluctuating, including a nadir of a 96 OPS+ in 1985
  • 1994-2007: Slightly fewer regular DHs but the position generating the most offense in its 42-year history
  • 2008-2014: Reduced offense and sharply fewer full-time DHs

Let’s examine those three eras in detail. When the DH was first implemented, American League teams relied heavily on aging sluggers. From 1973 to 1976, the DHs with the most plate appearances were Tommy Davis (in his age 34-37 seasons), Tony Oliva (34-37), Frank Robinson (37-40), Deron Johnson (34-37), Willie Horton (30-33), and Rico Carty (33-36).

This began to shift with Hal McRae, whom the Royals acquired via a trade with the Reds at the end of the 1972 season, when he was 27. He started 134 games at DH in 1973-75, and was a full-time DH for the remainder of his career. He received MVP votes in four seasons. In 1978, 29-year-old Angel Don Baylor finished seventh in the MVP vote, primarily as a DH (102 starts at DH, 56 in the field) and he won the MVP the next year starting 97 games in the outfield and 65 at DH. There were still plenty of old DHs by the late 1970s — Horton was 36 in 1979 when he became one of only two DHs in history to play 162 games at the position — but it wasn’t the exclusive province of old guys.

Still, there were variations in play. The year 1980 is the only non-strike-shortened season in which no DH qualified for the batting title, and that was largely because of a changing of the guard: Carty retired, Lee May and Mitchell Page neared the end of their careers, Horton played his last season, and Rusty Staub inexplicably got 40% of his plate appearances as a 1B/OF.

As you can see by the chart, the performance of DHs took off after 1993, a year during which four former MVPs and/or future Hall of Famers provided 400+ plate appearances of subpar performance as a DH: George Brett (.265/.311/.431, 95 OPS+), Andre Dawson (.266/.308/.432, 94 OPS+), Dave Winfield (.258/.313/.406, 90 OPS+), and George Bell (.217/.243/.363, 59 OPS+). Brett, 40, and Bell, 33, were in their last seasons, while Winfield, 41, and Dawson, 38, were in their last years as regulars.

That led to another changing of the guard in 1994, and fourteen straight years in which DH OPS+ was 105 or higher, accounting for half of the 28 such seasons in the DH’s 42-year history. Of the nine seasons during which DHs had a combined OPS+ greater than 110, six occurred during 1994-2007. This was the heyday of Edgar Martinez, the greatest DH, of course, but Ortiz (4), Chili Davis (3), Travis Hafner (3), Frank Thomas (3), Ellis Burks (2),  Jose Canseco (2), Juan Gonzalez (2), and Jim Thome (2) all had multiple seasons with an OPS+ of 125 or more as a regular DH during those years.

(I know what you’re thinking: Hmm, 1994 to 2007: PEDs. Yes, but the statistics I’ve used throughout this analysis — wRC+ and OPS+ — are relative figures. The league average, every year, is 100. When DHs compiled a 114 OPS+ in 1998-99, it meant they were 14% better than the inflated averages of the time, a level never attained before or since. So unless there’s some reason DHs were more chemically enhanced, or benefited more from such enhancement, than other players, it’s not a PED thing. And no, it’s not because of the alleged career-prolonging properties of PEDs, as only five of the 21 seasons of OPS+ over 124 cited above were amassed by players older than 35. Nine of the player-seasons were compiled by hitters in their 20s, and five occurred in 2006 and 2007, after the implementation of MLB’s drug policy.)

That brings us 2008-2014. The average OPS+, which was 104 in the 1973-93 period and 109 during 1994-2007 has receded to 106 over the past seven seasons. More strikingly, while the percentage of teams employing a full-time DH (400+ plate appearances) has declined steadily, from 43% in the first 21 years to 38% in the next 14 to 36% in the past seven, the percentage qualifying for the batting title has nosedived, from 27% over the first 35 years of the DH to 16% in the seven years since. In 2008, Thome was the only player who qualified for the batting title as a DH, as was Butler in 2012 and Ortiz in 2014. Prior to those seasons, the only times that happened were in the nascent DH seasons of 1980 (noted above) and 1976 (Carty).

So what’s happening now, and how might it inform the Butler and Morales contracts? I think that the decline in DH performance relative to the league and the decline of full-time DHs are related, because they both stem from the construction of pitching staffs in general, and the modern bullpen in particular. In 1973, the first year of the DH, teams commonly carried 10-11 pitchers on their 25-man rosters. Now they usually have 12, sometimes as many as 13. That leaves less room for a full-time player who can’t play in the field and more need for positional flexibility. As Dave Cameron wrote nearly five years ago:

Teams are choosing to increase their flexibility, even if it comes at the expense of some production. Increasingly, teams want the option to use the DH spot as a pseudo off day for their regulars, or as a fall back plan if their banged-up position player is unable to acceptably field his position. With the move towards 12 man pitching staffs, limited bench sizes put a premium on roster flexibility, and teams are reacting by devaluing players who can’t play the field.

In 2014, eight players played at least 15 games at DH (the extreme right side of the defensive spectrum) and 15 games at catcher, second base, or shortstop (the extreme left side). Breaking that combination down by the eras I defined above, it works out to:

  • 1973-1993: 91 occurrences, or 4.3 players per season
  • 1994-2007: 50 occurrences, or 3.6 players per season
  • 2008-2014: 42 occurrences, or 6.0 players per season

Positional flexibility allows teams to get maximum utility from scarce roster spots, but it doesn’t boost batting by DHs. The eight players in 2014 who played at least 15 games at second, short, or catcher as well as DH were J.P. Arencibia (64 wRC+), Alberto Callaspo (68 wRC+), Logan Forsythe (80 wRC+), John Jaso (121 wRC+), Derek Jeter (73 wRC+), Josmil Pinto (101 wRC+), Dioner Navarro (98 wRC+), and Sean Rodriguez (99 wRC+): One good hitter, three average hitters, and four lousy ones. That doesn’t help the aggregate numbers for designated hitters. Add to that the “DH Penalty,” i.e. the observation that hitters tend to perform worse at DH than when playing in the field — which Mitchel Lichtman calculates in this article to be about 14 points in wOBA — and we can expect increased positional flexibility to erode the offensive contributions of designated hitters.* Jaso, an extreme example, hit .298/.362/.488 in 50 games as a catcher but only .208/.293/.296 in 35 games as a DH.

The DH will remain an offensive position, obviously. And there are obvious risks in drawing conclusions based on just the past seven seasons of data, which admittedly include three above-average years for DHs in aggregate. But given modern roster construction, it’s hard to see DHs consistently generating an outsized contribution to offense as they did in years past. That doesn’t make the below-average performance of Butler and Morales tolerable, but it does make it less of an outlier than it would’ve been previously.


*Lichtman’s data indicate that position players who sometimes were DHs didn’t suffer a greater DH penalty than players like Ortiz or Butler, who rarely play in the field. But as he stated in the above-cited article,

I expected that the penalty would be greater for position players who occasionally DH’d rather than DH’s who occasionally played in the field. That turned out not to be the case, but given the relatively small sample sizes, the true values could very well be different.


Brian McCann’s Move to the AL East

This article was inspired by the phenomenal work on 2013 shift data at THT by Jeff Zimmerman:
http://www.hardballtimes.com/expanded-2013-infield-shift-data/

Brian McCann’s 5 year 85MM signing by the Yankees has been noted as a pretty good deal as far as Free Agent contracts go. I do not necessarily disagree since he brings leadership and not wholly quantifiable defensive contributions as a marquee catcher. He posted an ISO above the .200 mark in 2013 for the first time since 2009 and reached 20HR for the 7th time in 8 seasons despite only playing in 102 games due to injury. His generally above average OBP rebounded from a career low .300 in 2012 to .336. His heinous .234 babip from 2012 regressed upward somewhat back to .261. While there are many outward signs that his 2013 bounce back re-established him as a premier offensive contributor (122 wRC+) there are some other numbers that give me pause about his future in New York.

I found Jeff Zimmerman’s 2013 infield shift data article fascinating in so many different ways but one of the major takeaways that I got from it was the disparity of shifting frequency across MLB divisions. Granted, a division with more extreme ground ball pulling shift candidates may lead to more shifts. However, the league leading Orioles had 470 shifts implemented on ball in play events compared to just 473 shifts in the ENTIRE NL EAST in 2013 (108 of those 473 NL East shifts were implemented by the Braves). Overall there were 1800 ball in play shift events in the AL East in 2013 compared to 473 shifts in the NL East. 11 of the top 15 shifting teams in 2013 MLB were AL clubs. (AL East teams are #’s 1,2,6,8,16 overall in # of 2013 shifts)

This is where Mr. McCann and his offensive future comes in: Brian McCann hit into 123 shifts out of 402 PA (30% of PA) in 2013. He hit .179 on balls in play against the shift and .299 when the shift was not on. For comparison David Ortiz hit into 338 shifts in 2013 in 600 PA (56% of PA). Obviously there are smaller than ideal samples in this data and we all know babip fluctuates wildly. That being said the shift deflated McCann’s babip to some degree unquestionably last season and probably has been doing so for a while (I’d love to see this data for 2012, 2011 etc. broken out by batter).

If generally shift-conservative NL East teams were exploiting this aspect of McCann’s game then you can bet he’ll see even more shifts in the shift-happy AL East and across the AL in general. McCann’s GB/FB distribution has stayed slanted toward FB throughout his career around a 0.88 ratio. He has seen his babip decline like most MLB veterans do post-peak. There’s a good chance that his babip will continue to decline and perhaps quite precipitously upon his move to the AL East.

I’ll end this article with an intentionally scary and possibly not totally fair comparison since it’s a strictly left handed hitter compared to a switch hitter: McCann’s career line is .277/.350/.473 with a .289 babip and 0.88 GB/FB ratio. Mark Teixeira’s Left Handed Hitting career line is .267/.359/.518 with a .277 babip and 0.87 GB/FB ratio. If McCann’s batting average/babip were to decline at a similarly faster than normal rate like Teixeira’s I’d blame those shifty AL rivals. The short porch in New York may create some extra HRs but the AL East defensive environment could take those gains away and then some on balls in play.

It will be interesting to compare the 2014 shift data to the 2013 season and see which teams decided to implement the shift more and less frequently. The caveat must also be mentioned that not all shifts are created equal and some teams were much more effective at converting shift balls in play into outs than others. Does that have to do with superior personnel/positioning?

Thanks again to Jeff Zimmerman for the inspired shift research that made this piece possible.