Archive for Boston Red Sox

The Red Sox Evolve their Swings In-Game and the Results Are Incredible

The Boston Red Sox almost romantic approach to the plate has been one of the major themes on their journey to be the first team with 60 wins. Last night’s expose of producing home runs and precise batting behind Chris Sale’s robotic approach to pitching gave the Red Sox a 10-5 victory over Kansas City Royals for their 60th victory; another notch in a long-chain of accomplishments. More impressively, however, is the Red Sox micro approach to each game. They have not only revolutionized the average statistics played out through the tenure of a season but have revolutionized how they approach the plate inning-by-inning. The romantic plate approach is more than good batting – it is the beginning to a methodical introspection into opposing pitchers for an evolution in innings five and six.

In an interview with 710 ESPN Seattle’s Danny, Dave, and Moore, Seattle Mariners pitcher Marco Gonzales casually remarked of his struggles against the Red Sox on June 24 that they were “taking swings we haven’t seen before.” Gonzales lasted only six innings against the Red Sox, allowing seven hits and five runs on six strikeouts. The fifth inning was the instant the game changed in the Red Sox favor as they scored three.

Naturally, this observation may have been a microcosm dependent on Gonzales’ pitching, not so much the Red Sox. Yet, the observation was enticing enough to warrant investigation. The results were incredible, explaining why the Red Sox meta of plate patience is about more than being disciplined – they pedantically study batters through the first few innings, leading to innings five and six which are destructive.

Before delving into the data, two notations must be established. First, the Red Sox are, on average, destructive regardless of the inning. Their jump in innings five and six are not why they are good, but why the are atop the MLB this year. Second, analytic rise in statistics in innings five and six is a trend across the league; it might be easy to pass on the Red Sox rise as the best batters popping off on ‘third-time through the rotation’ deterioration. Again, however, the Red Sox are using the seemingly inevitable deterioration of pitchers throughout the game and exacerbating on that analytic.

Within innings one through three, the Red Sox hold a .270 batting average with a 20.5 percent strikeout rate, an 8.4 percent walk rate, a .467 SLG, and a 117 wRC+ – all rates which make the Red Sox a top MLB team intrinsically. Stopping here, the Red Sox would be a good team alone. However, as mentioned, the Red Sox jump to great in inning five and six. They post a .292 batting average, only 15.7 percent strikeouts, 7.9 percent walks, a .538 SLG (.240 ISO!), and a wRC+ of 139.

On a micro-level, the functional output has benefited Mitch Moreland and Mookie Betts the most; Moreland has a .808 SLG and Betts has a 234 wRC+. Even Rafeal Devers has a sharp increase in effectiveness in these innings, raising his egregious .198 average from innings one through three to a .304 average in innings five and six.

Mechanically, the Red Sox, as a team, change the type of pitches they attack. Produced from Baseball Savant, here is a graphic of the pitch movement attacked in innings one through three; here is the comparative graphic for innings five and six. The graphic shows most of the pitches they take at the beginning of the game have little horizontal movement and trend with more vertical movement – hence, pitches which are easier to see. As the game goes on, they dramatically increase their SLG by attacking pitches with sharp horizontal movement, even hitting low.

In application, it might be said the Red Sox study through the first few innings, waiting to see how pitchers will attack under the guise of movement. Their contact is more studied through this span, evidenced by J.D. Martinez’s expected SLG of .936, Bett’s of .843, and Andrew Benintendi’s of .757. Even Devers sees an increase from an xSLG of .389 to .545.

The Red Sox plate discipline is purposed, thoughtful, and intended for the length of a game and season. They literally improve the quality of swings and contact throughout the game; the maxim of why analytical discipline is important to success.


What to Expect From J.D. Martinez’s Power in Fenway

Several days ago the Boston Red Sox acquired J.D. Martinez, presumably under the expectation of adding a lot of power to the lineup. Since 2015, he’s eighth in home runs with 105, a league-best .284 ISO (four-thousandths of a point ahead of Nolan Arenado), and his 147 wRC+ puts him at sixth in all of Major League Baseball.

Yes, he can hit for average as well but I’m not interested in that. What I’m curious about is whether or not the famed Green Monster in Fenway Park will be a hindrance to Martinez’s power.

He’ll now be playing 82 games each season in Fenway Park, where every time he comes to bat he’ll have the Green Monster in peripheral view; a 37.2-foot high wall 310 feet down the left field line and as far away as 380 feet at left center. There are dozens of hits every year at Fenway that could have ended up as home runs in other parks, but instead, are eaten up by the Green Monster and spit back out as (extra) base hits.

To attempt to approximate the minimum required launch angle and exit velocity to hit a home run over the Monster, I needed visual proof. Using Baseball Savant, I searched all the home runs hit in Fenway Park during the Statcast era.

I keyed in on home runs specifically hit to left/left center field, spanning the entire range of that monstrosity. Using the spray chart tool, I found any and all homers that were as close to the barrier of the GM (Green Monster) as possible. I came across one that seemed to fit perfectly and cleared the wall just enough.

That’s Steven Souza, Jr. driving a home run under (nearly) perfect metrics to breach the wall.

Just to be certain that this was as close as I could get, I wanted to know what the weather conditions were that day. I was able to find the barometric pressure and how mother nature’s influence could have affected this hit, in terms of exit velocity. Air pressure matters because when its low, baseballs go further due to less friction on the baseball and vice versa.

  • Game time: 1:35 PM
  • Game Duration: 4 hours and 32 minutes
  • Approximate time HR was hit 5:00PM
  • Conditions at time of HR: 50 degrees, light rain, wind blowing NW at roughly 16 MPH with gusts up to 27 MPH
  • Game barometric pressure: A consistent 29 inches

OK, so what jumps out at you? Wind speed, right? All Fenway Park’s contact to left (center) head in a northerly direction. The low barometric pressure and wind speeds give me two possible caveats for this examination.

However, as you see in the GIF, the trajectory was fairly high and it cleared the wall by a couple of feet. It’s impossible to tell if the wind was blowing (and how hard) during Souza’s homer, so keep those things in mind since they are variables that don’t make this investigation exact when applying it to Martinez.

Souza’s hit metrics on that homer were as follows:

  • Breaking ball at 80 MPH
  • 93 MPH exit velocity
  • 33.5-degree launch angle
  • Hit distance of 344 feet

We can use those measurements to get a guesstimate of what Martinez could or would have done hitting regularly in Boston. I produced the following spray chart using his last three seasons under the backdrop of Fenway Park.


J.D. Martinez(2)

Clearly he’s able to hit to all fields; you could suggest that a fair amount of his hard contact is concentrated in the area of the GM and that’s what I’m going to hone in on. Yet with the height of the wall, some of those home runs (hit in other ballparks) could have been inhibited.

I inspected all Martinez’s home runs since 2015, shifted focus to the launch angle and exit velocity using the Souza home run as my model, and ran a query of all his contact using the metrics it would take to clear the wall.

I set the minimum launch angle to 30 degrees, to give a little breathing room because it appears as though Souza’s homer cleared the wall by a foot or two; I did the same for exit velocity, starting it at 90 MPH. For minimum hit projection range, I used the shortest distance to the GM; 310 feet.

Breaking it down even further, I ensured that homers hit to left center had ample room and momentum to clear the wall; e.g. the 310-foot distance wouldn’t work for a ball he actually hit to left center, for example.

Altogether, Martinez had a total of 121 batted ball events under the conditions of my launch angle/exit velocity/distance figures. 24 of those 121 BBEs resulted in contact to left field; 11 would have ended up being GM-clearing home runs if hit in Fenway, but instead were recorded as outs.

So, taking events strictly within the region of left to left-center field in Fenway, Martinez could be expected to hit about 43% more home runs facing the GM over the next three years of his contract.

Remember, that doesn’t include contact to other parts of the field. If you look back to the spray chart, you’ll see several spots marked home runs that would fall short in Fenway.

Furthermore, using his home run total from 2015-2017, we could reasonably surmise that he’ll hit an average of about 35 home runs for the next couple of years. Adding in these 11 outs as home runs, Martinez will be expected to hit roughly 9% more home runs (3 per season) at Fenway, so long as he is a Red Sox.

So, the monster won’t be as problematic as I originally assumed upon hearing of this acquisition for Boston; it might actually improve Martinez’s power.

-This post and others like it can be found over at The Junkball Daily.


J.D. Martinez Will Be Productive in Six Years (And Maybe Seven)

While baseball fans wait for the free agent market to finally unthaw, J.D. Martinez waits for a contract offer enticing enough for him to sign. Early reports suggested that Martinez and his agent, Scott Boras, set an early asking price at seven years, $210 million. Clearly, nobody has taken the bait. Among Martinez’ likely suitors, many have moved onto other options; the Cardinals traded for Marcell Ozuna, and the Giants traded for Andrew McCutchen, seemingly leaving the Red Sox as Martinez’ lone serious suitor.

The latest report, from Buster Olney, is that Martinez has an offer on the table from the Red Sox worth five years, $100 million. Taking the reports at face value (although Boras himself has simply declared the report “inaccurate”), the offer obviously comes up short of Martinez’ demands, which is why this article is being written in late January to begin with. To that end, here’s an excerpt from Jeff Passan’s recent column at Yahoo Sports on baseball’s economic system:

“Recently, one of the best free agents available this offseason met with a friend, and he admitted something shocking: He was preparing to sit out until the middle of the season. The market for his services this winter was so thin, the offers so incompatible with his production, that he worried he was going to need an external force to compel teams to pay him what his numbers say he’s worth. Maybe it would take a playoff race.”

Can we assume that the hitter in question is Martinez? Of course not, but considering the discrepancy between his asking price and the reported Red Sox offer, it wouldn’t be an outlandish guess. While I understand that the Red Sox have leverage in that they presumably don’t have anyone to bid against, I will argue that Martinez will be well worth a contract in excess of 5/$100M.

From 2014-2017, his Age 26 through  Age 29 seasons, Martinez posted an astounding 149 OPS+ (my apologies for not using wRC+ in this column!), with a low of 139 and a high of 166. To that end, I researched players from the DH era (circa 1973) that posted an OPS+ between 140 and 160 in their Age 26 through Age 29 seasons. Presumably, these players would make for suitable Martinez comps as we attempt to project his offensive production over the next five to seven years. Of course, some of these players are still active and haven’t played enough to give me complete data, such as Ryan Braun, so they have been eliminated from the dataset. I was left with 38 comparable players, which is a large enough sample for our purposes today.

In this chart, I condensed the sample into averages because 40 rows and 9 columns doesn’t embed so cleanly. These are Martinez’s comps for their age-26 through age-29 seasons, their offensive production for the next five years (through age-34, which is Martinez’ floor value at this point) and then their production in the sixth and seventh following years (ages 35 and 36, which represent Martinez’ ceiling value at this point).

J.D. Martinez Age 26-29 Comps Through Age 30-34, 35, and 36
Age Average OPS+ Average PA/Season Sample Size
26-30 147 637 38
30-34 134 559 38
35 124 512 36
36 117 447 33

The average player from my sample posted a 147 OPS+ in their age-26 through 29 seasons, which matches up neatly with Martinez’ 149 mark. You’ll first notice the drop off in production for these players in their age-30 through 34 seasons. There are several reasons for this. Yes, natural decline was at work, but the original search for Martinez comps included a 2000 plate appearance minimum; this means I was guaranteed to be given players both as good and as healthy as Martinez in their Age 26-29 seasons without the same guarantee they would be healthy in the years that followed. This also means players like Mark McGwire (146 OPS+ in 1913 PA) were excluded from the sample because he was injured, despite the 189 OPS+ he would put up in 3462 plate appearances through Age 36.

Nevertheless, it’s a reasonable regression one can expect for players entering their 30s, and the good news is that they were, on average, very productive (134 OPS+) and very healthy (559 PA). This is what the Red Sox believe to be worth 5/$100M, but I would argue that this data shows they should be willing to tack on a sixth year without blinking. Of the original 38 player sample, 36 players played their age-35 seasons; they were still very productive (Khris Davis has been producing along these lines the past two years) and healthy enough to play a full season.

The real question surrounding Martinez is – or at least should be, if the market weren’t so cold – whether he should be given a seventh year or not. From his comps, the sample size drops significantly for the first time down to 33, the average playing time falls below the league qualifying minimum for the first time, and the production drops below what you’d want from your DH (the reference point here would be Miguel Sano from the last couple of seasons).

At face value, I would absolutely give Martinez the sixth year, and absolutely not give him the seventh. At the same time, we should dive into our sample a little deeper and discover why some players did well and why others tanked in their 30s; perhaps there is something we can correlate with Martinez so we can get an even better projection. From the original sample, here are the twenty best performers in their age-36 seasons (based on a combination of plate appearances and OPS+).

Twenty Age-36 Producers
Rank Player OPS+ PA Rank Player OPS+ PA
1 Rafael Palmeiro 141 714 11 George Brett 123 528
2 Mike Schmidt 153 657 12 Robin Yount 102 629
3 Dave Winfield 159 631 13 Wade Boggs 142 434
4 Chipper Jones 176 534 14 George Foster 121 504
5 Carlos Delgado 128 686 15 Brian Giles 110 552
6 Jim Thome 150 536 16 Dave Parker 92 647
7 Bobby Abreu 118 667 17 Alex Rodriguez 111 529
8 Fred McGriff 110 664 18 Vladimir Guerrero 98 590
9 Eddie Murray 115 625 19 Ken Griffey 99 472
10 David Ortiz 173 383 20 Bernie Williams 85 546
Average 140 610   Average 107 543

The reason I picked the twenty best rather than the top and bottom ten is that the bottom ten would be littered with folks such as Cliff Floyd or Dale Murphy, who only came to the plate 17 and 63 times respectively during their age-36 seasons. Using the ten best players captures those who were magnificent offensive performers with full playing time. Using the next ten players captures those who were mediocre in full playing time. This looks good to me.

This would be the time for me to explain why I haven’t mentioned WAR in this piece: J.D. Martinez has been horrible on defense!

He was best suited as a DH years ago, but being on a roster with Victor Martinez and then being traded to the National League forced him to play right field, which depressed his value. If Boston signs him, he’ll see absolutely no time in an outfield that will be covered by Jackie Bradley, Mookie Betts, and Andrew Benintendi for the foreseeable future. As a DH for the rest of his career, Martinez will be solely judged by his offensive production and ability to stay on the field.

Again, our question is whether Martinez receiving a seventh year is justified. More specifically, this boils down to “In seven years, will Martinez be in the left column or the right column?” Both sides of the list contain incredible players, but there’s a way to make a reasonable projection. Here’s the same list, but instead of rank, you’ll see the positions these players spent significant time. Those who had significant time at 1B/DH are highlighted in gold.

Twenty Age-36 Producers (By Age)
Position Player OPS+ PA Position Player OPS+ PA
1B/DH Rafael Palmeiro 141 714 1B George Brett 123 528
3B/1B Mike Schmidt 153 657 CF Robin Yount 102 629
RF Dave Winfield 159 631 3B Wade Boggs 142 434
3B Chipper Jones 176 534 LF George Foster 121 504
1B Carlos Delgado 128 686 RF Brian Giles 110 552
DH Jim Thome 150 536 RF Dave Parker 92 647
RF/LF/DH Bobby Abreu 118 667 3B/DH Alex Rodriguez 111 529
1B Fred McGriff 110 664 DH Vladimir Guerrero 98 590
1B Eddie Murray 115 625 CF Ken Griffey 99 472
DH David Ortiz 173 383 CF/DH Bernie Williams 85 546
Average 140 610   Average 107 543

In this exercise, let’s consider 1B/DH to be significantly less stressful positions than the others. After all, there is a significant correlation between time spent in the field and sustaining an injury that leads to decline. While players like Brian Giles, Dave Parker, and Ken Griffey Jr. saw injuries and offensive decline catch up to them after years chasing down balls in the outfield, players like Rafael Palmeiro, Carlos Delgado, and Jim Thome aged extremely well by not exerting the same stress in the field.

Martinez is almost certain to spend no time in the field at Age 36. Hell, he might not spend much time in the field ever again. So I consider him a slam dunk to be placed in the group on the left. Referring to the averages from the first chart in this article, I’ll the over on Martinez when the time comes. To be clear, I donJD’t necessarily think he should be given the seventh year outright – an option would probably be most appropriate – but I think this data solidifies my comfort in giving him a sixth guaranteed year.

In a winter in which the market is changing in ways we have never seen before, it’s difficult to predict what  Martinez will earn. It’s important to remember that dollars are a construct; we can’t assume Martinez will get $150 million from the Red Sox because Adrian Gonzalez did after amassing similar numbers. Teams like the Red Sox are wary of contracts like the one given to Gonzalez, who will earn $21.5M from that deal this year. In this market (or lack thereof), it’s impossible for me to put dollars or years on Martinez, but I do know this: Martinez is a special hitter, and he’ll age especially well.

He will be a productive hitter for the next six or seven years, and there’s no dollar amount that can change that.


Alex Cobb Will Be One of the Gems of This Free Agent Class

Of the pitchers hitting the free-agent market this winter, Alex Cobb is not likely to receive the most fanfare.

Aces Yu Darvish and Jake Arrieta will command contracts north of $100 million. Closers Wade Davis and Greg Holland will do their best to secure four-year deals with big price tags. The whole world is watching every development in the Shohei Ohtani saga. Hell, among midmarket starting pitchers, MLB Trade Rumors predicts Lance Lynn to receive a more lucrative contract than Alex Cobb.

Cobb, who broke in as a full-time starter with Tampa Bay in 2012, has historically shown great promise and good-but-not-great results. He averaged 2.5 fWAR from 2012-2014, lost the next two seasons to Tommy John surgery, then came back with a 2.4 fWAR season in 2017. Cobb has never started 30 games in a season, nor has he ever thrown 200 innings. These facts are concerning to some, but I would argue that he is one of the wisest investments one can make this offseason.

Alex Cobb has evolved as a pitcher through pitch selection. Cobb has a great curveball. You either already know that, or you’re about to find out. He also mixes in a four-seam fastball, a splitter, and a sinker. Right now, curveballs are all the rage in baseball, resulting in tremendous success for pitchers like Rich Hill, Trevor Bauer, and Lance McCullers. They throw their curveballs so often that we can consider the breaking ball, not the fastball, to be their primary pitch. Like Hill, Bauer, and McCullers, Cobb has a quality breaking ball, so it stands to reason he should throw it more often and perhaps eschew his mediocre offerings. With Brooks Baseball, we can track the usage rate on each of his pitches throughout the season.

Look at the first couple data points for the usage rates on his pitches, and then compare them to his points at the end of the season. It’s clear that Cobb began to realize he works best by using the fastball and the curveball exclusively, so he increased his usage rate on those pitches and gradually phased out the splitter and sinker.

The question for Cobb is whether this was a good idea. In Cobb’s career, he’s only posted a strikeout-to-walk percentage (K-BB%) above 15% twice, and only ever so slightly so. He’s not bad in that regard, but it’s not where he makes his bread and butter. Fortunately for Cobb, he is one of the better pitchers in the league at inducing ground balls, which we know is favorable contact. The more grounders Cobb induces, the better he gets, and his curveball is a ground-ball machine. Consider the correlation between the rate at which Cobb increased his curveball usage and his ground-ball rate (GB%) throughout the season:

That’s a pretty strong correlation. It seems that Cobb is ready to join the Hills, Bauers, and McCullerses of the world and ride a high breaking-ball-usage rate to breakout success. Of course, it’s never going to be that easy for Cobb or anybody, but let’s go through one of his starts and parse what we can from the good and bad.

On September 4, Cobb pitched against a red-hot Minnesota Twins lineup and had one of his better starts of the season. His first batter of the game was second-half monster and fly-ball connoisseur Brian Dozier, and he managed to get him out on the first pitch.

It’s been proven that batters from the “fly-ball revolution” can be neutralized if you throw them high fastballs. These hitters are swinging up to lift the ball, but it’s difficult to put much lift on a high pitch coming in fast.

We’re going to focus on the curveball throughout this piece, but here is a fun fact about his fastball. Cobb’s heater sits at 92 MPH and had a spin rate of 2101 RPM this season, which seems pretty pedestrian. However, among starting pitchers with at least 100 batted-ball events involving fastballs, Alex Cobb’s has the 31st lowest exit velocity (87.1 MPH). To put this in perspective, that’s a better mark than James Paxton, Chris Sale, Max Scherzer, Jon Gray, Justin Verlander, and Luis Severino.

Cobb was smart to bait Dozier here, and he reaped the benefits with a first-pitch out to begin the ballgame.

In the second inning, we see Cobb pitching out of the stretch and unleashing a curveball that Ehire Adrianza buries into the ground. This will be the common theme today.

I mentioned earlier that Cobb doesn’t have the K-BB% of Chris Sale or Corey Kluber, so every once in awhile he walks batters. The common thought is that Cobb, who throws so many breaking balls, might end up behind in the count thanks to misplaced curves. Then, to get back in the count, he throws his 93 MPH fastball in the zone, which gets crushed by every hitter expecting it.

This would be a bad habit for Cobb to fall into, but he certainly didn’t in 2017. Consider the list of pitchers who threw the most curveballs while behind in the count this season (via Baseball Savant):There’s Cobb, in fifth place, not far behind Rich Hill himself. All five of these guys have great curveballs, so it makes sense for them to Trust the Process™ and continue dropping the hammer rather than submitting to doom and throwing a predictable fastball in the zone.

After walking the leadoff batter to start the third inning, Cobb knew Joe Mauer could make him pay. So rather than giving Mauer the fastball he wanted, Cobb began the at-bat by dropping a curveball for a strike that even froze the great Mauer.

This changed the whole at-bat, because now Mauer didn’t know whether Cobb would be coming at him with the curve or the fastball. Cobb took advantage of his opportunity, used the fastball to get him in an ideal 1-2 count, and then he went back the curveball and got Mauer to ground into a double play.

Cobb is comfortable throwing the curveball both behind in the count and with runners on base, so he can reap the rewards and induce quite a few double plays. That is an asset. Additionally, Cobb is comfortable throwing his curve from both the stretch (as we saw against Adrianza and Mauer) and from his big windup, as you can see here.

Eddie Rosario is a good hitter who made great strides late in the season, but even he found himself to be another ground-ball victim of Cobb’s curveball.

By the fifth inning, Cobb was almost through his second time against the Twins’ batting order. At this point, they weren’t sure whether to expect the curveball or the fastball, so Cobb was often ahead in the count. Here, he has Eduardo Escobar in a 1-2 count and throws a high fastball that Escobar swings right through.

Everyone in the park was expecting Cobb to throw the curveball to finish Escobar off. From a look at Escobar’s swing, it’s safe to say he was expecting a curveball himself. Cobb’s fastball isn’t necessarily anything special, but the way he uses it to pitch off the curveball can be.

With two outs in the inning, Cobb faced his 18th batter (which would complete his second time through against the opposing batting order). He quickly got Ehire Adrianza into an 0-2 count and then unleashed his best curveball of the night, which Adrianza pounded into the ground for another easy out.

At this point, Cobb had gone through the opposing order twice, pitched five innings, and only given up one run. Teams around the league are beginning to realize that most of their starters simply shouldn’t go out for the third time through the order, even if they are rolling. The Houston Astros just rode using Lance McCullers, Brad Peacock, and Charlie Morton in tandems all the way to the World Series. Those three guys are valuable pieces, and if Cobb is utilized liked this, so is he.

Unfortunately for Cobb, his pitch count was at 85, so his manager decided to bring him out for another inning. The Twins got their third look at Cobb, and I don’t need to cite the statistics to you about what happens at this point. Hitters are smart, so they can pick up on the tendencies of a pitcher if they see him so many times. Alex Cobb, as great at he was through five innings and two times through the order, is no exception to this rule.

Here is Joe Mauer taking an 0-2 curveball from Cobb and driving it into the gap in center for a double.

The important question here is, “was that Cobb’s fault or just a good piece of hitting from Joe Mauer?” Of course, the answer in baseball is always going to be both, but you can see in the embedded GIF that Cobb doesn’t necessarily leave the pitch up. In fact, if you compare it to the curveball that Cobb threw earlier in the game to get Mauer to ground into a double play, it doesn’t look much different — maybe an inch or two higher, at worst. The bigger change is Mauer, who swings like a guy fighting to stay alive in the first GIF, then like he knew exactly what was coming and how to handle it in the second.

This is the “third time through the order” effect in a microcosm. Pitches that fool batters earlier in the game become cookies, so the key is to relieve your pitcher while his pitches still fool the batters. Cobb should not be penalized by us for giving up a double to Mauer there; in 2018, analytical teams will be bringing in a new pitcher in these situations.

In this sense, Cobb is the first free-agent test case for the newest pitching trend in the industry — the tandem starter — one who pitches twice through the order, hopefully gets 15-18 outs, and then gives way to someone else. The Mets, who hired progressive Indians pitching coach Mickey Callaway to be their new manager, have made it clear that all starters not named deGrom or Syndergaard will be shielded from facing lineups more than twice in a game. Baseball has never experienced a shortage of five-inning pitchers in its history, but these changes in pitcher usage are leading to new premiums for these specialists.

It’s as simple as this: every team wants to stock their pitching staff with Alex Cobbs. To be clear, every team wants a Justin Verlander, but there is only one Justin Verlander; even horses Chris Sale and Corey Kluber showed significant wear and tear in October. To combat this dilemma, the Houston Astros deployed Lance McCullers, Brad Peacock, and Charlie Morton in five-inning tandems and rode them all the way to the last out of Game 7.

I expect Alex Cobb will fit into this role quite nicely for whichever team he signs with.


Measuring Offensive Efficiency

Runs Created was one the first sabermetric statistics I took it upon myself to learn about.  After all, it was one of the first statistics developed by Bill James himself.  I am also pretty sure RC is the formula written on a whiteboard in Moneyball (the most influential Brad Pitt movie I have ever seen).  Anyways, Runs Created is not discussed much because there are other, more sophisticated alternatives – wRC, wRC+, etc.  I still appreciate RC because of its simplicity, and it is can still be used as an effective tool for measuring the efficiency of offensive production.

That is precisely what I set out to do.  The question I sought to answer with this study is, “which teams were the most efficient in scoring runs?”  A pretty basic question — which I decided to complicate.  Using team statistics from last year, I calculated the Runs Created for each team’s offense.  The largest separation between Runs Created and actual runs scored came from the San Diego Padres, who scored 686 times, despite “creating” only 621.38 runs.

While ranking in 19th in total runs, the Padres were actually incredibly efficient. I discovered this after trying to develop a way to measure offensive efficiency.  To do so, I created the Runs Conversion Rate (RCR).  While relatively rudimentary, this ratio between runs scored and Runs Created provides, in my mind, a good measurement for the efficiency of offenses.

Run Conversion Rate = Runs Scored / Runs Created

The purpose of this, again, is to gauge the overall efficiency of offenses.  All I really did was give a fancy name to the margin of error of Runs Created.  However, what I sought to do was use this statistic in a different way — to examine which teams made the most of what they produced (efficiency), and which did not.  Think of this article as a new way of looking at an old statistic, not me trying “discover” a new stat.  Below is a table, sorted by runs scored (i.e. from most productive offenses to least productive).  Green values represent teams in the top 10 of a category, and red the bottom 10.

2016 Run Conversion Rates
TEAM Runs Created Runs Scored Run Conversion Rate
Red Sox 905.26 878 0.970
Rockies 856.84 845 0.986
Cubs 790.93 808 1.022
Cardinals 784.92 779 0.992
Indians 770.06 777 1.009
Mariners 769.39 768 0.998
Rangers 755.83 765 1.012
Nationals 752.18 763 1.014
Blue Jays 759.72 759 0.999
D-Backs 775.15 752 0.970
Tigers 791.98 750 0.947
Orioles 768.79 744 0.968
Pirates 724.74 729 1.006
Dodgers 709.32 725 1.022
Astros 727.58 724 0.995
Angels 700.20 717 1.024
Giants 725.10 715 0.986
Twins 742.03 690 0.930
Padres 621.38 686 1.104
White Sox 713.38 686 0.962
Reds 699.02 678 0.970
Royals 685.69 675 0.984
Rays 701.08 672 0.959
Brewers 694.02 671 0.967
Mets 707.39 671 0.949
Marlins 695.80 655 0.941
Athletics 655.47 653 0.996
Braves 671.35 649 0.967
Yankees 690.17 647 0.937
Phillies 617.22 610 0.988

After looking at the table, I noted a few observations to be made: teams ranked top 10 in scoring and top 10 RCR last year were, for the most part, the best teams in the league, the two highest-scoring teams did not score as many runs as they could have, and some teams capped out their production, albeit not a high level of scoring.

First, let’s look at the teams who ranked top 10 in scoring and top 10 in RCR in 2016: the World Champion Chicago Cubs, the American League Champion Cleveland Indians, the Seattle Mariners (second in AL West), the Texas Rangers (AL West Champs), the Washington Nationals (NL East Champs), and the Toronto Blue Jays (AL Wild Card).  All these teams were both productive and efficient.  Both are key indicators of good ball clubs.  They created an equal balance of the two, and, outside of the Mariners, played postseason baseball.

While the last paragraph was basically a no-brainer, this is where the study got interesting.  The Boston Red Sox scored 878 runs last year — short of their roughly 905 “created” runs.  According to their RCR, they were only 97% efficient.  So, what does this mean? The Red Sox, while more productive than anyone else, did not hit their ceiling.  They came close (RCR of 0.970), but still only ranked in the middle third of offensive efficiency.  What if the post-Ortiz Red Sox put up around the same numbers they did last year, but became more efficient in doing so?  In my opinion, the AL East should be scared.  Other teams falling into the top 10 scoring, middle 10 RCR category are the Colorado Rockies, St. Louis Cardinals, and Arizona Diamondbacks.  The Rockies certainly receive a boost in production because they played 81 games in Coors Field.  The Cardinals and Diamondbacks, like the Red Sox, scored often, but not as often as they could have.  So maybe their problem is not a low ceiling, but rather getting away from their floor troubles them.

Our third group of relatively important teams in this study are those who ranked in the middle 10 in scoring and top 10 in RCR: the Pittsburgh Pirates, Los Angeles Dodgers, the Los Angeles Angels, and the San Diego Padres.  Essentially, these offenses were middle of the road in terms of productivity, but scored as many runs as possible given their level of production.  The Angels, ranked in the bottom 10 in Runs Created by their offense in 2016, but were second in RCR, scoring 2.4% more runs than they “created.”  The only team ahead them were the lowly San Diego Padres, who turned in 10.4% more runs.  The Dodgers, who won 91 games in a comparatively weak NL West division, were middle-of-the-road in terms of offensive production, and came in third in terms of RCR.  These teams were ruthlessly efficient, milking the most out of what their offense provided.

I do not know what qualities are common in high-RCR teams.  Maybe a high average with runners in position, a low number of runners left on base, or maybe just plain luck.  That could be the topic of an entirely different study, perhaps.

To sum things up, a high RCR was a common denominator in the teams who saw great success in 2016, and I would like to think it is useful in measuring the efficiency of teams’ offenses.  It will be exciting to see who will rise in 2017 as the most potent offense.  For me, it will be just as exciting to see who is the most efficient.


FanGraphs and Baseball-Reference.com were instrumental in the production of this article.  Theodore Hooper is an undergraduate student at the University of Tennessee in Knoxville.  He can be found on LinkedIn at https://www.linkedin.com/in/theodore-hooper/ or on Twitter at @_superhooper_


Sigh of Relief Aside, Expect a Big Year From David Price

No matter what team you root for, we are all baseball fans, and as baseball fans, the game is better when David Price comes out of a visit with Dr. James Andrews in one piece. Red Sox fans held their collective breath after the (since-updated) report was released that Price was being sent to Dr. Andrews following a troubling MRI scan. Even Boston’s brass was expecting to lose Price for the year to Tommy John surgery. Of course, it is not known exactly what Price was diagnosed with, and being shut down for seven to ten days is still troubling, but while the spirits are up, let’s consider something else: David Price will be back in serious Cy Young contention this season.

To be clear, David Price was an excellent pitcher in 2016. Any team would sign up for a 4.5 fWAR pitcher, and that production alone is All-Star worthy. However, in the context of David Price’s career, 2016 qualified as an “off year.” His previous two seasons saw him post totals of 6 fWAR and 6.4 fWAR, respectively. Looking at traditional stats, his 3.99 ERA was his highest since his 128-inning rookie season. So while Price was worth every penny in 2016, it wasn’t the rosiest year of his career.

If we want to find out what was different for David Price in 2016, we won’t have to look very far.

What Went Wrong For David Price in 2016

Year HR/9 FB% HR/FB% Pull% Hard Hit%
2010 0.65 39.6% 6.5% 30.1% 25.5%
2011 0.88 36.9% 9.7% 34.4% 24.7%
2012 0.68 27.0% 10.5% 35.3% 25.6%
2013 0.77 33.4% 8.6% 34.7% 28.6%
2014 0.91 38.1% 9.7% 36.4% 28.3%
2015 0.69 36.4% 7.8% 33.3% 28.2%
2016 1.17 33.9% 13.5% 44.1% 34.8%

*all stats via FanGraphs

Starting in column two, we can see a clear-cut spike in the number of home runs he allowed. Your first thought may be that this can be explained by his having to pitch in the notoriously hitter-friendly Fenway Park, but Price has pitched nearly his entire career in the confines of the American League East and hasn’t had a homer problem until this point. So we move to column two, with the hopes that an increased fly-ball percentage would be the answer to our question. However, his fly-ball percentage was actually his third-lowest recorded since 2010, which makes his spiked home-run-per-fly-ball percentage in column four even more puzzling. With the mystery unsolved, we move to the next column, which measures the percentage of balls in play that were pulled by opposing batters. This rate increased dramatically in 2016, and it coincides with the escalated hard-hit rate in column six.

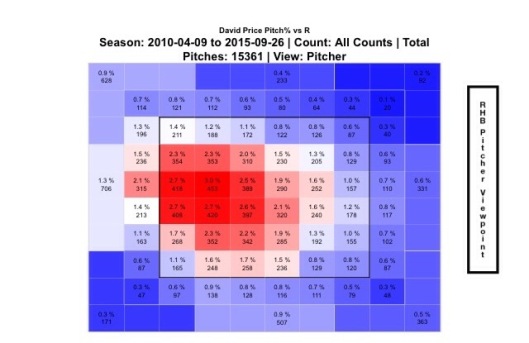
If opposing batters (generally righties) are squaring up on the ball and pulling it more than ever (generally to the Green Monster) on Price, it stands to reason that he is giving them pitches to pull hard. Let’s first examine a heatmap from Price’s pitch locations to right-handed batters over the same six-year sample size we have been using.

fullsizerender-7

*via FanGraphs

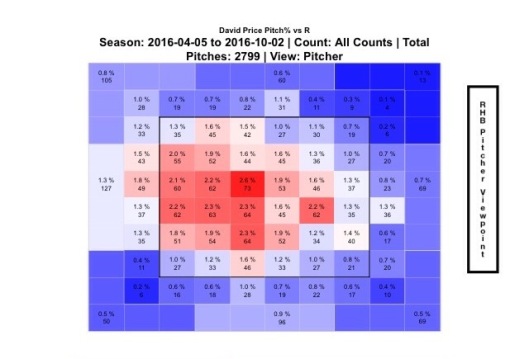
This looks pretty good! It’s no wonder why Price has been so adept at avoiding the longball; he really pounds the outside corner on those right-handed batters. So let’s look at 2016 and see if anything has changed.

fullsizerender-9

*via FanGraphs

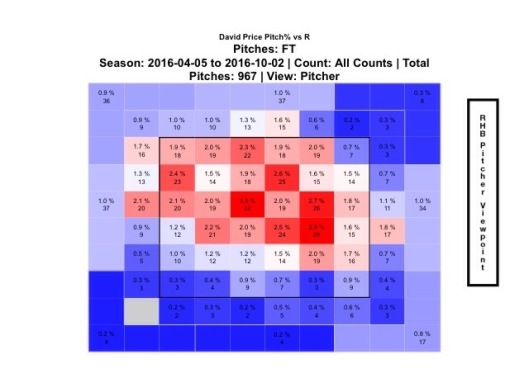
Yeah, that will change your fortunes. Much less of that outside corner action, much more of that “meatball right down the middle” action. I decided to dig a little deeper and look at which of his four pitches (fastball, cutter, changeup, and curve) was most responsible, or if multiple pitches were culprits. I’ll save you the trouble and get to the one culprit.

fullsizerender-8

*via FanGraphs

We’ve got a match, and you probably guessed it – it’s the fastball. I can’t explain to you why Price was missing his spots, but you and I know that this is a game of inches, and his fastball was responsible for 16 of the 30 homers he gave up. While this is purely speculation, it’s possible that Price was getting acclimated to his new environment and $217M contract. Whatever the case may be, this is the only adjustment that he really has to make in 2017 to return to his previous levels of Cy Young stardom.

Pitching is an unforgiving occupation, and pitchers often spend years refining their craft, but I am willing to go out on a limb and bet that someone of David Price’s caliber can make this one readjustment. He is no longer the new big-ticket addition in Boston (that would be Chris Sale), nor is he the defending Cy Young (that would be another teammate, Rick Porcello), which should lessen the pressure somewhat. With the hopes that Price is in good health, you can expect a huge bounce-back year from him in 2017.


Rick Porcello and Wins

Before spring training started, Scott Lauber at ESPN explored whether Rick Porcello could match his 22-win season from 2016. The short answer? No. Probably, almost definitely, not.

Conventional wisdom would swiftly say that, too, though. Three pitchers netted 20 wins last year, two in 2015, and three in 2014. And over those three years, none of the pitchers repeated the feat.

With wins speaking to much more than simply the pitcher on the mound, there are two things to consider when digging into the question: What could Porcello repeat, and what could the Red Sox offense?

Let’s start with the offense. Lauber’s article acknowledges that the Sox scored a league-leading 5.42 runs per game last year, and 6.83 per Porcello start. The biggest difference between this year’s and last year’s team is Mitch Moreland replacing David Ortiz. You could close your eyes and dip your hand into a bowl of cold spaghetti like it’s a Halloween Horror House and pull out the contrast between their production. As is, Moreland is projected to be worth about half a win next season. Alone, that suggests how the Sox could have struggles producing the same way in 2017.

But there are other questions to answer, too. How will top prospect Andrew Benintendi fare? Will Pablo Sandoval make any difference or continue to be negligible? I’m not suggesting the Sox won’t be good. It would be hard for them not to be. But they have enough variables going into the year that Porcello getting another 20+ wins is largely on him, which could be difficult for reasons beyond conventional wisdom.

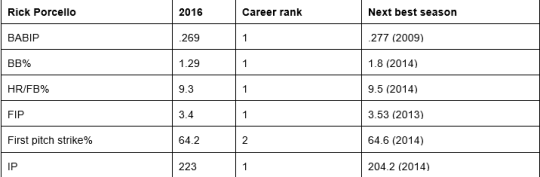
image

These numbers tend to feed into each other, which is why they’re useful in seeing just how good Porcello was, and how well things broke for him last year. His pitching profile was relatively similar to past seasons, though. It’s not like Drew Pomeranz discovering a new pitch or Brandon Finnegan changing a grip. Porcello’s sinker (or two-seamer, depending which stat site you reference) gets a lot of the credit for his exceptional performance, but differences in his curveball may reveal reasons for it, too.

image

None of these changes are insignificant. The h-movement tells us Porcello’s curve ran away more from right-handed hitters and in on lefties. The v-movement tells us it dropped more. Add in how it was three mph slower and it rounds out how the pitch fell off the table more. He worked the zone more up and down over the plate than he did side to side in the two years prior, so it could have messed with batters more when the rest of his pitches moved as they have.

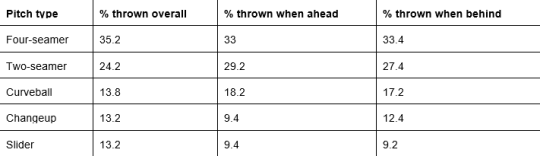
According to Lauber, Porcello mimicking anything close to 2016 will come down to “keeping hitters honest with his off-speed pitches.” Opponents hit .190 against his slider and .174 against his changeup. That could concern pitch-sequencing. Take a look at how he distributed his offerings in general, and then when ahead or behind in the count.

image

While the numbers don’t detail specifically when each pitch was thrown, they indicate that Porcello was eerily similar no matter what the count was. Sequencing isn’t about finding a magic combination of pitches; it’s about making sure a hitter can’t tell what’s coming. It certainly seems he was successful at it.

This data shines light on the tiny changes that might make a big difference in the game, which is one of the most fascinating aspects of baseball. But even more interesting is a quote from Dave Dombrowski in the ESPN piece, where he said, “I don’t think [Porcello] will try to do too much anymore.”

By itself, that reads like a generic sports-interview statement. But think about what the concept of “trying to do too much” really means in baseball: trying to do too much of one thing. A guy tries to hit a five-run homer or hit 100 on the gun every time; really tries to impose his will over the game by doing something impossible. Porcello wasn’t relying on any one pitch in 2016. And what Dombrowski is hinting at here, intentional or not, is there’s a certain amount of surrender that’s necessary for faring well in baseball.

Lauber tells how Porcello best explains his 2016 success by saying he “better understands what makes him effective.” Maybe that has to do with knowing how much the game controls versus how much he can, which let him harness his own abilities more.

I fear a lesser 2017 from Porcello could be called a disappointment by some, but an advanced understanding doesn’t always mean advanced success. The reality is it was a great year aided by good luck, probably buoyed by the cognizance that has allowed Porcello to be a contributing major-leaguer since he was 21. Maybe he isn’t as good this coming season, but it doesn’t take away from the player he is.

—

career and pitch movement data from FanGraphs; pitch usage from Baseball Savant


Gary Sanchez Should Bat Second

What do Mike Trout, Josh Donaldson, Dustin Pedroia, Corey Seager and Manny Machado all have in common? Besides the numerous accolades that they share between the Rookies of the Year, the Silver Sluggers, the MVP awards and the combined 16 All-Star appearances, they all share one less obvious trait: they have more career plate appearances batting second in the lineup than anywhere else. Gone are the days of your team’s best player batting third or fourth. The new normal is now MVP-caliber players batting second. It has worked for Pedroia and the Boston Red Sox, Machado and the Baltimore Orioles, Donaldson and the Toronto Blue Jays and Seager and the Los Angeles Dodgers. Not for nothing, but those teams all made the postseason last year with large contributions from their second-hole hitters AND Trout was the AL MVP for the second time in his career on a last-place Los Angeles Angels team. And as more teams continue to adopt this trend, the New York Yankees should also look to bump up their best hitter.

In an appearance the other week on a YES Network interview, GM Brian Cashman has stated that the Yankees have kicked the tires on splitting Brett Gardner and Jacoby Ellsbury in the lineup. This makes a lot of sense when looking at their game; they both rely on their ability to get on base and set the table more so than their ability to drive in runs. Additionally, both players have slowly, but noticeably, been in decline in recent seasons, primarily due to age and injury. Gardner has been the subject of trade rumors over the past few seasons and Ellsbury has been the ire of the New York media for largely failing to live up to the seven-year, $153-million deal he signed before the 2014 season. River Ave Blues has already had a look at how the Yankees would approach this situation and they have provided a solid solution, but they almost immediately toss out the idea of Gary Sanchez batting there for one reason or another, while Sanchez is most deserving of the promotion.

Sanchez has established himself as the Yankees’ most dominant hitter after bursting on the scene last year. The Yankees, their fans, and the nation all expect Sanchez to hit in the third spot in the lineup, a prestigious position considering the history of the franchise, but moving the young slugger to second would not only better suit the team, but would also play to his strengths. Sanchez, despite the short sample size of 231 plate appearances, has proved to be a pretty good fastball hitter. Of the 294 fastballs he has seen, he has connected for a .328 AVG and .781 SLG, and nine of his 20 home runs. Why does this matter? Traditionally, number-two hitters have seen more fastballs than elsewhere in the lineup, and to further cement his commitment to the fastball, per Brooks Baseball, Sanchez had an exit velocity of 94.3 MPH against the heater (Sanchez ranked in the top 10 in overall exit velocity last year). Young players are also traditionally late to adapt to major-league breaking pitches. Can you blame them when they’re up against this or this?

Secondly, it has been proven that two-hole hitters collect more plate appearances per season than the three through nine spots. This is not new information, but the exact number of plate appearances has been up for debate for years. Beyond the Box Score might’ve ended the debate while also examining how the two hole has changed, stating that “[e]ach drop in the batting order position decreases plate appearances by around 15-20 a year,” which might explain why MVPs Trout and Donaldson have made a living there over the past few seasons. An extra 10-20 plate appearances could mean an extra home run or two over the course of the season. Baseball is a game of inches, but it’s also a game of runs.

With a lineup bereft of veteran power and more intent on utilizing the “Baby Bombers,” as they’ve been so aptly named, moving Sanchez up to second could and should give the lineup a much-needed boost if the reliance on Greg Bird and Aaron Judge should go somehow awry. Veterans Matt Holliday, Chase Headley and Starlin Castro have had good seasons and impressive resumes, but they need to return to All-Star form to carry a team of youngsters and a questionable starting rotation. No one really expects Sanchez to produce at the same rate that he did last year, but perhaps a bump up would allow him to produce at an above-average level again.


David Price Is About to Go Off

View post on imgur.com

On June 25, this was David Price’s tweet to family, friends and fans.  It was a clear signal that he knew the patience of the Boston fans and media was wearing thin.

Fast forward to the All-Star break and his “Made for TV” stats (those that casual fans know best) are underwhelming: a 9-6 record with a 4.34 ERA, which is worse than the MLB average of 4.23.  It’s not so much his ERA that’s the problem to fans, but more his inability to be consistent from start to start.  Price has three starts of six-plus innings allowing two or fewer runs, but also has four starts of allowing six or more runs.  With the rest of the rotation producing an atrocious 4.86 ERA, the Sox desperately needed Price to be the one to stop the bleeding, something he hasn’t been able to do.  But that doesn’t mean his underlying skills have deteriorated and all of a sudden he’s become a league-average pitcher.  In fact, the advanced metrics say he’s been extremely unlucky and that he’s due for a big second half. 

View post on imgur.com

* Rank is solely being used to establish a baseline for Price as a top 10 pitcher.

In 2014 and 2015 combined, Price was ranked in the top 10 of all pitchers in four of the skill-based statistics: K%, BB%, xFIP and SIERA (the latter two being ERA estimators with a weighting towards more pitcher-controlled outcomes).  Through the 2016 All-Star break, Price has maintained or improved his top-10 rank in K%, xFIP and SIERA but dropped a few spots in walk rate.  Despite the move from 9th to 10th in K% rank, his K rate is actually up from 26.2% to 27.1%.  The reason for the drop in rank is that 2016 newcomers to the list Jose Fernandez, Noah Syndergaard and Drew Pomeranz did not meet the minimum innings qualifier for the 2014/2015 combined list.  On the flip side, Price’s xFIP and SIERA are higher than they were the past two years, but he has improved his ranking versus his peers.  This is because xFIPs and SIERAs are both up 10% league-wide versus last year (due to all the home runs being hit) while Price’s increases are smaller.

So what is happening?  If his base skills are fine, why is his ERA so high and his performance so inconsistent?

View post on imgur.com

So everyone is familiar with ERA and can easily infer that 4.34 is no bueno for a $217-million pitcher.  But there is a reason these stats are labeled “Non Skill-Based” — that’s because these stats are influenced by factors outside of the pitcher’s direct control (defense, luck, sequencing, variance, etc…) and therefore have wide variability over small samples.  Three of these stats (HR/FB%, BABIP and LOB%) explain why David Price is a great rebound candidate for the second half.

HR/FB%

Price’s current HR/FB (home runs per fly ball) rate is 15.2% — which is good for being ranked 76th out of 97 qualified starting pitchers.  The past two years combined he ranked 19th.  To put this in context, Price’s career average is 9.4% while the 2016 league average is 12.9%.  Price has never recorded a full season (>150 IP) HR/FB rate higher than 10.5%.  Also, on balls hit into play against Price this year, 31.3% of them are fly balls, the second-lowest rate of his career.  The only season in which he allowed a lower fly ball rate was in 2012 when he won the AL Cy Young award.  Price is giving up fewer fly balls this year, but of the fly balls he is allowing, they are going over the fence at the highest rate of his career.  Those that remember Price giving up a HR in 10 consecutive starts this year are nodding violently right now.  His HR/FB% will regress towards his career norm (9.4%) and this should be the main reason for a big second half.

BABIP

Price is also suffering from an unsustainable BABIP (batting average on balls in play).  His current mark of .321 is well above his career rate (.289) and even above his highest full-season rate (.306).  Once a ball is put into play it is out of the pitcher’s control what happens from there.  This is why defense and luck influence this stat more than skill.  And with that said, statistical outliers here tend to regress towards career norms.  Even though Price is allowing ground balls at a higher rate than the past two years, his 2016 GB% is still lower than his career average.  BABIP can be influenced by the number of ground balls a pitcher allows, but he’s not allowing vastly more than his career average.  His BABIP should have some positive regression in it, which is another predictor of improved second-half performance.

LOB%

Price’s Left-On-Base% (percentage of runners a pitcher strands over the course of a season) is currently 70.9%, which is also below his career rate (74.7%) and would be his second worst full-season rate (70.0%) if the season ended today.  Similar to HR/FB%, he is ranked 73rd out of 97 qualified starting pitchers.  The past two years he ranked 22nd.  A pitcher with a higher than average strikeout rate should be able to sustain a slightly higher than average LOB%, but it’s playing out the exact opposite way for Price.  This is partly due to his inflated BABIP and HR/FB%; as these statistics continue to regress towards his career norms, the LOB% will creep up to expected levels.


Much has been made of Price’s velocity being down this year compared to any point in his career.  At the start of the season, his velocity was over 2.0 MPH lower than his career average (94.1).  He has since closed this gap almost entirely.  Here is his average fastball velocity by month (with number of starts):

April: 92.0 (5)

May: 92.5 (6)

June: 92.9 (6)

July: 94.0 (2)

If this upward trend in velocity stabilizes somewhere at or above 93.5, then nearly all the performance metrics within his control — velocity, K%, BB%, xFIP and SIERA — will be at or near his career norms.

Let’s dive a little deeper into that early-season velocity issue.  Below are two charts.  The first shows combined performance of 2014 and 2015 for ERA-qualifying starters while the second chart is the same data for the 2016 season through the All-Star break.  The orange circle is David Price.  The red circle (if shown) represents Price’s career average.  The blue circles are a hand selected peer group of the top 10 pitchers in the game (Kershaw, Sale, Arrieta, Scherzer, Bumgarner, Greinke, Strasburg, Syndergaard, Salazar and Fernandez).  Remember those rankings where Price was right around the top 10 — these are the guys usually outperforming him.  The gray circles represent everyone else.  Note: For these first two charts the top-right quadrant is Good, and the bottom-left quadrant is Bad (unless you’re a knuckleballer).

2014-2015 K/9 vs FBv

View post on imgur.com


2016 K/9 vs FBv

View post on imgur.com

The first graph shows David Price clustered where you would expect him — right at the middle-to-bottom of his top-10 peer group, with a healthy average fastball velocity and K/9.  The second graph (2016) shows Price in a similar relationship to his peers, but with slightly lower velocity and a higher K/9.  Note the gap between the orange (Price’s 2016) and red (Price’s career average) dots depicting his improved strikeout numbers this year despite the slightly lower velocity.  This graph also shows what freaks Noah Syndergaard, Jose Fernandez and (to a lesser degree) Jered Weaver are.

The final two graphs show the relationship between ERA and xFIP where xFIP is the more predictive estimator of a pitcher’s skill.  The bottom-left quadrant is Good (think Kershaw) and the upper-right quadrant is Bad (think Buchholz).  Anyone in the upper-left quadrant (Price in 2016) is a candidate for positive regression.

2014-2015 ERA vs xFIP

View post on imgur.com


2016 ERA vs xFIP

View post on imgur.com

The first graph again shows Price in his usual place — at the tail end of the top 10.  In 2014 and 2015 combined he had a very similar ERA (2.88) and xFIP (2.98).  The second graph (2016) shows the disparity between his ERA (4.34) and xFIP (3.16).  Pitchers with this large of a gap between ERA and xFIP are great candidates for regression.  The important takeaway is that his xFIP, relative to his peers, has stayed in that top-10 range.  This supports the point that some bad luck is the main element depressing his ERA.

David Price can easily be the best pitcher in the American League over the next two and a half months.  He already owns the lowest xFIP in the AL at 3.16 — the next-closest is Corey Kluber, at 3.34.  The skills above show he can sustain the xFIP level, but with some change in luck and maintaining his improved velocity, he doesn’t need to “pitch better”; he just needs to keep pitching — and the results will follow.


Taking a Look at David Price’s Turnaround

After signing a massive seven-year, 217-million-dollar contract with the Red Sox this past offseason, David Price got off to a slow start. After his May 7th start against the Yankees in which he gave up six earned runs in just 4.2 innings, Price’s ERA stood at a whopping 6.75 yet his peripherals remained strong. He had a 2.98 FIP and 11.5 K/9. However, he was giving up hard contact over 41 percent of the time. The immediate fix was a mechanical issue noticed by Dustin Pedroia that was limiting Price’s leg lift and diminishing his velocity. Frustrated with his failures, Price vowed to be better.

And better he has been. After throwing a gem in Sunday’s win over the Mariners where he went eight innings allowing his only run on a solo shot by Franklin Gutierrez, Price lowered his season ERA to a still high 4.24 and had his eighth straight quality start. Over those eight starts, Price has been much better, allowing 16 runs over 58.1 innings for an ERA of 2.47. During this stretch, he has a 3.88 FIP and 8.6 K/9 and has only allowed hard contact around 27 percent of the time. Although his strikeouts have gone down and his FIP went up due to his decrease in strikeouts to go with an increase in home runs allowed, Price has limited the amount of hard contact he has given up. This can be seen in the BABIP over the two stretches. In his first seven starts, his BABIP against was around .370, while in this current eight-start stretch it is hovering around .230.

This in turn, has allowed him to be very successful while pitching to contact. His biggest issue remains his ability to keep the ball in the park. Over his last eight starts, Price has allowed at least one home run in seven of them. So while he has limited hard contact against him, the few mistakes that he makes each game are punished. Despite this increase in home runs allowed, he continues to pitch well and go deep into games, allowing the Red Sox bullpen a chance to recover after the consistently shaky starts from their 4th and 5th starters.

There are a few main reasons to this improvement. The first was his ability to regain his velocity. Looking at his velocity each month thanks to data from Brooks Baseball, there is a small but steady increase in his average four-seam and sinker velocity. Before May 8th, his velocity was low by his standards. Typically a pitcher averaging 94 to 95 MPH with his fastball, he had been sitting 93 MPH.

Year Fourseam Sinker Change Curve Cutter
2016, Before May 8th 93.2 93.0 84.3 78.8 88.8

Although just a small dip in velocity, it made him much more hittable.

Since May 8th, his velocity has been back on the rise.

Year Fourseam Sinker Change Curve Cutter
2016, Since May 8th 94.2 93.4 85.0 78.3 89.0

After the mechanical change, his four-seam has been averaging around 94 MPH and his sinker has been averaging around 93 MPH, but still slightly up from what it was before. Although it is a small increase, this added velocity has helped Price dominate hitters, gain confidence, and re-establish himself as an ace.

Another key factor in this improvement has been his pitch usage. Using pitch data from Brooks Baseball, I was able to look at Price’s pitch usage. In his first seven starts, Price relied on mixing different types of fastballs with his main offspeed pitch being a change-up while also displaying the occasional curve.

Year Fourseam Sinker Cutter Curve Change
2016, Before May 8th 27.6 22.6 19.8 6.6 23.4

His four-seam was used around 28 percent of the time yet it lacked the movement displayed by his cutter and sinker. The high four-seam usage to go with decreased velocity spelled trouble for Price.

However, since May 8th, Price has made an adjustment displayed by the fact that he is now using his sinker as his primary pitch while also using his four-seam far less frequently.

Year Fourseam Sinker Cutter Curve Change
2016, Since May 8th 9.0 36.1 22.4 8.3 24.3

His sinker is now used around 36 percent of the time compared to his four-seam being used around nine percent of the time. With this added movement and velocity, Price has been able to be more effective while keeping the use of his curve, cutter, and changeup around the same. This simple switch from a four-seam to a sinker has allowed him to go on a tear.

Looking forward, the Red Sox need Price to continue to be the pitcher that he has been over his last eight starts. They are paying him ace money and he is expected to pitch like one down the stretch as Boston hopes to continue their great turnaround year. If Price continues to have outings like these, the Sox should like their chances come October with him taking the mound with their season on the line.