Archive for Arizona Diamondbacks

J.D. Martinez Will Be Productive in Six Years (And Maybe Seven)

While baseball fans wait for the free agent market to finally unthaw, J.D. Martinez waits for a contract offer enticing enough for him to sign. Early reports suggested that Martinez and his agent, Scott Boras, set an early asking price at seven years, $210 million. Clearly, nobody has taken the bait. Among Martinez’ likely suitors, many have moved onto other options; the Cardinals traded for Marcell Ozuna, and the Giants traded for Andrew McCutchen, seemingly leaving the Red Sox as Martinez’ lone serious suitor.

The latest report, from Buster Olney, is that Martinez has an offer on the table from the Red Sox worth five years, $100 million. Taking the reports at face value (although Boras himself has simply declared the report “inaccurate”), the offer obviously comes up short of Martinez’ demands, which is why this article is being written in late January to begin with. To that end, here’s an excerpt from Jeff Passan’s recent column at Yahoo Sports on baseball’s economic system:

“Recently, one of the best free agents available this offseason met with a friend, and he admitted something shocking: He was preparing to sit out until the middle of the season. The market for his services this winter was so thin, the offers so incompatible with his production, that he worried he was going to need an external force to compel teams to pay him what his numbers say he’s worth. Maybe it would take a playoff race.”

Can we assume that the hitter in question is Martinez? Of course not, but considering the discrepancy between his asking price and the reported Red Sox offer, it wouldn’t be an outlandish guess. While I understand that the Red Sox have leverage in that they presumably don’t have anyone to bid against, I will argue that Martinez will be well worth a contract in excess of 5/$100M.

From 2014-2017, his Age 26 through  Age 29 seasons, Martinez posted an astounding 149 OPS+ (my apologies for not using wRC+ in this column!), with a low of 139 and a high of 166. To that end, I researched players from the DH era (circa 1973) that posted an OPS+ between 140 and 160 in their Age 26 through Age 29 seasons. Presumably, these players would make for suitable Martinez comps as we attempt to project his offensive production over the next five to seven years. Of course, some of these players are still active and haven’t played enough to give me complete data, such as Ryan Braun, so they have been eliminated from the dataset. I was left with 38 comparable players, which is a large enough sample for our purposes today.

In this chart, I condensed the sample into averages because 40 rows and 9 columns doesn’t embed so cleanly. These are Martinez’s comps for their age-26 through age-29 seasons, their offensive production for the next five years (through age-34, which is Martinez’ floor value at this point) and then their production in the sixth and seventh following years (ages 35 and 36, which represent Martinez’ ceiling value at this point).

J.D. Martinez Age 26-29 Comps Through Age 30-34, 35, and 36
Age Average OPS+ Average PA/Season Sample Size
26-30 147 637 38
30-34 134 559 38
35 124 512 36
36 117 447 33

The average player from my sample posted a 147 OPS+ in their age-26 through 29 seasons, which matches up neatly with Martinez’ 149 mark. You’ll first notice the drop off in production for these players in their age-30 through 34 seasons. There are several reasons for this. Yes, natural decline was at work, but the original search for Martinez comps included a 2000 plate appearance minimum; this means I was guaranteed to be given players both as good and as healthy as Martinez in their Age 26-29 seasons without the same guarantee they would be healthy in the years that followed. This also means players like Mark McGwire (146 OPS+ in 1913 PA) were excluded from the sample because he was injured, despite the 189 OPS+ he would put up in 3462 plate appearances through Age 36.

Nevertheless, it’s a reasonable regression one can expect for players entering their 30s, and the good news is that they were, on average, very productive (134 OPS+) and very healthy (559 PA). This is what the Red Sox believe to be worth 5/$100M, but I would argue that this data shows they should be willing to tack on a sixth year without blinking. Of the original 38 player sample, 36 players played their age-35 seasons; they were still very productive (Khris Davis has been producing along these lines the past two years) and healthy enough to play a full season.

The real question surrounding Martinez is – or at least should be, if the market weren’t so cold – whether he should be given a seventh year or not. From his comps, the sample size drops significantly for the first time down to 33, the average playing time falls below the league qualifying minimum for the first time, and the production drops below what you’d want from your DH (the reference point here would be Miguel Sano from the last couple of seasons).

At face value, I would absolutely give Martinez the sixth year, and absolutely not give him the seventh. At the same time, we should dive into our sample a little deeper and discover why some players did well and why others tanked in their 30s; perhaps there is something we can correlate with Martinez so we can get an even better projection. From the original sample, here are the twenty best performers in their age-36 seasons (based on a combination of plate appearances and OPS+).

Twenty Age-36 Producers
Rank Player OPS+ PA Rank Player OPS+ PA
1 Rafael Palmeiro 141 714 11 George Brett 123 528
2 Mike Schmidt 153 657 12 Robin Yount 102 629
3 Dave Winfield 159 631 13 Wade Boggs 142 434
4 Chipper Jones 176 534 14 George Foster 121 504
5 Carlos Delgado 128 686 15 Brian Giles 110 552
6 Jim Thome 150 536 16 Dave Parker 92 647
7 Bobby Abreu 118 667 17 Alex Rodriguez 111 529
8 Fred McGriff 110 664 18 Vladimir Guerrero 98 590
9 Eddie Murray 115 625 19 Ken Griffey 99 472
10 David Ortiz 173 383 20 Bernie Williams 85 546
Average 140 610   Average 107 543

The reason I picked the twenty best rather than the top and bottom ten is that the bottom ten would be littered with folks such as Cliff Floyd or Dale Murphy, who only came to the plate 17 and 63 times respectively during their age-36 seasons. Using the ten best players captures those who were magnificent offensive performers with full playing time. Using the next ten players captures those who were mediocre in full playing time. This looks good to me.

This would be the time for me to explain why I haven’t mentioned WAR in this piece: J.D. Martinez has been horrible on defense!

He was best suited as a DH years ago, but being on a roster with Victor Martinez and then being traded to the National League forced him to play right field, which depressed his value. If Boston signs him, he’ll see absolutely no time in an outfield that will be covered by Jackie Bradley, Mookie Betts, and Andrew Benintendi for the foreseeable future. As a DH for the rest of his career, Martinez will be solely judged by his offensive production and ability to stay on the field.

Again, our question is whether Martinez receiving a seventh year is justified. More specifically, this boils down to “In seven years, will Martinez be in the left column or the right column?” Both sides of the list contain incredible players, but there’s a way to make a reasonable projection. Here’s the same list, but instead of rank, you’ll see the positions these players spent significant time. Those who had significant time at 1B/DH are highlighted in gold.

Twenty Age-36 Producers (By Age)
Position Player OPS+ PA Position Player OPS+ PA
1B/DH Rafael Palmeiro 141 714 1B George Brett 123 528
3B/1B Mike Schmidt 153 657 CF Robin Yount 102 629
RF Dave Winfield 159 631 3B Wade Boggs 142 434
3B Chipper Jones 176 534 LF George Foster 121 504
1B Carlos Delgado 128 686 RF Brian Giles 110 552
DH Jim Thome 150 536 RF Dave Parker 92 647
RF/LF/DH Bobby Abreu 118 667 3B/DH Alex Rodriguez 111 529
1B Fred McGriff 110 664 DH Vladimir Guerrero 98 590
1B Eddie Murray 115 625 CF Ken Griffey 99 472
DH David Ortiz 173 383 CF/DH Bernie Williams 85 546
Average 140 610   Average 107 543

In this exercise, let’s consider 1B/DH to be significantly less stressful positions than the others. After all, there is a significant correlation between time spent in the field and sustaining an injury that leads to decline. While players like Brian Giles, Dave Parker, and Ken Griffey Jr. saw injuries and offensive decline catch up to them after years chasing down balls in the outfield, players like Rafael Palmeiro, Carlos Delgado, and Jim Thome aged extremely well by not exerting the same stress in the field.

Martinez is almost certain to spend no time in the field at Age 36. Hell, he might not spend much time in the field ever again. So I consider him a slam dunk to be placed in the group on the left. Referring to the averages from the first chart in this article, I’ll the over on Martinez when the time comes. To be clear, I donJD’t necessarily think he should be given the seventh year outright – an option would probably be most appropriate – but I think this data solidifies my comfort in giving him a sixth guaranteed year.

In a winter in which the market is changing in ways we have never seen before, it’s difficult to predict what  Martinez will earn. It’s important to remember that dollars are a construct; we can’t assume Martinez will get $150 million from the Red Sox because Adrian Gonzalez did after amassing similar numbers. Teams like the Red Sox are wary of contracts like the one given to Gonzalez, who will earn $21.5M from that deal this year. In this market (or lack thereof), it’s impossible for me to put dollars or years on Martinez, but I do know this: Martinez is a special hitter, and he’ll age especially well.

He will be a productive hitter for the next six or seven years, and there’s no dollar amount that can change that.


Alex Cobb Will Be One of the Gems of This Free Agent Class

Of the pitchers hitting the free-agent market this winter, Alex Cobb is not likely to receive the most fanfare.

Aces Yu Darvish and Jake Arrieta will command contracts north of $100 million. Closers Wade Davis and Greg Holland will do their best to secure four-year deals with big price tags. The whole world is watching every development in the Shohei Ohtani saga. Hell, among midmarket starting pitchers, MLB Trade Rumors predicts Lance Lynn to receive a more lucrative contract than Alex Cobb.

Cobb, who broke in as a full-time starter with Tampa Bay in 2012, has historically shown great promise and good-but-not-great results. He averaged 2.5 fWAR from 2012-2014, lost the next two seasons to Tommy John surgery, then came back with a 2.4 fWAR season in 2017. Cobb has never started 30 games in a season, nor has he ever thrown 200 innings. These facts are concerning to some, but I would argue that he is one of the wisest investments one can make this offseason.

Alex Cobb has evolved as a pitcher through pitch selection. Cobb has a great curveball. You either already know that, or you’re about to find out. He also mixes in a four-seam fastball, a splitter, and a sinker. Right now, curveballs are all the rage in baseball, resulting in tremendous success for pitchers like Rich Hill, Trevor Bauer, and Lance McCullers. They throw their curveballs so often that we can consider the breaking ball, not the fastball, to be their primary pitch. Like Hill, Bauer, and McCullers, Cobb has a quality breaking ball, so it stands to reason he should throw it more often and perhaps eschew his mediocre offerings. With Brooks Baseball, we can track the usage rate on each of his pitches throughout the season.

Look at the first couple data points for the usage rates on his pitches, and then compare them to his points at the end of the season. It’s clear that Cobb began to realize he works best by using the fastball and the curveball exclusively, so he increased his usage rate on those pitches and gradually phased out the splitter and sinker.

The question for Cobb is whether this was a good idea. In Cobb’s career, he’s only posted a strikeout-to-walk percentage (K-BB%) above 15% twice, and only ever so slightly so. He’s not bad in that regard, but it’s not where he makes his bread and butter. Fortunately for Cobb, he is one of the better pitchers in the league at inducing ground balls, which we know is favorable contact. The more grounders Cobb induces, the better he gets, and his curveball is a ground-ball machine. Consider the correlation between the rate at which Cobb increased his curveball usage and his ground-ball rate (GB%) throughout the season:

That’s a pretty strong correlation. It seems that Cobb is ready to join the Hills, Bauers, and McCullerses of the world and ride a high breaking-ball-usage rate to breakout success. Of course, it’s never going to be that easy for Cobb or anybody, but let’s go through one of his starts and parse what we can from the good and bad.

On September 4, Cobb pitched against a red-hot Minnesota Twins lineup and had one of his better starts of the season. His first batter of the game was second-half monster and fly-ball connoisseur Brian Dozier, and he managed to get him out on the first pitch.

It’s been proven that batters from the “fly-ball revolution” can be neutralized if you throw them high fastballs. These hitters are swinging up to lift the ball, but it’s difficult to put much lift on a high pitch coming in fast.

We’re going to focus on the curveball throughout this piece, but here is a fun fact about his fastball. Cobb’s heater sits at 92 MPH and had a spin rate of 2101 RPM this season, which seems pretty pedestrian. However, among starting pitchers with at least 100 batted-ball events involving fastballs, Alex Cobb’s has the 31st lowest exit velocity (87.1 MPH). To put this in perspective, that’s a better mark than James Paxton, Chris Sale, Max Scherzer, Jon Gray, Justin Verlander, and Luis Severino.

Cobb was smart to bait Dozier here, and he reaped the benefits with a first-pitch out to begin the ballgame.

In the second inning, we see Cobb pitching out of the stretch and unleashing a curveball that Ehire Adrianza buries into the ground. This will be the common theme today.

I mentioned earlier that Cobb doesn’t have the K-BB% of Chris Sale or Corey Kluber, so every once in awhile he walks batters. The common thought is that Cobb, who throws so many breaking balls, might end up behind in the count thanks to misplaced curves. Then, to get back in the count, he throws his 93 MPH fastball in the zone, which gets crushed by every hitter expecting it.

This would be a bad habit for Cobb to fall into, but he certainly didn’t in 2017. Consider the list of pitchers who threw the most curveballs while behind in the count this season (via Baseball Savant):There’s Cobb, in fifth place, not far behind Rich Hill himself. All five of these guys have great curveballs, so it makes sense for them to Trust the Process™ and continue dropping the hammer rather than submitting to doom and throwing a predictable fastball in the zone.

After walking the leadoff batter to start the third inning, Cobb knew Joe Mauer could make him pay. So rather than giving Mauer the fastball he wanted, Cobb began the at-bat by dropping a curveball for a strike that even froze the great Mauer.

This changed the whole at-bat, because now Mauer didn’t know whether Cobb would be coming at him with the curve or the fastball. Cobb took advantage of his opportunity, used the fastball to get him in an ideal 1-2 count, and then he went back the curveball and got Mauer to ground into a double play.

Cobb is comfortable throwing the curveball both behind in the count and with runners on base, so he can reap the rewards and induce quite a few double plays. That is an asset. Additionally, Cobb is comfortable throwing his curve from both the stretch (as we saw against Adrianza and Mauer) and from his big windup, as you can see here.

Eddie Rosario is a good hitter who made great strides late in the season, but even he found himself to be another ground-ball victim of Cobb’s curveball.

By the fifth inning, Cobb was almost through his second time against the Twins’ batting order. At this point, they weren’t sure whether to expect the curveball or the fastball, so Cobb was often ahead in the count. Here, he has Eduardo Escobar in a 1-2 count and throws a high fastball that Escobar swings right through.

Everyone in the park was expecting Cobb to throw the curveball to finish Escobar off. From a look at Escobar’s swing, it’s safe to say he was expecting a curveball himself. Cobb’s fastball isn’t necessarily anything special, but the way he uses it to pitch off the curveball can be.

With two outs in the inning, Cobb faced his 18th batter (which would complete his second time through against the opposing batting order). He quickly got Ehire Adrianza into an 0-2 count and then unleashed his best curveball of the night, which Adrianza pounded into the ground for another easy out.

At this point, Cobb had gone through the opposing order twice, pitched five innings, and only given up one run. Teams around the league are beginning to realize that most of their starters simply shouldn’t go out for the third time through the order, even if they are rolling. The Houston Astros just rode using Lance McCullers, Brad Peacock, and Charlie Morton in tandems all the way to the World Series. Those three guys are valuable pieces, and if Cobb is utilized liked this, so is he.

Unfortunately for Cobb, his pitch count was at 85, so his manager decided to bring him out for another inning. The Twins got their third look at Cobb, and I don’t need to cite the statistics to you about what happens at this point. Hitters are smart, so they can pick up on the tendencies of a pitcher if they see him so many times. Alex Cobb, as great at he was through five innings and two times through the order, is no exception to this rule.

Here is Joe Mauer taking an 0-2 curveball from Cobb and driving it into the gap in center for a double.

The important question here is, “was that Cobb’s fault or just a good piece of hitting from Joe Mauer?” Of course, the answer in baseball is always going to be both, but you can see in the embedded GIF that Cobb doesn’t necessarily leave the pitch up. In fact, if you compare it to the curveball that Cobb threw earlier in the game to get Mauer to ground into a double play, it doesn’t look much different — maybe an inch or two higher, at worst. The bigger change is Mauer, who swings like a guy fighting to stay alive in the first GIF, then like he knew exactly what was coming and how to handle it in the second.

This is the “third time through the order” effect in a microcosm. Pitches that fool batters earlier in the game become cookies, so the key is to relieve your pitcher while his pitches still fool the batters. Cobb should not be penalized by us for giving up a double to Mauer there; in 2018, analytical teams will be bringing in a new pitcher in these situations.

In this sense, Cobb is the first free-agent test case for the newest pitching trend in the industry — the tandem starter — one who pitches twice through the order, hopefully gets 15-18 outs, and then gives way to someone else. The Mets, who hired progressive Indians pitching coach Mickey Callaway to be their new manager, have made it clear that all starters not named deGrom or Syndergaard will be shielded from facing lineups more than twice in a game. Baseball has never experienced a shortage of five-inning pitchers in its history, but these changes in pitcher usage are leading to new premiums for these specialists.

It’s as simple as this: every team wants to stock their pitching staff with Alex Cobbs. To be clear, every team wants a Justin Verlander, but there is only one Justin Verlander; even horses Chris Sale and Corey Kluber showed significant wear and tear in October. To combat this dilemma, the Houston Astros deployed Lance McCullers, Brad Peacock, and Charlie Morton in five-inning tandems and rode them all the way to the last out of Game 7.

I expect Alex Cobb will fit into this role quite nicely for whichever team he signs with.


Desert Optimism

I recently had the opportunity to tour Chase Field, home of the Arizona Diamondbacks.  While there, I saw a lot of banners for Zack Greinke.  After all, he is the face of the franchise (if you’re not considering Paul Goldschmidt).  After signing a six-year/$206.5-million contract before the 2016 season, Greinke changed the focus and the philosophy of the Diamondbacks.  Suddenly, they were contenders.

After signing Greinke, the D-Backs traded for Shelby Miller, who was coming off what many considered one of the best years in baseball.  However, his price was laughable.  It cost Arizona top prospect Dansby Swanson, who has emerged as a candidate for a franchise player in Atlanta.  They also coughed up Ender Inciarte, a very capable center fielder who posted a .732 OPS and won a Gold Glove in 2016.  But wait, there’s more! The Braves also received pitching prospect Aaron Blair.

The purpose of this study is not to criticize former General Manager Dave Stewart’s transactions.  After all, he truly believed, after signing ace Zack Greinke, the Diamondbacks were in a position to win — and rightly so.  Stewart felt, as did many people inside the Arizona organization, their core was established.  Below is their lineup in 2016, with the players being who played the most at their position:

POSITION Name 2016 WAR Total
C Welington Castillo 2.4
1B Paul Goldschmidt 4.8
2B Jean Segura 5.7
3B Jake Lamb 2.6
SS Nick Ahmed 0.2
LF Brandon Drury 0.0
CF Michael Bourn 0.3
RF Yasmany Tomas -0.4
Total 15.6


AJ Pollock, who was coming off an All-Star season in which he produced 7.4 WAR and posted an .865 OPS, played in 12 games.  Inciarte was traded to the Braves after providing 5.3 WAR playing right field in 2015.  David Peralta, who started in left field in 2015, played in 48 games last year.  Nick Ahmed also had an injury-plagued season following a strong 2015 in which he put up 2.5 WAR in his first full year in the MLB.

The injuries to Pollock, Peralta, and Ahmed were unfortunate.  The Diamondbacks got near or around replacement-level production from their positions in 2016.  In a hypothetical situation, let’s say the three guys stay healthy, and, after subtracting their counterparts’ production, up the total runs scored by the Diamondbacks from 752 to 790 runs.  After some number crunching, the Diamondbacks’ Pythagorean expectation comes out to around 71 wins.  Give or take a few, a healthy trio of Pollock, Peralta, and Ahmed would have helped Arizona’s win expectation increase by between two and five games.

But let’s be optimistic — the hypothetical healthy trio helps Arizona to an expected 74-88 record, far better than their 69-93 actual record.  That would have moved them up in the standings from fourth in the NL West to…drum roll please…fourth in the NL West.  The problem Arizona experienced in 2016 was run prevention, not run support.  As a matter of fact, total runs increased to 752 from 720 in 2015, when they went 82-80.  However, the real increase was in runs allowed — up to 890 (!!!) in 2016, as opposed to 713 in 2015.

So why does a pitching staff that added Zack Greinke, a bonafide ace and top-tier talent, and Shelby Miller, who would fit well in the center of any rotation, give up such a whopping number of runs?  Catching.  Below is a chart of how many runs these two respective pitchers had prevented or added by their respective catchers in 2015:

Pitcher Team Catcher Framing Runs Rank
Zack Greinke LAD Yasmani Grandal +23.3 1st
Shelby Miller ATL AJ Pierzynski -8.7 103rd


As you can see, any pitcher would love to pitch to Yasmani Grandal.  In 2015, he ranked as the best in framing runs.  Essentially, what the statistic does is quantify the catcher’s ability to get strikes called, which is incredibly valuable to a staff.  Positive is good and negative is bad.  While there is not as direct a correlation between Shelby Miller’s success and AJ Pierzynski’s lack of pitch-framing ability, it is apparent there is a direct link between Greinke’s 2015 performance and Yasmani Grandal.

In 2016, Greinke and Miller both joined a staff caught by Welington Castillo.  The best way to describe Welington is he’s an offense-first, defense-second catcher.  The theme of this study is to advocate for the use of defense-first, offense-second catchers.  Look at this chart of past World Series champion catchers:

Year Team Name Framing Runs Rank
2012 SFG Buster Posey +20.0 4th
2013 BOS Jarrod Saltalamacchia -4.6 93rd
2014 SFG Buster Posey +21.5 2nd
2015 KCR Salvador Perez -7.5 99th
2016 CHC Miguel Montero +14.6 4th

After looking at that chart, there are a couple of observations to make.  One, three out of the five previous World Series teams have had top-four catchers in terms of pitch framing and pitch presentation.  Second, Jarrod Saltalamacchia was replaced by AJ Pierzynski who was replaced by Blake Swihart who is now competing with Sandy Leon and Christian Vazquez, both of whom are defense-first catchers lauded for their ability to frame pitches.  Third, Salvador Perez is the heart and soul of the Kansas City Royals, and I guarantee Dayton Moore could not care less about his pitch-framing abilities.

Essentially, what you should take away from this is teams that win have skilled catchers.  Luckily for the Giants, Buster Posey can also hit the baseball.  To bring this full circle back to the Diamondbacks — Wellington Castillo is the wrong type of catcher.  He does not frame like Posey or Montero, and the bat is nothing too special.

But alas! Castillo is no longer part of the Arizona organization! This offseason, freshly-appointed general manager Mike Hazen has added four new catchers to the picture: Chris Iannetta, Jeff Mathis, Hank Conger, and Josh Thole.  Let’s look at their pitch-framing stats from last year:

Name Team Framing Chances Framing Runs Rank
Chris Iannetta SEA 5,495 -13.8 102nd
Jeff Mathis MIA 2,248 +7.2 15th
Hank Conger TBR 2,366 +3.6 25th
Josh Thole TOR 2,410 +4.6 21st


As you can see, the Diamondbacks have added a starting catcher who is not very good at framing pitches and three back-ups who do or might fit the desirable profile of this study.  Chris Iannetta signed a $1.5 million, one-year deal; Mathis signed a $4 million, one-year deal; the other two are minor-league contracts. Hazen, who came over to the Diamondbacks from the Boston Red Sox (who are leaning towards more defense-first options at catcher), made some efforts to boost his catching corps’ defensive ability, but was it enough?

In a perfect world, I think a guy like Jason Castro fits the bill perfectly in Arizona.  While the financial situations in Arizona may have made the price for Castro too high, he fits the type of catcher this study calls for, and the type of catcher Zack Greinke and Shelby Miller deserve.  He tallied +16.3 framing runs in 6,623 chances in 2016, good for third in MLB behind Buster Posey and Yasmani Grandal.  He signed for $24.5 million over three years with the Minnesota Twins, and will surely help their young staff develop.

Let’s not dwell on the hypotheticals.  The Diamondbacks have five and a half million dollars invested in two guys: Chris Iannetta and Jeff Mathis.  While Iannetta had an abysmal year in 2016 in terms of framing runs, his track record is mixed.  In 2013, for example, he recorded a framing-runs figure of -16.6, which is comparable to his 2016 number.  In 2015, however, he recorded a figure of +13.1, good for fifth in all of baseball.  What caused such a dramatic, roller-coaster shift?  I do not know — that question could be the subject of an entire different study.

Should Iannetta get most of the starts, I would say Mike Hazen would not care if he hits below the Mendoza line if his defensive statistics match his 2015 numbers.  Should he not get most of the starts at catcher, they will more than likely go to veteran backstop Jeff Mathis.  Mathis, who is lauded for his skills behind the plate, is essentially a cheap Jason Castro.  If you divide the number of framing runs Mathis achieved in 2,248 chances last year, and multiply the decimal by Castro’s number of chances, you get around a number of +21.2 framing runs.  That would have ranked him third behind Grandal and Posey.  Of course, this method is unreliable because every chance is another chance for his framing runs to drop as well as increase.  With that being said, the efficiency of Mathis behind the plate makes giving him a chance to handle the Diamondbacks’ staff worthwhile.

The addition of Taijuan Walker, who was the return on shipping Jean Segura to Seattle, is a healthy investment in the pitching staff.  With him slotting in along with Zack Greinke, Shelby Miller, Robbie Ray, and Patrick Corbin, the Diamondbacks have the makeup of a sleeper-type rotation — one that could surprise a lot of people in 2017.  If the front office has embraced the importance of defense at the catcher position like their offseason moves suggest, their staff could cut down on runs allowed dramatically, putting their lineup in position to do some damage in the NL West this year.

One team who should be noted in this study is the Houston Astros.  Whether Jeff Luhnow’s front office emphasized framing runs and having defensively-elite catchers or not, two of the catchers mentioned in this study were teammates in Houston — Jason Castro and Hank Conger.  Castro and Conger were the only two backstops on the 2015 Houston Astros, the year Dallas Keuchel won the American League Cy Young award.  This serves the purpose of further validating the benefits a defense-first catcher can have on a pitching staff.

In conclusion, baseball is trending toward sacrificing offense for defense at a premium position.  One club that can change the face of their organization by embracing the principles outlined in this study is the Arizona Diamondbacks.  While the Diamondbacks may face public scrutiny for far after Shelby Miller and Zack Greinke are gone, fans should be optimistic about 2017.  An elite defensive catcher can make a world of difference in the performance of a pitching staff.


The statistics used in this study were found on baseballprospectus.com, the historical rosters and statistics were found on baseball-reference.com and fangraphs.com, and rosterresource.com was a great help in referencing players and transactions.


Go and Get David Peralta

Dynasty leagues are a little bit like the stock market.  What makes a good owner is finding things that may go up in value; this can be players, draft picks, or even money (not all leagues allow trading money, but ours does).  When you find a player that you think will go up in value you try to trade for him, pick him up, or draft him.  Anyone can sign good players in the auction for a lot of money, but what sets the good teams apart is their ability to find the players that are going to go up in value, or as we say “break out.”  I’m a fan of David Peralta.  He has already made quite an impact for teams in 2015.  Hitting .312/.371/.522 will do that.  The good thing for us is that he is not being properly valued right now in fantasy baseball leagues.

Now is the time of the year for rankings.  Every single site out there is coming out with their rankings getting everyone all set for their leagues.  Thankfully, we have sites like FantasyPros to get us consensus rankings and average draft positions.  Right now experts rank David Peralta an average of 40th among outfielders.  He is being drafted on average as the 38th outfielder off the boards.

David Peralta came up as a starting pitcher with the St. Louis Cardinals.  After multiple shoulder injuries he decided to bow out and head back home to Venezuela where he remade himself into an offensive player.  After an impressive year in an independent league he was signed by the Diamondbacks.  He quickly shot up through the system, learning fast for a player already in his mid 20s.  He’s only had a year and a half in the big leagues now, but he’s still been improving.  From what I understand, he is a very hard-working and upbeat player.

Numbers?  How about an improved hard-hit rate, going from 30% in 2014 to 35% in 2015?  A wRC+ jump from 110 to 138?  A HR/FB jump from 9.6% to 17.7%?  Even within 2015 he improved all three of those stats, getting up to a 38% hard-hit rate and a 162 wRC+ in the second half.  That’s destroying the baseball.  He’s spend most of his time batting fourth behind Goldschmidt and Pollock, so the RBI opportunities will continue.

You want to know what the most shocking thing is?  He only started 116 games.  The logjam in the Arizona outfield was to blame.  Well guess what, Ender Inciarte is gone and Yasmany Tomas sucks.  David Peralta is going to have no problem being the permanent cleanup hitter.  If we just took his 2015 stats and ignored any improvement whatsoever and prorated them for a reasonable 150 games we would be looking at 79 runs, 22 home runs, 101 runs batted in, and 12 stolen bases.  That’s even giving him two whole weeks off.  If you bake in some improvement due to his second-half numbers it’s not very hard to see 25-30 home runs with 200 combined runs and RBI.  Those numbers look a lot like what we’d expect from someone like Ryan Braun, Adam Jones, or Matt Kemp, all of whom are going in the 15-25 range.

The only website I’ve seen give Peralta his due was ESPN when Tristen Cockroft put him 25th among outfielders.  So at the very least that means I am not the only one thinking this is a huge value opportunity.  For dynasty leaguers, you need to go out and get him now.  He’s more than likely got a nice cheap contract or he might even be available in an auction because someone didn’t think he’s worth keeping around.  Listen to me, get him now and lock him up.  It’s a done deal.  Guess what, I’ve already done that in my league.  I traded Ken Giles ($1/3) for Peralta ($4/1) and a second-round draft pick back in November, so I put my money where my mouth is.  That was before Giles was in Houston and in our league contracts can be doubled up each additional year so I traded away about seven years of a top-10 closer for three or four years of Peralta and a second-round pick (for the minor-league draft).  But enough about me, don’t worry about my deal.  Go and get him.  Rarely are breakouts this easy to predict.


The Braves Might’ve Fleeced the D-Backs Out of $225 Million

Who got the most out of the Shelby Miller trade?

At the moment, based on present values of prospects, players and wins? It’s the Braves. Based on the industry consensus? It’s the Braves. Based on which team will be better next season? Maybe still the Braves. How did Arizona get so comprehensively fleeced in this deal? There have been some great articles written on FanGraphs these past two weeks about the GM of the Arizona Diamondbacks. Dave Stewart seems to want to do things differently from all other teams, going with his gut when building a roster. Gut decisions can work. His gut identified Shelby Miller as a good player and so wanted him on his team. But wow did this gut decision miss something. How much something? How about 225 million dollars?

That’s right, I am suggesting that, with present values of prospects, players and wins, Dave Stewart, GM, gave away $225M more value in this trade than he got back. See below for how I got to that number.

FanGraphs’ staff have been using a great contract tool recently to estimate the value of major-league free agents. It estimates that players get better each year until aged 27 then worse each year after reaching 31. I’ll be following their method, which estimates an aging curve using WAR where players improve by 0.25 WAR each year in their 18-27 age years, keep steady WAR in their 28-30 age years and get worse by 0.5 WAR each year in their 31-37 age years. It also includes an inflation increase in the market value for each WAR, starting at $8.0M in 2016 and increasing by 5% each year going forwards.  We end up with an estimated value for players over the lifespan of their contract.

I’m going to use last season’s FanGraphs WAR as the starting value for any major-league players (I’ll discuss the minor-league prospects later). I realise I could use ZiPS or many other predictors of players performance (which offer much lower WAR values), but it seems fair as both major-league players in the deal have some issues with their peripheral numbers that seem to balance out. The tool is an estimator based on current performance, so it seems fair we start with what they achieved this last year. Anyway, let’s get started.

The Major Leaguers

Shelby Miller (worth $98.48 M) – to Arizona

Year Age WAR $/WAR Est. Value
2016 25 3.65 $8.0 M $29.20 M
2017 26 3.90 $8.4 M $32.76 M
2018 27 4.15 $8.8 M $36.52 M
Totals   11.7   $98.48 M


Ender Inciarte (worth $172.91 M) – to Atlanta

Year Age WAR $/WAR Est. Value
2016 25 3.55 $8.0 M $28.40 M
2017 26 3.80 $8.4 M $31.92 M
2018 27 4.05 $8.8 M $35.64 M
2019 28 4.05 $9.3 M $37.67 M
2020 29 4.05 $9.7 M $39.29 M
Totals   11.7   $172.91 M


Holy cow! Not looking good for Arizona already. Shocked how much Inciarte is worth by this model? Me too. Those wins get expensive. He’ll do well to keep his performance at this level, but I’d argue that Miller has the same issue.

The Minor Leaguers

This isn’t quite as simple to work out. Minor-league players have a habit of not making it to the majors (an average 70% bust rate of ranked players not making a significant contribution to the major league team, according to this excellent article by Scott McKinney). I have used the valuations on ranked MLB prospects from Kevin Creagh and Steve DiMiceli with a couple of modifications.

Summarised, using historical prospect rankings, they took prospects ranked between 1-100 in the top prospect rankings each year and found the average WAR produced over their first six major league seasons at different rankings. These values are in the table below:

Tier Number of Players Avg. WAR Bust % Zero WAR or less
Hitters #1-10 53 15.6 9.43%
Hitters #11-25 34 12.5 8.82%
Hitters #26-50 86 6.8 31.4%
Hitters #51-75 97 5.0 44.33%
Hitters #76-100 96 4.1 41.67%
Pitchers #1-10 18 13.1 0%
Pitchers #11-25 47 8.1 27.66%
Pitchers #26-50 77 6.3 24.68%
Pitchers #51-75 94 3.4 47.87%
Pitchers #76-100 105 3.5 44.76%

Creagh and DiMiceli were looking at surplus value produced by a prospect. I’m more interested in total value. For each ranked prospect (Blair and Swanson) I found the average WAR produced by historical players with a similar prospect ranking (potentially flawed; I’d probably prefer median WAR for each group), then used an inflation model (again 5% per year starting at $8.0M/WAR in 2016) and an assumption that 2/3 of a prospect’s value is accrued during years 4-6 in the majors to find an estimate for total value.

Finally, some minor-league prospects don’t improve enough to reach the majors (they “bust”) so they aren’t as valuable as major-league players. This reduces the value of the prospect. Lower-ranked players are more likely to bust than higher ones so they should have a greater reduction in their value. The historical likelihoods of a prospect bust are shown in the table above (Bust % Zero WAR or less) for different ranks of prospect (again from Creagh and DiMiceli).  To account for the chance of a prospect bust I reduce their value by a factor of the bust percentage, taken from the table above (% Zero WAR or less). It isn’t perfect, but seems reasonable, I’m happy to discuss in the comments.

Dansby Swanson (worth $137.2M) – to Atlanta

  • #10 prospect currently (on MLB.com)
  • Hitter
  • Worth 15.6 WAR on average in years 0-6
  • Arrives in majors in 2017
  • 33% of value in years 0-3 (at 2018 cost per WAR) – 5.2 WAR – $45.76M
  • 67% of value in years 4-6 (at 2021 cost per WAR) – 10.4 WAR – $105.04M
  • Bust chance of #10 hitting prospect – 9%
  • Estimated total value – $137.2M

Aaron Blair (worth $14.85M) – to Atlanta

  • #61 prospect currently (on MLB.com)
  • Pitcher
  • Worth 3.4 WAR on average in years 0-6
  • Arrives in majors in 2016
  • Assume only lasts 3 years in majors (due to low WAR total)
  • 100% of value in years 0-3 (at 2017 cost per WAR) – 3.4 WAR – $28.56M
  • Bust chance of #61 pitching prospect – 48%
  • Estimated total value – $14.85M

Gabe Speier (worth $negligible) – sorry Gabe – this trade wasn’t about you.

Final value totals

Arizona:

  • Shelby Miller – $98.5M

Atlanta:

  • Ender Inciarte – $172.9M
  • Aaron Blair – $14.9M
  • Dansby Swanson – $137.2M
  • TOTAL – $325M

DIFFERENCE IN VALUE – $226.5M

There are a number of obvious caveats here. Miller could be better than this, Inciarte may not be that good, Swanson may never make it, Blair may never make it. However, at this moment, these are some of the values that you could reasonably ascribe to these assets. This is a staggering loss for Arizona. In what business can you lose $225M dollars in one transaction and keep your job? By this rather flawed measure, the Braves have just increased the value of their organisation by $225M. That pays for half a new stadium. Or Jason Heyward’s recent contract. Or the next 3 years of performance of Mike Trout (Trout is seriously valuable). I realise that the money can’t be accessed like that, but still, wow. Dave Stewart might be using his gut feeling when making deals, but he’d better start listening more to his analytics department or he’s liable to get robbed again.


A lot of the inspiration (it wasn’t plagiarism, honest) for this article came from Craig Edwards and his piece on “Attempting to rationalise the Shelby Miller Trade”. I just took it a different way. Thanks to Craig though! You should read it – http://www.fangraphs.com/blogs/attempting-to-rationalize-the-shelby-miller-trade/


Is A.J. Pollock Really This Good?

A.J. Pollock is, at the moment, one of the best fantasy outfielders in major league baseball.  He’s 4th according to the ESPN player rater but since most of you and I don’t REALLY know what that means, let’s say it a different way.  He is one of only four players with at least a .290 AVG, 10 HR, and 15 SB.  Still, whenever I talk with anyone about Pollock’s performance, the consensus opinion on him is more of a resonating question: “Is A.J. Pollock really this good?”  Let’s attempt to answer that.  Dating back to the beginning of 2014,  Pollock has played in 161 games.  We could round that up to 162 games, especially since players rarely play every single game of a season, and call it a full season, but I’m going to go the extra mile here and pull the last game from his 2013 campaign to have a constant 162 games for this exercise.  The stat line he has produced is impressive.


G   PA   H   AB   R   2B   3B   HR   RBI   SB   BB   K  HBP   SF   AVG   OBP   SLG   OPS
162   657   181   603   99   37   8   18    67   33   46  103    3    4 .300 .351 .477 .827

Let’s lower the bar a little bit so that we can find more players in THIS search: how many other players over their last 162 games have hit at the very minimum: .290, 90 R, 15 HR, 60 RBI, 25 SB?  The answer is 1, and that man is Starling Marte.

  G   PA   H   AB   R   2B   3B   HR   RBI   SB   BB   K   HBP   SF   AVG   OBP   SLG   OPS
  162   652   181   596   90   36    3    22   88   33   36   148     16    2   .304   .358   .485   .843

I’m not sure if that makes Marte a fair comparison.  We can compare them, but Marte delivers more line drives and raw power than Pollock does.  Marte, despite having a paltry 19.3% FB rate, has averaged 312 feet on his fly balls this year, 4th best in the majors, allowing him him to post an absurd 29.5% HR/FB rate – and we’re not even ready to get into park factors yet.  Pollock is just a bit more refined than Marte, posting a better BB rate and K rate than Marte has, by, obviously, swinging at better pitches to hit.

2015   BB%     K%     OSWING%     ZSWING%     SWING%     CONTACT%
  Pollock     7.4   15.6        31.2        59.1      44.3        82.7
  Marte   5.3   24.1        38.9        77.8      56.8        74.5

Pollock, too, has a fine average fly ball distance.  It’s 295 (a number he’s increased each year), which is good for 39th overall, smack dab in between Adam LaRoche to the north and Nolan Arenado to the south.  But Pollock has also been incrementally improving his BB/K ratio over the last three years, bringing it from 0.40 to 0.47 this year.  It could be as simple as that – a good player that has made strides in his approach at the plate, but I can’t just leave it at that.  Despite these improvements, albeit, very small ones, his batted ball profile looks right around league average.


2015   LD%    GB%    FB%    IFFB%    HR/FB    IFH%    BUH%    PULL    CENT    OPPO    SOFT    MED 
Pollock 19.4 51.4 29.1 12.3 13.5 10.5 100 36.7 36.3 27.0 17.4 50.2
League AVG 20.9 45.4 33.6 9.4 10.7 6.7 24.3 39.0 35.6 25.5 18.6 52.9

Pollock is fast, so hitting a lot of ground balls works in his favor.  He’s been able to have higher than average IFH and BUH percentages in each of the last three years because of his speed.  However, despite being a below average line drive hitter this year, and throughout his career, he is less susceptible to BABIP fluctuations than other high frequency GB hitters like Alcides Escobar, Elvis Andrus, Jean Segura, because Pollock produces a hard hit rate higher than the league average – he is an authoritative hitter.  Curious though, that with his below average LD rate, this is the case.  So his hard hit% is driven by either hard contact on fly balls or ground balls relative to league average.  Since he has an IFFB% above league average I’m going to predict that he’s a high authority GB hitter.  There’s logic in that, right?


  2015   GB   AVG     HARD  GB   PULL GB      CENT GB     OPPO GB     FB AVG     HARD FB     PULL FB     CENT FB     OPPO FB  
  Pollock    0.301   23.1   46.9   41.3   11.9   0.234   35.8   19.8   34.6   45.7
League AVG   0.234   17.1   52.9   34.1   13.1   0.223   36.2   22.2   38.0   39.8

He’s right at about league average for hard hit fly balls, but he does seem to have a hard hit ground ball percentage markedly higher than league average.  In fact, his 23.1% hard hit GB rate is 18th best in the league.  The 17 players in front of him have combined for an average line of:

    2015   H   AB     R     HR     RBI     SB     AVG     LD%     GB%     FB%     HARD%  
  Top 17     84   300   41    13     45     3    .280    20.4    44.5    35.1      33.7
  Pollock     100   334   58    11     42    19    .299    19.4    51.4    29.1      32.4

The list also includes names like Tulo, Miguel Cabrera, Posey, Pederson, Upton, Donaldson, Trout, Jose Abreu, and Yoenis Cespedes.  It’s guys that we generally perceive to be hard contact hitters, or I guess, more specifically, power hitters.  But he’s 18th on the list and produced a quality hard hit ground ball rate last year, too.

But, he still has a league average hard hit fly ball rate and a below average line drive rate.  These are reflected in his numbers compared to the league.

  2015     LD%     LD AVG     GB%     GB AVG     FB%     FB AVG  
  Pollock     19.4     0.667   51.4     0.301   29.1     0.234
  League     20.9     0.684   45.4     0.234   33.6     0.223

Lastly, he plays in Chase Field, which, throughout its history, has been a hitters park.  From 2008-2014 it had an adjusted park factor of +111.  For right handed hitters (and left handed hitters) like A.J. Pollock, it has had only positive affects, but this table is solely for righties:

  HR     3B     2B     1B     AVG     OBP     SLG     R  
  1.09   1.45   1.14   1.00    1.04    1.03    1.07   1.11

Put Pollock in a neutral park and his numbers for the last 162 games would theoretically look like this:

  G   PA   H   AB   R   2B   3B   HR   RBI   SB   BB   K   HBP   SF   AVG   OBP   SLG   OPS
162   657   174  603   89   33    6    17    60   31   46   103     3    4   .288   .340   .448 .788

I was kind of hoping to see more signs that Pollock is experiencing more luck.  Not because I don’t like Pollock, I love him as a baseball player and I’m sure he’s a fine person, but because of the questions regarding the sustainability of his play in the first half of the 2015 season by many of my peers.  The answer to, “is he really this good”, is that he is pretty darn close and I can see him performing to any of the projection systems’ expectations the rest of the way (ZiPS, Steamer, or Depth Charts).  He should experience some fluctuation in BABIP because of his GB rate, but so far he really hasn’t – and again that’s partially due to the authority with which he hits them.

In terms of finding a player closest in comparison to Pollock, Marte might be a pretty decent choice.  If I can just brainstorm using the cloud technique, I would probably have, with A.J. Pollock’s name in the middle: Starling Marte, Jason Heyward, Christian Yelich, Charlie Blackmon, Brett Gardner, and Lorenzo Cain as smaller clouds extending off the big, middle cloud.  Here are stats based on the last 162 games played.


PLAYER   PA   H   AB   R   HR   RBI   SB   BB   K   HBP   SF   AVG   OBP   SLG   OPS
Yelich   709   181   628   91    9    56   22   75   155      4    1   .288   .367   .390   .757
Cain   641  180   592   91   11   66  39   37  128      8    4  .304   .351   .448   .799
Heyward   636   163   576   76   12   60  22   51   96      4    4   .283  .343  .403  .746
Blackmon   698   179   628   87   18   66   36   41  123    19    5  .285  .345  .436  .781
Gardner   707   162   611 108   21   72  22   70  147     6    6  .265  .343  .458  .801
Marte  652   181   596   90   22   88  33   36 148    16    2  .304  .358  .485  .843


This group kind of works as a spectrum.  I see the players on the extreme north and south columns least like Pollock and the players in the middle most like Pollock.  There is no one player to compare A.J. Pollock with that is playing currently, although Mitch Webster would be a pretty good historical comparison using his ages 26 – 28 seasons.

Mitch Webster ages 26-28 162 G AVG:

  G   PA   H   AB   R   HR   RBI   SB   BB   K   HBP   SF   AVG   OBP   SLG   OPS
  162   656   165   580   94    15    60   36   62   87      5    5   .283   .354   .441   .795

Probably too high of a walk rate, but that looks pretty good.

The average season of the group above would look like this:

  G   PA   H   AB   R   HR   RBI   SB   BB   K   HBP   SF   AVG   OBP   SLG   OPS
  162   674   174   605   91    16    68   29   52   133     10    4   .288   .352   .437   .789

A little too high of a K rate, but that also looks pretty good.

And finally A.J. Pollock ages 25-27 162 G AVG

  G   PA   H   AB   R   HR   RBI   SB   BB   K   HBP   SF   AVG   OBP   SLG   OPS
  162   618   163   567   89    15     57   25    43   101      3    3   .287   .339   .449   .788

In conclusion, A.J. Pollock is very close to this good if he’s not actually THIS GOOD and I think these players are pretty good comparisons.  And hopefully Pollock has more long lasting success than Mitch Webster.  In a time when speed/power combo players are in decline, what Pollock is doing is clearly elite in that sense.  What I really would like to see would be the history of authoritative ground ball hitters with good speed who have played in parks that have buoyed their power numbers.  Unfortunately, I don’t have access to batted ball profiles for hitters throughout history – how many Pollocks does it take to gather that information?


The NL West: Time Zones, Ballparks, and Social Investing

I think the National League West is the most idiosyncratic division in baseball. Note that I avoided a more disparaging term, like odd or weird. That’s not what I’m trying to convey. It’s not wrong; it’s just…off. Not bad–it’s home to 60% of the last five World Champions, right?–but different. Let me count the ways. (I get three.)

Time zones

EAST COAST BIAS ALERT!

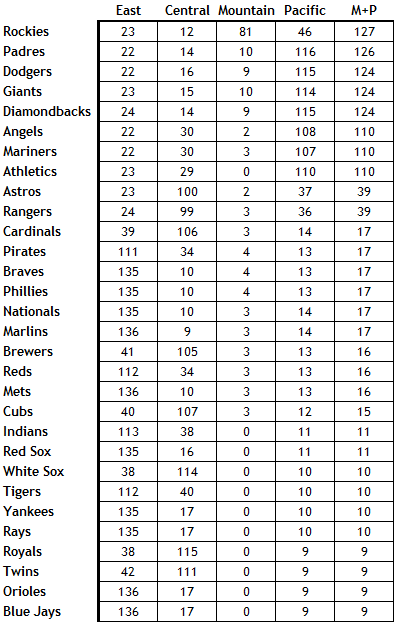
It is difficult for people in the Eastern time zone to keep track of the NL West. Granted, that’s not the division’s fault. But 47% of the US population lives in the Eastern time zone. Add the Central, and you’re up to about 80%. That means that NL West weeknight games generally begin around the time we start getting ready for bed, and their weekend afternoon games begin around the time we’re starting to get dinner ready. The Dodgers, Giants, and Padres come by it naturally–they’re in the Pacific time zone. The Diamondbacks and Rockies are in the Mountain zone, but Arizona is a conscientious objector to daylight savings time, presumably to avoid prolonging days when you can burn your feet by walking barefoot outdoors. So effectively, four teams are three hours behind the east coast and the other team, the Rockies, is two hours behind.

Here’s a list of the number of games, by team, in 2015 that will be played in each time zone, ranked by the number of games in the Mountain and Pacific zones, counting Arizona among the latter:

Again, I’m fully on board with the idea that this is a feature, not a bug. But it’s a feature that means that a majority, or at least a solid plurality, of the country won’t know, for the most part, what’s going on in with the National League West teams until they get up in the morning.

Ballparks

OK, everybody knows that the ball flies in Coors Field, transforming Jose Altuve to Hack Wilson. (Check it out–they’re both 5’6″.) And the vast outfield at Petco Park turns hits into outs, which is why you can pencil in James Shields to lead the majors in ERA this year. But the other ballparks are extreme as well: Chase Field is a hitter’s park; Dodger Stadium and AT&T Park are pitchers’ havens. The Bill James Handbook lists three-year park factors for a variety of outcomes. I calculated the standard deviations for several of these measures (all scaled with 100 equal to league average) for the ballparks in each division. The larger the standard deviation, the more the ballparks in the division play as extreme, in one direction or the other. The NL West’s standard deviations are uniformly among the largest. Here’s the list, with NL West in bold:

  • Batting average: NL West 10.1, AL West 7.2, AL Central 6.5, AL East 5.8, NL East 5.2, NL Central 1.6
  • Runs: NL West 26.5, NL Central 7.9, NL East 6.9, AL East 4.0, AL Central 2.8, AL West 2.7
  • Doubles: AL East 20.3, NL West 11.3, NL East 6.2, NL Central 5.9, AL Central 5.1, AL West 2.9
  • Triples: NL West 50.6, AL Central 49.5, NL East 33.6, AL West 28.3, AL East 27.8, NL Central 11.1
  • Home runs: NL Central 30.2, NL West 23.9, NL East 20.0, AL East 18.7, AL Central 11.3, AL West 11.2
  • Home runs – LHB: NL Central 31.6, AL East 27.4, NL West 25.6, NL East 21.7, AL West 14.7, AL Central 11.7
  • Home runs – RHB: NL Central 32.1, NL West 24.0, NL East 20.0, AL East 14.4, AL Central 13.6, AL West 10.2
  • Errors: AL East 17.7, NL West 12.2, NL Central 11.6, NL East 11.5, AL West 11.2, AL Central 8.2
  • Foul outs: AL West 36.2, AL East 18.3, NL West 16.0, NL Central 15.2, AL Central 13.8, NL East 6.2

No division in baseball features the extremes of the National League West. They ballparks are five fine places to watch a game, but their layouts and geography do make the division idiosyncratic.

Social Investing

You may be familiar with the concept of social investing. The idea is that when investing in stocks, one should choose companies that meet certain social criteria. Social investing is generally associated with left-of-center causes, but that’s not really accurate. There are liberal social investing funds that avoid firearms, tobacco, and fossil fuel producers and favor companies that offer workers various benefits. But there are also conservative social investing funds that don’t invest in companies involved in alcohol, gambling, pornography, and abortifacients. This isn’t a fringe investing theme: By one estimate, social investing in the US totaled $6.57 trillion at the beginning of 2014, a sum even larger than the payrolls of the Dodgers and Yankees combined.

Here’s the thing about social investing: You’re giving up returns in order to put your money where your conscience is. That’s OK, of course. The entire investing process, if you think about it, is sort of fraught. You’re taking your money and essentially betting on the future performance of a company about which you know very little. Trust me, I spent a career as a financial analyst: I don’t care how many meals you eat at Chipotle, or how many people you know at the Apple Genius Bar, you can’t possibly know as much about the company as a fund analyst who’s on a first-name basis with the CEO. So there’s no sense in making it even harder on yourself by, say, investing in the company guilty of gross negligence and willful misconduct in a major oil spill, if that’d bother you.

Note that I said that with social investing, you’re giving up returns. Some social investing proponents would disagree with me. They claim that by following certain principles that will eventually sway public opinion or markets or regulations, they’re investing in companies that’ll perform better in the long run. That’s a nice thought, but social investing has been around for decades, and we haven’t yet hit that elusive long run. The Domini 400 Index, which was started in 1990, is the oldest social investing index. It started well in the 1990s, but has lagged market averages in the 21st century. Now called the MSCI KLD 400 Social Index, it’s been beaten by the broad market in 10 of the past 14 years. It’s underperfomed over the past year, the past three years, the past five years, and the past ten years, as well as year-to-date in 2015. The differences aren’t huge, but they’re consistent. Maybe for-profit medicine in an aberration, but acting on that meant that you missed the performance of biotechnology stocks last year, when they were up 47.6% compared to an 11.4% increase for the S&P 500. Maybe we need to move toward a carbon-free future, but stocks of energy companies have outperformed the broad market by over 100 percentage points since January 2000. I think that most social investing investors are on board with this tradeoff, but some of the industry proponents have drunk the Kool-Aid of beating the market. That’s just not going to happen consistently. In fact, a fund dedicated to tobacco, alcohol, gambling, and defense (aka “The Four B’s:” butts, booze, bets, and bombs) has outperformed the market as a whole over the past ten years.

OK, fine, but what does this have to do with the National League West? Well, two of its members have, in recent years, made a point of pursuing a certain type of player, just as social investing focuses on a certain type of company. The Diamondbacks, under general manager Kevin Towers and manager Kirk Gibson, became a punchline for grit and dirty uniforms and headhunting. (Not that it always worked all that well.) The Rockies, somewhat less noisily, have pursued players embodying specific values. Co-owner Charlie Monfort (a man not without issues) stated back in 2006,  “I don’t want to offend anyone, but I think character-wise we’re stronger than anyone in baseball. Christians, and what they’ve endured, are some of the strongest people in baseball.” Co-owner Dick Monfort described the team’s “culture of value.” This vision was implemented by co-GMs (hey, Colorado starts with co, right?) Dan O’Dowd and Bill Geivett. (OK, O’Dowd was officially GM and Geivett assistant GM, but the two were effectively co-GMs, with Geivett primarily responsible for the major league team and O’Dowd the farm system).

Now, there’s nothing wrong with players who are also commendable people. You could do a lot worse than start a team with Clayton Kershaw and Andrew McCutchen, to name two admirable stars. Barry Larkin was a character guy. So was Ernie Banks. Brooks Robinson. Walter Johnson. Lou Gehrig. All good guys.

But holding yourself to the standards set by the Diamondbacks and Rockies also means you’re necessarily excluding players who are, well, maybe more characters than character guys.  Miguel Cabrera has proven himself to be a tremendous talent and a somewhat flawed person. Jonathan Papelbon has a 2.67 ERA and the most saves in baseball over the past six years, but he’s done some things that are inadvisable. Carlos Gomez, a fine player, second in the NL in WAR to McCutchen over the past two years, has his detractors. Some of the players whom you’d probably rather not have your daughter date include Babe Ruth, Ty Cobb, Rogers Hornsby, Barry Bonds, and many of the players and coaches of the Bronx Zoo Yankees.

I want to make a distinction here between what the Diamondbacks and Rockies did and the various “ways” that teams have–the Orioles Way, the Cardinals Way, etc. There’s plenty of merit in developing a culture starting in the low minors that imbues the entire organization. That’s not what Arizona and Colorado did. They specified qualities for major leaguers, and, in the case of the Diamondbacks at least, got rid of players who didn’t meet them. I don’t know what’s wrong with Justin Upton, but for some reason, Towers didn’t like something about him, trading him away. The Braves make a big deal about character, but of course they traded for Upton, so the Diamondbacks went way beyond anything the Braves embrace.

In effect, what the Diamondbacks and Rockies have done is like social investing. They’ve viewed guys who don’t have dirty uniforms or aren’t good Christians or something the same way some investors view ExxonMobil or Anheuser-Busch InBev. Again, that’s their prerogative, but it loses sight of the goal. Investors want to maximize their returns, but as I said, most social investors realize that by focusing on only certain types of stocks, they’ll have slightly inferior performance. They’ll give up some performance in order to hew to their precepts. Baseball teams want to maximize wins, and there really isn’t any qualifier related to precepts you can append to that.

The Rockies and Diamondbacks were living under the belief that by focusing on only certain types of players, they could have superior performance. It’s like the people who think they can beat the market averages through social investing. It hasn’t happened yet. And, of course, the Diamondbacks and Rockies were terrible last year, with the worst and second-worst records in baseball. Just as social investing doesn’t maximize profits, the baseball version of social investing didn’t maximize wins in Phoenix or Denver.

I’ve used the past tense throughout this discussion. Towers, Gibson, O’Dowd, and Geivett are gone, replaced by GM Dave Stewart and manager Chip Hale in Arizona and GM Jeff Bridich in Colorado. (The Monforts remain.) Last year, the Diamondbacks created the office of Chief Baseball Officer, naming Tony LaRussa, a Hall of Fame manager who’s been less than perfect as a person and in the types of players he tolerates. These moves don’t change that these are both bad teams. But by pursuing a well-diversified portfolio of players going forward, rather than a pretty severe social investing approach, both clubs, presumably, can move toward generating market returns. Their fans, after all, never signed on to an approach that willingly sacrifices wins for the sake of management’s conscience.


Some Optimism for the Arizona Diamondbacks

The Arizona Diamondbacks have the third-worst record in baseball this season, which obviously isn’t a very good thing. But I feel that there are some positive signs for the Dbacks. Or a handful of them, anyway.

Before I begin saying good things about this Arizona team, a disclaimer:

I do recognize that the Los Angeles Dodgers and San Francisco Giants are still in the National League West as well, so it will take a good many things going the right way to make the Diamondbacks do as much as compete with their divisionmates. Even with that, I’m optimistic.

First and foremost: They still have Paul Goldschmidt, and he’s under team control through 2019. Since his first full season in 2012, Goldschmidt has been the second-best first baseman in the bigs. This year, Goldschmidt has been a top-25 player despite missing several games due to injury. Having an All-Star/MVP-caliber/middle-of-the-order-hitting first baseman is a good place to start for a team.

But one excellent player doesn’t make a great team. The old adage is “be strong up the middle,” after all. And Arizona kind of is, or could be.

Of course there is catcher Miguel Montero, who is locked up through 2017. We’ve almost certainly seen the best of Montero already, but he’s still a solid everyday player, at least defensively. And it seems like good defensive catchers pretty much keep being good defensive catchers.

Continuing up the middle, there’s Chris Owings at short. Owings is only 23 and debuted last season. He’s pretty good defensively, has a decent bat with some pop and, despite having only played 72 games this year, has been quite productive.

Again, he’s only played a little more than half a season. But he ranks 14th among all shortstops, and he’s been better than any other one who has played as few games as he has. If we take Owings’ WAR (1.8) for this season and prorate it for a full season (600 plate appearances), he becomes a four-win player. Only four shortstops totaled four wins above replacement last year: Troy Tulowitzki, Hanley Ramirez, Ian Desmond and Andrelton Simmons.

I’m not really trying to suggest that Owings will be as good as any of those four right now or next year or the year after that, but he’s been good so far. And at 23, he’s still got some time to grow.

Center field has been one of the good spots for Arizona. AJ Pollock has been quite good in his limited time, and Ender Inciarte has done well there, too. Inciarte is a defensive wizard, and Pollock was an outstanding hitter this season before going out with a hand injury. We probably shouldn’t expect Pollock to keep this level of offensive production up, but he’ll probably be pretty good. Even if he can’t hit, he put up good defensive numbers last season.

Pollock and Inciarte can play multiple outfield spots, so there’s not a logjam in center, and trading Gerardo Parra away at the trade deadline opened up a spot for the near future.

If Pollock and Inciarte are taking up two spots in the outfield, maybe David Peralta can take the other. Peralta started as a pitcher in St. Louis in 2006, staying in rookie ball for two seasons before eventually blowing out his arm in 2009. From there, Peralta played some independent ball when Arizona discovered him last year. Peralta just turned 27 in August, so he’s still a young guy. Even if he takes a step back in 2015 — and he very well might — he’ll be a piece to have.

A piece of what, I’m not sure. He and other outfielder Mark Trumbo have both probably hit their peaks, and the projections just do not care for either of them going forward. I don’t personally know who provides the Oliver projections, but I must presume Peralta and Trumbo have wronged that person/computer in some way.

Veteran Cliff Pennington has been a good at all over the infield this year, and has provided about as much value as Owings in 20 fewer games. He’s 30 now, so he still has some years left and can provide some good defense at a couple of infield spots, at least.

So it’s a good-looking seven players that will head into next year for Arizona. But the problem hasn’t been those pretty good players as much as it’s been the dead weight that Cody Ross, Jordan Pacheco, Trumbo and Aaron Hill have provided this year.

Odds are that we’ve seen the best of Ross and Hill. Both were good players in their primes, but those primes have passed. Ross is locked up through next season, and Hill will be there through 2016. But Trumbo and Pacheco could both be let go after this year.

Sure, there’s value to having Trumbo. He hasn’t hit for much power this year, but that’s been his calling card in the past. But the Dbacks can’t really put him at first because Goldschmidt is there. And if he plays left or right field, Trumbo is taking a spot away from one of those outfielders. Of course, Peralta could have a poor 2015, and Trumbo would fit in left if that’s the case.

I have no idea if that will happen, though. I can’t tell the future.

Trumbo might fit at third, but he hasn’t played there much. Fortunately for Arizona, third base prospect Jake Lamb has already debuted. While he hasn’t been very good at the big league level, he absolutely crushed pitching in Double-A. Lamb is only 23 and projects to be a plus hitter. He’s probably the future answer at the hot corner.

Now for the pitching.

It hasn’t been good. But there’s hope.

Today, we spell hope “A-R-C-H-I-E,” for Archie Bradley, or “B-R-A-D-E-N” for Braden Shipley, both of whom are top 100 prospects, with Bradley being No. 11 overall. Bradley had a little arm trouble this year, but was absolutely lights-out in Mobile last season. Shipley is completing his first full season of professional baseball, and hasn’t been bad at all. Both guys have fastballs in the mid-90s with other offerings that project to be really good.

Relying on prospects is what I meant when I said, “it will take a good many things going the right way” earlier. For the Diamondbacks to have real shots at success, they’ll probably need Bradley and Shipley to pan out. Bradley should be up sometime next year, and Shipley might come just after him.

As far as pitchers already in the rotation, it’s not ideal at the moment. Trevor Cahill has been a bit of a disappointment since coming to Arizona, but he’s only 26. Wade Miley has been pretty unlucky this year and should get a little better, according to his FIP and xFIP. Josh Collmenter pretty much is what he is, and he is a solid starting pitcher when healthy. Collmenter is 28 and Miley is 27, so there’s a chance that they’ll still get better, or at least stay basically where they are.

So that’s it. That’s my case for optimism for the Arizona Diamondbacks. It hinges very much on three good players (Goldschmidt, Montero, Owings) continuing to be really good and several other players (Trumbo, Pennington, Peralta, all the pitchers) just not being awful.

Perhaps I’m looking at the team with Diamondbacks-colored glasses, but I don’t think I am. Maybe I’m expecting too much from the younger guys in the near future.

Actually, that’s probably it. Still, I like their chances.


Flooring the WBC: How the World Baseball Classic Negatively Affects the Health and Performance of Pitchers

The World Baseball Classic is certainly a noble idea. I mean, what’s not to like about it on paper? You take the best players from each baseball-playing nation and have them battle it out to see which country reigns over the rest of the globe. Can anyone trot out a more thunderous lineup than the USA? Who has the more dynamic pitchers: the Dominican Republic or Venezuela? Does Japan really produce the most fundamentally sound players? Fans all over the world have shown their support for this, as have many players.

All of this would be fine if baseball were like basketball, hockey or soccer; sports where you could wake up, trip over your dog, tumble down the stairs into a pair of cleats, skates or sneakers and play. Those sports employ bio-mechanics the body was designed to handle like running, jumping, kicking and swinging. Baseball, specifically pitching, is not like that. The human arm was not designed to handle the stress and torque put on it by pitching. If you don’t believe me, then I have a few thousand shoulder and elbow scars to show you, including my own.

The lucky few who are able to withstand such actions and be successful are kept on a yearly routine: start throwing in mid-February, build strength and stamina through March before turning up the intensity at the beginning of April. But just like it isn’t wise to turn the ignition on a new Mustang and instantly floor it, it doesn’t seem right to take a pitcher conditioned to ease into a season during Spring Training and tell him to pitch with October-like intensity in March. Unfortunately, this is the case with the WBC.

After looking through the statistics of those who appeared in both WBC tournaments, it is my belief that pitchers who participate in the WBC, especially starters, are far more likely to see a regression in their performance, get hurt or both than pitchers who do not play in the WBC. I reason that the most likely cause is the tournament’s timing disrupts the normal routine of pitchers and their arms are not yet ready to handle the stress and intensity then. With data collected from various sources, I will demonstrate the stark differences between WBC pitchers and their counterparts who did not participate in the tournament, using spreadsheet data and graphs included in this analysis.

***

The pitchers who were included in this study had to satisfy a few conditions. First, pitchers in the WBC group had to have pitched primarily in Major League Baseball in 2005, 2006, 2008 and 2009[1]. Players who played in one year but not another (spent one year in the minors or injured; or retired after a WBC) were not included. For the baseline of starters and relievers, a pitcher who made 10 or more starts for the year was counted as a starter while a pitcher who made 25 or more appearances with nine or fewer starts was counted as a reliever. The “all pitchers” category includes every pitcher who made an appearance during the 2005, 2006, 2008 and/or 2009 seasons.

***

At the heart of it, the key to successful pitching is how good you are in preventing runs from scoring, with ERA and component ERA (ERC)[2] being the primary statistics used to measure this aspect. The MLB’s ERA usually falls between 4.25 and 4.45 in most years, with only small differences from season to season. The last four groups saw small-to-moderate increases in their ERA between 2005 and 2006, but WBC starting pitchers saw a dramatic jump, from 3.75 to 4.48 while the ERC inflated from 4.09 to 4.79. WBC relievers also saw a significant jump in their collective ERAs (3.15 to 3.51), but not only is that only roughly half of what starters experienced, WBC relievers saw their ERC drop from 3.86 to 3.41. Compared against the league-wide ERA/ERC jumps of 0.24 (4.29 to 4.53) and 0.25 (4.18 to 4.43), respectively, the WBC starters’ jumps look even more like one of Superman’s single bounds. A major factor for this spike may be the above-average rise in HR/9 ratios. The average MLB starter showed no increase in his HR/9 rates and all other groups had increases of 0.1, but the HR/9 rates of WBC starters rose by 0.2 (0.9 – 1.1).

Home runs aren’t so bad, just as long as there isn’t anyone on base, but WBC starters were putting more and more runners on in 2006. Starting pitchers saw the highest rise in WHIP out of the five groups. The major league-average increase in WHIP between 2005 and 2006 was 0.04 (1.37 to 1.41), but the average WBC-participating starter saw his WHIP rise double that amount (0.08) from 1.29 to 1.37. Part of that increase was fueled by an up-tick in their BB/9 rates, which climbed from 2.9 to 3.1 (0.2). The most startling changes, though, were with the starters’ rising H/9 rates and falling K/9 rates . While all other groups saw a 0.2 increase in their H/9 ratios, WBC-participating starters’ ratios shot up by 0.5, going from 8.7 in 2005 to 9.2 in 2006. This may be attributed to a pitcher’s prematurely tired arm or improper mechanics from being rushed along during what normally is Spring Training. Either way, the pitches became more hittable, which also showed a decrease in these pitchers’ ability to strike batters out.

Every group I collected data on showed an improvement in their K/9 ratios by 0.2…except for WBC-participating starters. Their K/9 ratios actually fell, going from 7.0 in 2005 to 6.7 in 2006—a drop of 0.3 whiffs per nine innings. A good K/9 ratio shows both how good a pitcher is at retiring a batter without the help of his fielders and how dominant his repertoire is. The higher, the better. When I see that one group’s ratio is regressing while all others are improving, that would make me a little curious as to what may be causing such a downturn, especially with a group as valuable as starting pitchers. If I were in a team’s front office, it would make me wonder if this little event that is supposedly good for baseball is actually harming my pitcher and my team’s playoff chances.

***

Now, this wouldn’t so much of a concern if the pitchers who saw this decline in performance were just hurlers on the wrong side of 30 and/or at the tail-end of their contract, but that’s not a case. Pitchers like Jake Peavy and Dontrelle Willis saw their performances take a dive after participating in the 2006 WBC, while promising up-and-comers like Francisco Liriano and Gustavo Chacin suffered major injuries that year. Two of the more alarming examples are Peavy and Willis, two National League hurlers from pitcher-friendly ballparks who use complicated or violent deliveries.

Peavy seemed out of sorts during the first half of the 2006 season, posting ERAs of 5.17 or worse in three of the first four months. It was during this time that Peavy was also prone to the long ball, serving up 14 of his 23 home runs in April, May and June. The “gopher-itis” lessened once July hit, but then Peavy had a little more trouble finding the strike zone. After issuing no more than eight free passes in each of the first three months, Peavy walked 12 or more batters in every month during latter half of the season. Peavy eventually straightened himself out in 2007, but the same cannot be said for Willis. After nearly winning the Cy Young in 2005, Willis never could establish any consistency in 2006. His WHIP climbed an astonishing 0.29 points from 1.13 (sixth in the NL) to 1.42 (outside the top 30). At the same time, his HR/9 rate doubled from 0.4 to 0.8 while his opponents’ OPS climbed from .644 to .745. Since then, Willis’ regression went from bad to worse and is now viewed as little more than a reclamation project for the Arizona Diamondbacks.

***

Whereas 2006 saw a decline in WBC pitchers’ performance, the 2009 tournament participants saw an even more disturbing trend: a steep drop in their time on the mound. There were only negligible decreases in innings pitched following the 2006 WBC—10.1 percent for starters, 2.6 percent for relievers—but those figures worsened dramatically following this past tournament. WBC starters pitched, on average, 21.1 percent fewer innings in 2009 than they did in 2008 while relievers saw their innings totals drop by 27.2 percent. Houston ace Roy Oswalt saw his streak of five consecutive 200-inning seasons come to an end due to chronic back problems. Cincinnati’s Edinson Volquez appeared in one WBC game, then made only nine starts during the regular season before undergoing “Tommy John” surgery[3].

A second trend I noticed involved those pitchers who were in the playoffs the previous season. Out of the 11 pitchers who appeared in both the ’08 playoffs and the ’09 WBC, eight of them missed time due to injury (or, in the case of Javier Lopez, demotion) or saw an overall regression in their performance. The pitchers from this group who spent time on the disabled list pitched anywhere from 13.5 percent to 80.3 percent fewer innings than they had in ’08. Some of the more notable examples include Red Sox right-hander Daisuke Matsuzaka, whose 59.1 innings in ’09 were the fewest he’s pitched in either Japan or America, and Angels set-up man Scot Shields, who had never been on the disabled list for his entire nine-year big league career.

***

There are more examples of pitchers seeing their fortunes change for the worse after either of the two WBCs, like Bartolo Colon’s shoulder falling apart after rushing through rehab and Esteban Loaiza’s collapse in Oakland in 2006 or how Volquez’s elbow went kaput in the middle of 2009. I won’t list every pitcher who suffered, but my point is clear: the WBC increases the chances for pitchers to suffer injuries, see an across-the-board decline in performance or both. As I stated earlier, I feel the biggest reason for these unfortunate trends is the timing of the tournament. Holding this tournament in the early spring can only damage the health and careers of the players who wish to represent their countries and, in turn, hurt the player’s team both on the field and their long-term organizational plan. I feel the best possible resolution would be to hold the tournament at two different times: have the preliminary rounds during the week of the All-Star Game—while giving MLB, the Japanese leagues and all other leagues a mid-season break—and the final two rounds shortly after the World Series. This way, not only would the careers and health of the pitchers be better preserved, but it would also be highly beneficial to MLB as a whole.

Under the current scheduling, the WBC and MLB has to battle against the NCAA men’s basketball championship tournament for ratings and coverage. Since all other major professional and collegiate leagues are inactive in July, it would allow MLB a better opportunity to drum up interest in the tournament and give less well-known baseball-playing nations a bigger platform to perform. The week off would also benefit the players who are not in the WBC, as they would have had time to recover from injuries and spend invaluable time with family and friends. Lastly, the buzz over a recently completed World Series could carry over to the final stages of the WBC, with story lines from the first phase being built up prior to the resumption of the tournament. Playoff-participating players could have the option of continuing in the tournament or allow other players, who spent most of October resting and re-energizing, to go in their places. Those fresh bodies would also improve the quality of play seen by the fans.

The bottom line is this: the World Baseball Classic is an excellent idea, but is poorly executed in its current form, with pitchers suffering the most damage. Pitchers are the most valuable and volatile commodity in baseball and MLB should do its very best in order to protect that commodity. Even though there have been only two tournaments to study, the numbers are very clear and the logical decision to change should be made.

Michael Echan is a freelance sports writer from New Jersey. Please contact him if you would like to see the compiled spreadsheet data and graphs. He may be reached at mcechan@hotmail.com


[1] Francisco Liriano spent most of 2005 in the minors, but was included because he spent most of 2006 with Minnesota before a season-ending elbow injury in August. Luis Ayala was on Washington’s roster in 2006, but injured his elbow during the WBC.

[2] ERC is a statistic created by Bill James. It takes the number of hits, walks, home runs, hit batters and total batters faced by a pitcher to give an “alternate” ERA that better reflects his performance.

[3] Volquez did pitch a career-high 196 innings in 2008, his first full season in the big leagues, but has had his workload gradually increased during his career. His combined innings progression: 140 in ’05, 154 in ’06, 178.2 in ’07, 196 in ’08.