Estimating Team Wins With Innings Pitched

Throughout the baseball season, I like to estimate teams wins, but I don’t do it in the traditional way. Some time ago, I discovered that I could use innings pitched to get a close estimate. Here’s what I do:

1) Take team games played and divide by 2;

2) Take the team’s innings pitched and subtract the team opponents’ innings pitched;

3) Add 1 and 2.

For example, the Washington Nationals, as of the All-Star break, have played 88 games. They have 789.33 IP, and their opponents have 781.33 IP. So I take 88 divided by 2, which gives me 44. Then I take 789.33 minus 781.33, which gives me 8. Then 44 plus 8 gives me an estimate of 52 team wins. Checking the standings, I see that Washington indeed has 52 wins.

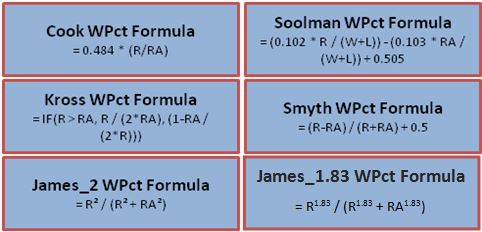
How does my method compare with the traditional Pythagorean? (The Pythagorean method, of course, takes runs scored squared and divides by runs scored squared plus runs allowed squared.) I’ve set up some charts to demonstrate. First, let me present the relevant statistics for all teams as of the All-Star break (all statistics courtesy CBS Sportsline):

Team GP IP IPA R RA
Arizona 89 797 787 446 344
Atlanta 87 783 787.67 405 449
Baltimore 88 782.67 790.67 392 470
Boston 89 794.67 795 431 366
Chi. Cubs 88 785 787 399 399
Chi. White Sox 87 760.33 771.33 397 429
Cincinnati 88 781.67 786.67 424 463
Cleveland 87 768.67 763.67 421 347
Colorado 91 812.33 806.67 461 419
Detroit 87 762.67 766.67 409 440
Houston 89 800 784.33 527 365
Kansas City 87 775.33 775.67 362 387
L.A. Angels 92 817 824.33 377 399
L.A. Dodgers 90 806.33 786.67 463 300
Miami 87 771.67 777 410 429
Milwaukee 91 818.67 809.33 451 406
Minnesota 88 785.67 781 403 463
N.Y. Mets 86 773 775 406 455
N.Y. Yankees 86 768 765.33 477 379
Oakland 89 784 790.67 382 470
Philadelphia 87 775 790.33 332 424
Pittsburgh 89 800.67 802 378 403
San Diego 88 776.33 781 312 440
San Francisco 90 813.33 827.33 431 435
Seattle 90 800 797.67 354 453
St. Louis 88 798 793 402 389
Tampa Bay 90 805 802.33 428 412
Texas 88 783.67 783 444 415
Toronto 88 789 788.33 366 430
Washington 88 789.33 781.33 486 396

Now let me present a chart showing how many teams wins are predicted by my method and the Pythagorean method (for the Pythagorean method, I’m using 1.82 as my exponent, as shown by MLB on their Standings page):

Team EST W (IP) EST W (R) Actual W
Arizona 54.50 54.82 53
Atlanta 38.83 39.43 42
Baltimore 36.00 36.80 42
Boston 44.17 51.07 50
Chi. Cubs 42.00 44.00 43
Chi. White Sox 32.50 40.44 38
Cincinnati 39.00 40.48 39
Cleveland 48.50 51.07 47
Colorado 51.16 49.45 52
Detroit 39.50 40.61 39
Houston 60.17 58.84 60
Kansas City 43.16 40.86 44
L.A. Angels 38.67 43.63 45
L.A. Dodgers 64.66 61.90 61
Miami 38.17 41.71 41
Milwaukee 54.84 49.84 50
Minnesota 48.67 38.47 45
N.Y. Mets 41.00 38.56 39
N.Y. Yankees 45.67 51.87 45
Oakland 37.83 36.20 39
Philadelphia 28.17 33.97 29
Pittsburgh 43.17 41.91 42
San Diego 39.33 30.67 38
San Francisco 31.00 44.62 34
Seattle 47.33 35.07 43
St. Louis 49.00 45.32 43
Tampa Bay 47.67 46.56 47
Texas 44.67 46.70 43
Toronto 44.67 37.59 41
Washington 52.00 52.11 52

My method appears in the second column, and the Pythagorean method appears in the third column, with actual team wins in the last column. My method, as shown above, gives estimated wins directly. The Pythagorean method actually computes winning percentage. To get the estimated wins for the Pythagorean method, I multiplied the team’s estimated winning percentage by the team’s games played.

The methods are pretty close! On a couple of teams, though, the methods miss by a wide margin. I’m way off on the Angels, for example, while Pythagoras is off on the Giants. But which of these methods is closer overall? I did an r-squared between each of the estimated win columns and the actual wins and got these results:

RSQ (IP) RSQ (R)
0.8497 0.7147

Mine’s a little higher, but let’s use mean squared error (MSE) as a cross-check. Here are my numbers:

Team MSE (IP) MSE (R)
Arizona 2.25 3.33
Atlanta 10.05 6.61
Baltimore 36.00 27.05
Boston 33.99 1.15
Chi. Cubs 1.00 1.00
Chi. White Sox 30.25 5.94
Cincinnati 0.00 2.20
Cleveland 2.25 16.60
Colorado 0.71 6.53
Detroit 0.25 2.60
Houston 0.03 1.34
Kansas City 0.71 9.86
L.A. Angels 40.07 1.88
L.A. Dodgers 13.40 0.81
Miami 8.01 0.50
Milwaukee 23.43 0.03
Minnesota 13.47 42.61
N.Y. Mets 4.00 0.20
N.Y. Yankees 0.45 47.20
Oakland 1.37 7.82
Philadelphia 0.69 24.74
Pittsburgh 1.37 0.01
San Diego 1.77 53.77
San Francisco 9.00 112.82
Seattle 18.75 62.92
St. Louis 36.00 5.36
Tampa Bay 0.45 0.19
Texas 2.79 13.70
Toronto 13.47 11.61
Washington 0.00 0.01
AVG 10.20 15.68

I’m not a numbers person, so if I’ve made made errors in my calculations, please let me know, and I will never, ever trouble you fine readers again with another post. But I’ve published previous studies of both methods (in other places, under other names) and have found each time that my method edges out the Pythagorean in both r-squared and MSE.

If my method works at all, it’s because better teams typically have to get more outs to finish off their opponents. If the Dodgers, say, are at home against the Phillies, chances are they’re already winning when they go to the bottom of the ninth, and so the Dodgers don’t have to come to bat. That means the Dodgers had to get 27 outs and the Phillies had to get only 24. Conversely, on the road, if the Dodgers are leading the Phillies, the Phillies have to come to bat in the bottom of the ninth, and the Dodgers have to get the full 27 outs to end the game.

One caveat: my method tends to be more descriptive than predictive, so it’s a better measure of how a team has performed, not a good predictor of how a team will perform in the future. The Pythagorean method is much better as a predictive tool.

So there it is! My estimated team wins method. I hope you find it useful.


Are the Mets in Rebuilding Mode Once Again?

The Mets are the talk of the town…for all the wrong reasons. They currently sit at a 31-41 record and are 12 games behind the Washington Nationals in the NL East, which as of now seems to be theirs for the taking. The Mets boast one of the worst bullpens in the majors and have been plagued by injuries as well as underperformance from the bulk of their lineup. With the results of this season, many are beginning to wonder if it’s time to turn the page on this current pack of Mets players, many of whom were on the 2015 team that lost to the feisty Kansas City Royals in the World Series. I will attempt to go group by group in an effort to determine whether or not the Mets should begin a new rebuilding process, the most dreaded phrase in sports.

Starting with the outfield, Yoenis Cespedes is locked in for three more years in his current contract. It’s understandable why the Mets were looking to sign him in the offseason based on his performance in 2015 and 2016. However, injuries and poor performance have contributed to the current record that the Mets have. Cespedes still won’t lose his spot in left. Curtis Granderson, due to his age, will most likely not be re-signed, as well as Jay Bruce who, if he is not traded before the deadline, will most certainly test free agency. Juan Lagares has been injury-prone the last couple years but the one piece of good news is that Michael Conforto has seen a resurgence since coming back from Triple-A Las Vegas. Also, one of their top prospects, Brandon Nimmo, should receive regular playing time in the outfield, if not this season, then definitely in 2018.

Next, we have the infield, which has been decimated by injuries. Neil Walker and Asdrubal Cabrera have struggled through injuries (and who knows if/when David Wright will ever step on a baseball field again). Jose Reyes and Lucas Duda have mightily underperformed. The good news for the Mets is that Cabrera, Walker, and Reyes will be gone after the season, which means that the infield can get much younger. Top prospects Dominic Smith and Amed Rosario will be September call-ups and, if all goes well, can be regulars in the lineup next year. T.J. Rivera and Wilmer Flores have proven to be reliable pieces in the lineup. Despite some injuries from Flores, he has made up for it with his versatility in both the field and in the lineup, giving manager Terry Collins options to choose from. While Flores and Rivera may not be long-term solutions, they are the best options that the Mets have at the moment. As far as catching is concerned, Travis d’Arnaud is probably the Mets’ best option right now, although he has severely underperformed since being traded to them. The Mets should try to get another catcher in free agency.

Finally, the best pitching staff is a huge question mark, but also a big concern among scouts. Matt Harvey clearly no longer has any interest in remaining with the team and Noah Syndergaard, Zack Wheeler, and Steven Matz are just injuries waiting to happen. Even Jacob deGrom, who has been I believe the best starter this season, has a history of arm injuries that makes Mets front-office personnel nervous. Even Robert Gsellman and Seth Lugo are recovering from injuries sustained during this season. The bullpen has been just as bad. The bullpen so far has logged 257 innings to the tune of a 4.97 ERA. Not to mention they have not had a reliable closer since Jeurys Familia has been both suspended and injured this season, and the rest of the bullpen outside of Addison Reed and Jerry Blevins has been downright horrendous.

Overall, the Mets need to begin the next phase of the rebuilding process. With aging veterans and current players underperforming, it’s clear that the time for a championship has come and gone for this group. The Mets need to get younger and it starts with the old addition-by-subtraction technique. By dumping aging veterans with big contracts, the Mets will be able to allocate their resources and maybe pick up some pieces in free agency while simultaneously giving their top prospects playing time and allowing them to develop. As the great Cosmo Kramer once said on Seinfeld, “I think it’s time that we shut down and re-tool.”


The Free Agent Value of Michael Pineda

Michael Pineda is having by far the best season of his career ever since he broke into the big leagues with Seattle in 2011. This is good news for Pineda who is in a contract year and looking to earn a huge payday on the open market this winter. However, this is bad news for teams, especially the Yankees, who have many questions surrounding their starting rotation with CC Sabathia also in a contract year and Masahiro Tanaka having the chance to opt out of his current contract after the season (although the latter seems unlikely at the moment). Pineda reminds me of one player in particular: former Yankee Ivan Nova.

Like Pineda, Nova has a fastball in the mid-90s and good secondary pitches, including a nasty curve and a change-up which he has begun to develop under Pittsburgh Pirates pitching coach Ray Searage, aka “the pitcher whisperer”. While Nova’s strikeout numbers have gone down, he has learned to pitch rather than just throw, which has resulted in fewer guys getting on base against him as well as his K/BB ratio going down, which I believe have been key contributing factors to his success in Pittsburgh. Also like Pineda, Nova hit the ground running, going 16-4 with a 3.70 ERA in 2011, and he was arguably the Yankees’ second-best starter behind Sabathia. However, as teams began to expose tendencies, combined with mounting injuries, Nova was never able to maintain the same level of success in New York.

The same could be said for Pineda, who missed two full seasons and most of 2014. Even after coming back in 2015, Pineda still struggled to maintain any level of consistency, after posting respectable numbers as a rookie. Now, Pineda has harnessed the power of his wipe-out slider and has become a ground ball pitcher (51.5%) to cope with the home-run haven that is Yankee Stadium. His K/BB ratio has gone down and his WHIP has dropped from 1.35 to 1.13 this season. The formula is simple: the fewer baserunners there are, the better a team’s chances are of winning. Also, like Nova, Pineda is using a change-up more in his pitching repertoire, to complement his slider. As a result, he has generated a 43.3% swing and miss percentage on pitches outside the zone, a 7% increase from last season. Additionally, they are close in age, since Nova was 30 when he signed his new contract, and Pineda will be 29.

The Pirates ended up giving Nova a three-year, $26-million contract last offseason. As long as Pineda continues to have success this season, he will also end up getting a similar deal. I predict he will end up staying with the Yankees for three years for somewhere in the range of$36-39 million simply because the Yankees will be desperate for starting pitching and may even pay a little bit over his market value to keep him. These types of deals are always risky, and many look to the Dodgers signing Rich Hill. However, Pineda has proven that he has always had the talent to pitch in New York and it seems that he finally has his head in the right place to help him reach his full potential. I believe that the Yankees will also re-sign Sabathia to a one-year deal in the range of $5-10 million, considering he will be 37 next season. If the Yankees manage to acquire another lefty or even sign Jake Arrieta, the Yankees starting rotation could be something to look out for in 2018.


Anthony Rizzo Has Changed, Man

For the last three years, Anthony Rizzo has been one of the most consistent hitters in baseball. His wRC+ from 2014-2016: 155, 145, 145. His wOBA: .397, .384, .391. He consistently draws a walk in about 11% of his plate appearances and strikes out in less than 20% of his plate appearances. So far this year? It has been a much slower start, as he’s slashing .231/.371/.448. Though the OBP and SLG aren’t bad, the batting average is tougher to stomach. He’s been just above average with a wRC+ of 114, hardly the numbers the Cubs were expecting from their perennial All-Star. Still, there’s some explanation for all this. For comparison’s sake, we will only be looking at 2016 and 2017. Here’s some charts from Brooks Baseball:

There isn’t an obvious change in approach. He’s swinging at about the same amount of pitches and really is staying inside the zone. In 2017 it seems like he’s swinging more at the low and in pitches but otherwise, same approach. The stats from Baseball Info Solutions and PITCHf/x back this up. He’s in line with his career swing% by both metrics; the difference is in the contact he’s making. By Baseball Info, his O-Contact% is 71.1% up from 68.1%. PITCHf/x also has him at 71.1% up from 66.1%.

This makes me think the quality of the contact is the issue. Here are two videos showing at bats in 2017 and 2016. The focus here is what Rizzo is doing with outside pitches. First 2016, then 2017:

https://baseballsavant.mlb.com/videos?video_id=730449083

https://baseballsavant.mlb.com/videos?video_id=1383639883

In 2016, Rizzo lets that outside pitch get deep to poke it to left field. The 2017 version is early and rolls it over into a shift. Baseball Savant has limited video for 2017 but I’ve seen the same thing and the numbers back it up. Here are two charts showing his exit velocities, 2016 is on the bottom, 2017 is on the top.


It would be easy to say Rizzo needs to do a better job going the other way with the outside pitch, but that’s the main difference I’m seeing this year. Overall, Rizzo’s hard contact is down to 30.4% from last year’s 34.3%, and from his career rate. His pull rate is also the highest in his career, at 53%, vs. 43.9%. Rizzo has been pulling a decent amount of grounders, specifically at a rate of 68.1% with about 78.2% being characterized as soft or medium contact, higher than in 2016. Rizzo faces a shift quite a bit, so pulling grounders isn’t going to help him. He’s hitting line drives at the lowest rate since he was first called up, and down to 15% from his career 20% rate. Take a look at the spray charts below. The first chart is 2017 and the second is 2016. It’s the classic small sample vs. large sample but you can definitely see that Rizzo is not using all fields like he has in the past.


This what confounds me. Despite all this, he still is producing better than average, because his walk rate and strikeout rate are the best rates of his career. So just imagine if his BABIP currently wasn’t .212? I don’t want to say that’s going to raise for sure, but I believe it will get closer to his career rate of .285. This is probably a long-winded way of saying small sample size, so here’s one last thing. This has happened with Rizzo before. In 2016 he had a similar start in March through May, but turned it on for the rest of the year.

Still, this isn’t a simple “It’s been 50 games and he’s been unlucky” that would imply that he’s the same player doing the same things but getting different results. The concern I have is that Rizzo’s doing things differently this year. He’s not using all fields, and he’s hurting his performance by trying to pull pitches and generating weaker contact (his EV is down this year). Using all fields might lead to more line drives and would drive his batting average up to his career norms. Maybe he’s putting pressure on himself after last year’s championship? He’s had success before and I believe he can get back to where he was.


How Aaron Judge Can Turn the Corner

Yankees right fielder Aaron Judge is, to say the least, an imposing figure in the batter’s box. Judge is one of only three position players in baseball history with a height and weight of at least 6’7” and 255 pounds, respectively – the other two, for those curious, being 1960s power hitter Frank Howard and current Tigers minor league Steven Moya – and with his enormous size comes enormous strength. According to Statcast, 59.5% of Judge’s batted balls last season left the bat with an exit velocity of at least 95 miles per hour, a mark that trailed only those of the Brewers’ Domingo Santana and the Mariners’ Nelson Cruz. Further, Judge’s average exit velocity ranked second among the entire league, with only Cruz ahead of him. However, the player comparison that most swiftly comes to mind is the Marlins’ Giancarlo Stanton, who, incidentally, finished third in average exit velocity last season. When Judge truly barrels up the ball, as exemplified here, his raw power tends to elicit the type of awe usually reserved for Stanton.

Unfortunately for the Yankees, Judge was largely unable to capitalize on this strength in 2016. Although he only saw 95 plate appearances, he batted an uninspiring .179 with an astronomical 44.2% strikeout rate. Even his ISO, above average at .167, was still disappointing for a player claiming raw power as his most prominent attribute.

The Yankees, of course, were fully aware that their right fielder’s approach at the plate needed an adjustment. Said Yankees assistant hitting coach Marcus Thames during spring training:

I thought [Judge] started expanding a little too much… At the big-league level, the game’s a little bit more physical, it’s a little bit faster and I thought it sped up on him a little bit and he started expanding.

A cursory look at Judge’s 2016 batting statistics plate surprisingly suggests that plate discipline may not be as big a problem as one would expect based on Thames’ comments. Among 451 position players with at least ninety plate appearances in 2016, Judge’s O-Swing percentage was tied for 119th at 33.6% (27th percentile), and his Z-Swing percentage of 63.5% ranked nearly identically, at 112th (68th percentile).  Judge, surprisingly, rated fairly well in both measures: he chased far fewer balls than the average hitter, and he swung at a healthy percentage of strikes.

His contact rates, on the other hand, did not inspire quite the same sanguinity. Last season, Judge ranked dead last in overall contact percentage, as well as on pitches outside the strike zone. On pitches inside the strike zone, his contact percentage saw a slight improvement relative to his peers, but still ranked 42nd from the bottom. BaseballSavant’s pitch heatmaps suggest that Judge seemed to have the most difficulty with low and away pitches, both in and out of the strike zone. The following graph displays the locations of Judge’s swinging strikes from 2016 (not including foul balls):
2-Judge[A-SwingingStrikes]

As the preceding heatmap illustrates, the crux of Judge’s contact problems occurs in the low-and-away portions in and around the strike zone. However, a heatmap of Judge’s hardest-hit balls (exit velocity >= 100) shows that Judge’s best contact occurs on pitches that aren’t located anywhere near the low and away sections of the zone. In fact, the pitches Judge hits best are on the inside half of the plate:

2-Judge[B-100MPH]

Now, let’s see where Judge’s weaker contact (exit velocity <= 99) falls in the strike zone.

2-Judge[B-99MPH]

So, low and away pitches not only induce a league-leading whiff rate for Judge, but even when he does manage to connect, he connects with his weakest exit velocity. Marcus Thames’ comments, therefore, may require a slight adjustment: Judge didn’t necessarily expand the zone in 2016, but he certainly didn’t make the most efficient use of it. Courtesy of Brooks Baseball, the following graph illustrates Judge’s 2016 whiff rate by zone:

2-Judge[C-WhiffRateX]

From these charts, we can observe Judge’s whiff rate slowly rising from left to right (inside to outside) across the strike zone. To cut down on his high swinging-strike rate, which was the third-highest in the league among those 451 batters, Judge should reduce his swing rate on low and outside pitches – at least, until the count or game situation demands a more aggressive approach. Ahead in the count, however, Judge should look primarily for the middle-in pitches that have produced better and more frequent contact. He shouldn’t even consider swinging at anything on the outer sections of the plate, as he did last season while ahead in the count (heatmap from FanGraphs):

2-Judge[E-AheadInCount]-FanGraphs


As of Tax Day afternoon, the Yankees are only 11 games into the season, so it’s admittedly a bit early to draw any major conclusions. Even so, we should note that Judge has shown signs of legitimate improvement over last year’s campaign. In 33 at-bats, Judge is slashing .276/.364/.621, and although a 175 wRC+, .345 ISO, and 50% HR/FB rate are all but guaranteed to decline, there’s still reason to believe that Judge has made significant strides in his approach at the plate. Last year, Judge saw the 18th lowest percentage of fastballs in the league at 49.8%, a percentage that this season has dipped even further, to 45.5%. Pitchers, expecting Judge to flail as in 2016, have fed him a steady diet of low and away breaking balls. The following chart reflects all off-speed pitches Judge has faced to date in 2017:

2-Judge[D-17Offspeed]

Even with this steady diet of low and away breaking balls, Judge has managed to cut his O-Swing% from 34.9% to 23.9%, and his swinging-strike percentage has fallen from 18.1% to 12.0%. This is especially impressive considering that, like last year, pitchers have thrown him a fairly low percentage of strikes (about 41%).

The Yankees have lots of reason for optimism regarding their young slugger. As the starting right fielder in Yankee Stadium’s less-than-spacious right field, Judge’s value to his team will derive mostly from his batting output. If Judge can consistently lay off of the low and away pitches that gave him problems last year, he’ll have more opportunity to mash the balls that find the inner half of the plate – like this beauty from last Wednesday. If his early 2017 performance is any indication, Judge’s offseason adjustments have the potential to transform him into a Giancarlo Stanton-caliber power hitter.


Prospect Watch: 5 Future All-Stars No One Is Talking About

I chose to stick with hitters in this article, because pitching prospects are extremely difficult to predict, and I think the pitchers who do get the hype are typically deserving. However, I do see a trend of some unnoticed hitting prospects turning out great careers in the majors. Let’s get right to it.

1. Travis Demeritte – 2B – ATL

In 2016, Demeritte went from the Rangers’ to the Braves’ system and spent the entire year in high-A ball, where he dominated at the plate. A 2B with power like Cano, good speed and the ability to get on base is such a rarity.

In my opinion, Demeritte has the highest chance of being a perennial All-Star out of these five prospects. The middle infield in Atlanta has an extremely bright future. I’m predicting that Demeritte will make his splash in 2018, and make his first ASG appearance by 2020 (age 25). Let’s look at his numbers from a season ago:


Name Age G AB PA H 2B 3B HR BB SO SB CS BB% K% OPS ISO wOBA wRC+
Travis Demeritte 21 145 547 635 145 33 13 32 78 200 20 4 12.3% 31.5% 0.905 0.283 0.393 139


Let’s compare these to the four All-Star 2B in 2016 and Brian Dozier.

Name G AB PA H 2B 3B HR BB SO SB CS BB% K% OPS ISO wOBA wRC+
Jose Altuve 161 640 717 216 42 5 24 60 70 30 10 8.4% 9.8% 0.928 0.194 0.391 150
Robinson Cano 161 655 715 195 33 2 39 47 100 0 1 6.6% 14.0% 0.882 0.235 0.37 138
Brian Dozier 155 615 691 165 35 5 42 61 138 18 2 8.8% 20.0% 0.886 0.278 0.37 132
Dustin Pedroia 154 633 698 201 36 1 15 61 73 7 4 8.7% 10.5% 0.825 0.131 0.358 120
Ian Kinsler 153 618 679 178 29 4 28 45 115 14 6 6.6% 16.9% 0.831 0.196 0.356 123


Some things to keep in mind as we compare these players: Demeritte was playing in A+ ball, but he did play an average of 12 less games than these major-leaguers. As you can see, it’s basically a two-man race (other than Dozier’s 42 HRs) between Altuve and Demeritte here. While we cannot expect these A+ ball numbers to translate directly against ML pitching, Demeritte definitely deserves more attention in top-prospect lists. While he’s not quite as speedy as Altuve, he has more power, and he walks at a far higher rate. The one glaring weakness is the K numbers for Demeritte. However, some of the top players in the league K at very high rates. As long as the OPS stays high, it doesn’t really matter how a guy makes outs anymore.

I should note that 2016 was a breakout year for Demeritte; in years past he didn’t quite live up to his potential, and also served an 80-game PED suspension. These could be the main reasons why he hasn’t garnered much attention yet. He still has to prove himself to most. However, I’m sold. I’d pencil him in for the majority of the 2020s’ ASGs right now.


2. Ramon Laureano – OF – HOU

Laureano has all the tools: he can play any OF spot well, he has speed and pop, and he gets on base. Houston’s farm has taken a bit of a hit due to some trades in the last two years, but that’s because they knew they had guys like Laureano who don’t have super high trade value, but have a chance to be great ML players like the guys they traded. Let’s look at Laureano’s 2016 numbers.

Name Age G AB PA H 2B 3B HR BB SO SB CS BB% K% OPS ISO wOBA wRC+
Ramon Laureano 21 128 461 555 146 32 9 15 73 128 48 15 13.2% 23.1% 0.943 0.206 0.418 159


The numbers speak for themselves. This is the making of a star; where is the hype? I know it’s not a huge sample size, and we don’t have much to go off from the previous year either, but in A+ and AA last year he put up those phenomenal numbers you see above.

If those aren’t All-Star numbers, then I don’t know what are. Laureano’s ability to play all three OF spots will keep him in the lineup everyday and help his chances of making it to the ASG. When he does get the call-up, if his numbers stay relatively close to this, there’s no way he doesn’t make three to four All-Star Games. As of now, he’s more of a speed threat, but as he develops, the speed/power combo will even out and he will be an Andrew McCutchen-type player. Keep tabs on this guy.


3. Christin Stewart – OF – DET

While researching Stewart, I couldn’t find an article more recent than September of 2015. There’s no one talking about him…why? As we know, Detroit is aging and looking to deal top players. So, I’m assuming we will be seeing a lot of opportunities for young guys to step up and prove themselves. Detroit’s system isn’t super deep, but that could change anytime if they do decide to move some key pieces. Regardless, I see Stewart as the prospect to watch moving forward; he has the tools to be an All-Star. Let’s check out his numbers from 2016.

Name Age G AB PA H 2B 3B HR BB SO SB CS BB% K% OPS ISO wOBA wRC+
Christin Stewart 22 147 514 622 132 29 2 31 93 154 4 2 15.0% 24.8% 0.883 0.245 0.407 156


The power is impressive, and by this chart he looks even a bit better than the two previous guys I mentioned. However, with the K numbers pretty high up there, and not a whole lot of speed, Stewart is a player that could fall into slumps. Often times, adjusting to the majors can be challenging, and some top prospects never quite figure it out. While Stewart’s MiLB numbers are pretty insane, his slump potential makes him a pretty risky pick here. However, I do believe that if he does indeed figure it out, he will make it to a few ASG and serve as an everyday player in this league for a decade. HRs and BBs get it done. Keep an eye on Stewart.


4. Jason Martin – OF – HOU

Another Houston OF prospect…another future All-Star? I think so. The future is certainly bright over at Minute Maid Park: Altuve is a cornerstone, Correa is a centerpiece, Springer is a baller, and they have prospects for days. If they can just figure out how to pitch, they could be a WS contender for the next eight years.

Why Martin, though? Let’s check out his 2016 numbers from high-A ball.

Name Age G AB PA H 2B 3B HR BB SO SB CS BB% K% OPS ISO wOBA wRC+
Jason Martin 20 121 431 502 114 25 7 23 63 112 22 12 12.5% 22.3% 0.874 0.251 0.382 131


Impressive, to say the least. At just 20 years old, he pumped out 23 homers in 121 games. He walks every eight at-bats, and he also grabbed 22 bags on the season. The ability to walk and run (lol) will typically keep guys out of major slumps. While Martin is not a highly-touted prospect at this point, I think he will be a household name by 2022. I expect him to get the call-up in 2019 and play a significant role during a pennant race that year. In 2020, he will burst onto the scene and prove his worth to this franchise.

With Houston’s current build, this might be a guy we see dealt if they are trying to add talent at the deadline this year. That doesn’t change my prediction, however. I see Martin suiting up for the ASG a few times throughout his career. Stay posted.


5. Tom Murphy – C – COL

You can’t keep putting Yadier Molina in there every year. And with Buster Posey most likely making that change to 1B full-time within three years, Jonathan Lucroy getting dealt to the AL, Kyle Schwarber playing OF, etc, pathways for guys like Tommy Murphy open up. Making the All-Star Game as a C is not saying as much as other positions, in my opinion. A decent hot streak in the first half will inflate your hitting numbers. For example, Derek Norris in 2014. It may seem like he was the best catcher in the league at the halfway point, but, as usual, it evened out by season’s end.

With that being said, Murphy has proven he has pop, and playing in Colorado is a huge advantage for him. While I don’t think he will be a Hall-of-Fame catcher, I do think he’s flying under the radar right now and will probably open some eyes in 2017. I’d say he makes two appearances in the ASG before 2022. However, once he gets up near 30 and he’s no longer playing in Colorado, I think he will have trouble keeping a job.

I have him on the list, first of all, because he meets the criteria, and also because I think people should pay attention to him, and lastly because he’s ML-ready, unlike the rest of these guys. Trevor Story didn’t have a whole lot of hype; most people didn’t expect him to make the team out of spring, but with the Jose Reyes situation, the kid got a shot and as we all know, he ran with it. I’m not saying Murphy will make a cannonball-esque splash like Story, but I think he will turn some heads and maybe even get some ASG votes this year. Anything can happen, especially in Colorado. Keep tabs on him.

Honorable Mentions

Dylan Cozens – OF – PHI

There’s not a lot of buzz surrounding Cozens, which is surprising to me, because usually when we see 40 HR in 134 games, we really perk up. In his age-22 season, he played all 134 games at the AA level for the Phillies affiliate, Reading Fightin’ Phils, a place where most Phillies prospects prosper. The reason why Cozens doesn’t quite make the cut here is because of the words, “future All-Star.” He is one of those lefties that mash in the right ballpark and against RHP, but usually career platoon hitters, even if they are highly effective, don’t make the ASG.

Rhys Hoskins – 1B – PHI

Hoskins is another AA player in the Phillies system. He probably has a little bit more of a well-rounded hitting ability than does Cozens, but he’s a 1B, and that’s an overloaded position. You have to be incredible to crack that ASG squad, and I just don’t think Hoskins will ever be quite at that level. I do believe he will pan out to be an everyday guy for a good amount of time in this league. He has really good power and he gets on base, two things that will keep you in the lineup more often than not.

Bobby Bradley – 1B – CLE

Bradley is another guy I would keep an eye on; I’m just not sold on him yet. He has a a lot of raw power, but a really high K rate in the low levels of the minors. Also, he’s a 1B, so once again, really hard to make the ASG at that position.


dSCORE: Pitcher Evaluation by Stuff

Confession: fantasy baseball is life.

Second confession: the chance that I actually turn out to be a sabermetrician is <1%.

That being said, driven purely by competition and a need to have a leg up on the established vets in a 20-team, hyper-deep fantasy league, I had an idea to see if I could build a set of formulas that attempted to quantify a pitcher’s “true-talent level” by the performance of each pitch in his arsenal. Along with one of my buddies in the league who happens to be (much) better at numbers than yours truly, dSCORE was born.

dSCORE (“Dominance Score”) is designed as a luck-independent analysis (similar to FIP) — showing a pitcher might be overperforming/underperforming based on the quality of the pitches he throws. It analyzes each pitch at a pitcher’s disposal using outcome metrics (K-BB%, Hard/Soft%, contact metrics, swinging strikes, weighted pitch values), with each metric weighted by importance to success. For relievers, missing bats, limiting hard contact, and one to two premium pitches are better indicators of success; starting pitchers with a better overall arsenal plus contact and baserunner management tend to have more success. We designed dSCORE as a way to make early identification of possible high-leverage relievers or closers, as well as stripping out as much luck as possible to view a pitcher from as pure a talent point of view as possible.

We’ve finalized our evaluations of MLB relievers, so I’ll be going over those below. I’ll post our findings on starting pitchers as soon as we finish up that part — but you’ll be able to see the work in process in this Google Sheets link that also shows the finalized rankings for relievers.

Top Performing RP by Arsenal, 2016
Rank Name Team dSCORE
1 Aroldis Chapman Yankees 87
2 Andrew Miller Indians 86
3 Edwin Diaz Mariners 82
4 Carl Edwards Jr. Cubs 78
5 Dellin Betances Yankees 63
6 Ken Giles Astros 63
7 Zach Britton Orioles 61
8 Danny Duffy Royals 61
9 Kenley Jansen Dodgers 61
10 Seung Hwan Oh Cardinals 58
11 Luis Avilan Dodgers 57
12 Kelvin Herrera Royals 57
13 Pedro Strop Cubs 57
14 Grant Dayton Dodgers 52
15 Kyle Barraclough Marlins 50
16 Hector Neris Phillies 49
17 Christopher Devenski Astros 48
18 Boone Logan White Sox 46
19 Matt Bush Rangers 46
20 Luke Gregerson Astros 45
21 Roberto Osuna Blue Jays 44
22 Shawn Kelley Mariners 44
22 Alex Colome Rays 44
24 Bruce Rondon Tigers 43
25 Nate Jones White Sox 43

Any reliever list that’s headed up by Chapman and Miller should be on the right track. Danny Duffy shows up, even though he spent most of the summer in the starting rotation. I guess that shows just how good he was even in a starting role!

We had built the alpha version of this algorithm right as guys like Edwin Diaz and Carl Edwards Jr. were starting to get national helium as breakout talents. Even in our alpha version, they made the top 10, which was about as much of a proof-of-concept as could be asked for. Other possible impact guys identified include Grant Dayton (#14), Matt Bush (#19), Josh Smoker (#26), Dario Alvarez (#28), Michael Feliz (#29) and Pedro Baez (#30).

Since I led with the results, here’s how we got them. For relievers, we took these stats:

Set 1: K-BB%

Set 2: Hard%, Soft%

Set 3: Contact%, O-Contact%, Z-Contact%, SwStk%

Set 4: vPitch,

Set 5: wPitch Set 6: Pitch-X and Pitch-Z (where “Pitch” includes FA, FT, SL, CU, CH, FS for all of the above)

…and threw them in a weighting blender. I’ve already touched on the fact that relievers operate on a different set of ideal success indicators than starters, so for relievers we resolved on weights of 25% for Set 1, 10% for Set 2, 25% for Set 3, 10% for Set 4, 20% for set 5 and 10% for Set 6. Sum up the final weighted values, and you get each pitcher’s dSCORE. Before we weighted each arsenal, though, we compared each metric to the league mean, and gave it a numerical value based on how it stacked up to that mean. The higher the value, the better that pitch performed.

What the algorithm rolls out is an interesting, somewhat top-heavy curve that would be nice to paste in here if I could get media to upload, but I seem to be rather poor at life, so that didn’t happen — BUT it’s on the Sum tab in the link above. Adjusting the weightings obviously skews the results and therefore introduces a touch of bias, but it also has some interesting side effects when searching for players that are heavily affected by certain outcomes (e.g. someone that misses bats but the rest of the package is iffy). One last oddity/weakness we noticed was that pitchers with multiple plus-to-elite pitches got a boost in our rating system. The reason that could be an issue is guys like Kenley Jansen, who rely on a single dominant pitch, can get buried more than they deserve.


2016 Cubs Run Differential

In this post, I take a look at the 2016 Chicago Cubs though their first 100 games. I’ll start out by focusing on the Cubs’ run differential (Runs Scored – Runs Allowed). After a historic start, they reached their pinnacle after the 67th game of the year against the Pirates. At this point, the Cubs were 47-20 and had outscored opponents by 171 runs! Since then, the ball club is 13-20 and their current run differential is at +153.

Still, the Cubs’ +153 mark is 42 runs better than the next-closest team (Washington Nationals). The Cubs and Nationals are the only clubs to have a run differential that is greater than +100. The second-place Cardinals rank third in the league at +95 right now. While the Cubs dominate the top end of the spectrum, the Reds and Braves are running away with the worst run differentials in the league. The Reds have a -143 mark, largely due to the thrashings they have taken at the hands of the Cubs so far in 2016. The Braves have the second-to-worst differential at -134 runs.

Projected Runs to Wins

In another place, I introduced the “Pythagorean Theorem’s of Baseball” which basically tries to determine the number of games a team will win based on their number of runs scored and number of runs allowed. Here are the formulas for six of the most common win-percentage projection formulas:

I added up the Cubs’ total runs scored and total runs allowed after each game this year and compared their actual number of wins to the projected number of wins based on each formula. These charts visualize the differences between those numbers.

This matrix summarizes how accurate each of the projection formulas has been in predicting the Cubs’ winning percentage and total number of wins so far in 2016. The most accurate formulas was the James_1.83 followed by the James_2 and Soolman. Four of the six formulas were very good predictors, but the Cook and Kross formulas overforecasted the number of wins that they expected the Cubs to have. Notice that at one point this year, each of those formulas projected the Cubs to have over 15 more wins than they actually had. The R^2 value (coefficient of determination) is indicative of how well the projected win percentage matched up to the actual win percentage after each game this season.

All in all, the Cubs have should have at least six more wins this year based on these formulas. Scoring as many runs as they have (4th most in the MLB) and allowing as few runs as they have (T-1st in the MLB) should result in an even better record than 60-40. We knew it was unlikely that they would keep up their record-setting start in the run-differential category, but it will be interesting to see how these numbers match up as the season progresses.

@CubsAdvMetrics on Twitter


Exploring Uncharted Territory with Leonys Martin

Edit: Since this piece was submitted (May 23), several developments in the Martin narrative have arisen, notably some more astute analyses than mine (namely Jeff Sullivan’s great piece on Martin’s batted-ball profile & an extremely in-depth look at his swing mechanics by Jason Churchill over at ProspectInsider, do go check him out) as well as this walk-off dinger against the Oakland A’s. 


A lot has gone right for the Seattle Mariners in new GM Jerry Dipoto’s first season. At time of writing, they sit in first place in the AL West with the third-best record in the American League and the best road record in baseball. One potential factor in Seattle’s success that has, until recently, taken a backseat to Robinson Canó‘s resurgence and Dae-Ho Lee’s power-hitting heroics is the sudden onset of what could turn out to be an offensive breakthrough for outfielder Leonys Martin.

The Mariners’ acquisition of Martin and Anthony Bass in exchange for Tom Wilhelmsen, James Jones, and a PTBNL (Patrick Kivlehan) is one of several moves last offseason that seem to follow a common guiding principle: bring in players who’ve struggled in recent seasons but demonstrated real value in seasons past. This category includes the likes of Steve Cishek and Chris Iannetta, both of whom seem to have (thus far) rebounded from uninspiring 2015 campaigns.

Meanwhile, Leonys Martin is having the best season of his life. This is mostly remarkable due to the fact that his hitting isn’t, and has never really been, the source of his value. He’s never topped 89 wRC+ in any season, and his career high for home runs in a year is eight. He’s also been historically abysmal against left-handed pitching. From 2012-15, Martin slashed .233/.274/.298 with 53 wRC+ against southpaws; no outfielder in baseball posted fewer wRC+ in that same span (min. 300 PAs). His poor performance in the second half of 2015 (.190/.260/.190 with 22 wRC+ after the All-Star break) earned him a demotion in early August. That lackluster second half, coupled with the emergence of Delino Deshields Jr. as a capable replacement, made it a lot easier for the Rangers to part with him in the offseason (incidentally, DeShields was demoted in early May and Wilhelmsen has been the worst reliever in the majors this year by fWAR, so that’s something).

Going into this season, Steamer projected him for around 492 PA with a .241/.292/.350 slash line and 79 wRC+, in addition to eight homers and 22 stolen bases, putting him on course for 1.2 fWAR. While not exceptional, this likely would have been an adequate season for Jerry Dipoto given the cost, especially at Martin’s $4,150,000 salary, but Martin’s already managed to match that mark, posting 1.4 fWAR as of May 23rd, and he’s providing a great deal of that value with his bat.

Martin seems to have shook off a bit of whatever seemed to be plaguing him at the tail end of 2015. He’s slashing .252/.331/.467, which would, over a full season, leave him with a career-best OPS of .798 and 124 wRC+. He still hasn’t been able to hit lefties, but that’s what platooning is for. But by far the most eye-popping aspect of Martin’s game this year is what looks like a sudden influx of power. Martin’s mark of .215 ISO is easily the best of his career — his eight home runs have already matched his career-best single-season total — and it’s not even June yet. With no context, one could look at Martin’s line thus far and notice that he might be on pace to post a 30 HR/30 SB season, if not for the slight inconvenience called “At No Point In His Career Has Martin Demonstrated That He Might Even Touch 30/30”. And yet this is baseball, and this is 2016, the Year of the Bartolo Colón Home Run. Anything is possible.

So — what’s changed for Martin? And perhaps more importantly, where the heck did all these home runs come from?

We turn first to Martin’s batted-ball profile. For the last two-and-some seasons, Martin’s fly-ball percentage has actually increased. His 2015 mark of 33% was actually a career-best at the time, especially considering it was brought down by his abysmal second half. He’s picked it back up in 2016, with a gaudy 45% fly-ball rate. Of course, the sustainability of this figure is questionable (one might also point out Martin’s likely inflated HR/FB rate of 20.5% — opposed to a current league average of 12.1%), but at no point in his career has Martin hit fly balls with such consistency:

Other indicators of improved power add credence to this positive trend. Martin’s quality of contact also seems to have improved this year, as his hard-hit ball rate of 34.4% is vastly superior to his pre-2016 range of about 23 – 25%. It’s also true that home/road splits affect the narrative somewhat, as only one of his eight home runs occurred at Safeco Field. But I suspect that there may be more to Martin’s offensive resurgence than just hitting balls harder.

One of the feel-good narratives of this season is the positive influence that new hitting coach Edgar Martínez has introduced to the Mariners offense, which currently ranks 2nd in the AL in runs scored. Martinez was brought in to replace Howard Johnson in June 2015, hoping to fix an anemic Mariners offense that struggled early and often. To date, that new appointment has been received with praise from Seattle media and fans, but more importantly from the players themselves. Could it perhaps be the case that Edgar’s tutelage, along with Jerry Dipoto’s promise to mold the 2016 Mariners to fit his “Control the Zone” philosophy, has brought about a positive change in the way Leonys Martin approaches hitting?

Overall, Martin’s plate discipline metrics show that his approach at the plate hasn’t changed too drastically from last season. If anything, his 70.4% contact rate is his lowest since 2012. One other thing sticks out here, namely that Martin seems to be more patient on pitches out of the zone and more aggressive on pitches in the zone. Compare the percentage of pitches he swings at in 2015 (left) to 2016 (right), courtesy of BrooksBaseball.net:

There is a relatively noticeable difference here, especially on high and outside pitches. According to PITCHf/x, his O-Swing% of 27.9 is easily the lowest of his career. Likewise, his Z-Swing% of 67.0 is his highest since 2012. These are generally good indicators that Martin is seeing the ball better or, at least, cut down on his tendency to chase pitches out of the zone.

And then there’s the matter of his batting stance.

Take a look at his stance for this home run on May 27, 2015, facing off against Scott Atchison:

Now check out his stance almost a year later, on May 22, 2016 in this at-bat against John Lamb.

An important thing to note about these stills is that I picked them mostly because of their similar camera angles. Martin’s foot position in other highlights is often obscured by the pitcher, or the pitcher is already in the middle of his wind-up, giving Martin time to square up before the pitcher’s delivery (as is slightly apparent in the at-bat against Lamb). But the vast majority of video evidence from this season is consistent with the idea that Martin has generally closed off his stance and now begins pretty much every at-bat with his feet squared to the pitcher. Now, I am aware that the batting stance is a rather fluid component of any baseball player’s oeuvre and can change for a number of reasons, not all of them being deliberately engineered to improve performance. I can’t seem to find anything about Martin having changed his stance online, aside from this ESPN piece from February of this year — but the focus of that article is on a legal issue Martin dealt with over the offseason, and the only comments offered on Martin’s approach seem to indicate that his stance hadn’t actually changed:

Martin also worked with a hitting instructor during the offseason in Miami. He altered his approach at the plate — his stance remains the same, he said — and he was pleased with the results when he faced pitchers in winter ball.

The most significant changes I’ve noticed as a result of comparing film from 2015 to film from 2016 are the aforementioned foot positioning and the fact that his hands are a little bit closer to his body this year. Generally speaking, though, it’s hard to really quantify the connection between a player’s stance and his performance. If this change in stance is deliberate, we can only really speculate as to the reasoning behind it. There are certainly good reasons to make the adjustments Martin has made. Bringing the hands closer to the body is often a nice starting point for a player who wants to make his swing a little more compact and less erratic. As for the foot positioning, there are a few benefits to batting with an open stance, especially for a left-handed hitter. One is that it enables left-handed hitters to see the ball better, especially when facing a left-handed pitcher. Another is that it eliminates the problem of the front foot stepping away from the plate on the swing, as batting from an open stance requires you to bring your front foot towards the plate in order to square up to hit the ball. It’s hard to say if Martin has previously had this issue in the past, but the fact that he’s changed from an open stance to a square stance likely indicates to me that whatever advantage he gained from an open stance may no longer be necessary. We don’t know if Martin has made these adjustments for the reasons listed above or if he has made them for any real reason at all, but he’s still made them all the same, and as it happens, they’ve been working out quite nicely for him.

That said, let’s not go overboard about a quarter-season of statistics just yet. Though Martin is posting career bests in almost any meaningful batting metric, there is still reason to believe he might still turn out to be an average or below-average hitter for the rest of the season. His on-base record is rather inflated by recent performances, he strikes out too much, and he continues to sport uninspiring numbers against left-handed pitching. All the same, his eight home runs this season aren’t going away, even if his fly-ball rate might. It’s unlikely, barring injury, that he’s not going to hit any more home runs for the rest of the year, so 2016 will most likely be a career year for him in the power department, and if his BABIP mark of .302 this year can regress back to his 2013-14 average of .326 rather than his poor 2015 mark of .270, 2016 may turn out to be a career year for him across the board. Martin’s offensive production has certainly been a pleasant surprise for the Mariners, and it would be interesting to know if altering his batting stance was a deliberate factor in producing an improved approach at the plate. If the Leonys Martin we’ve seen so far this year is anything like the Leonys Martin we’re going to see for the rest of the year, Jerry Dipoto may have stumbled upon a surprisingly high return on what was initially a low principal investment.


Started From the Bottom, Now We’re…Average

2015 was the year of Bryce Harper. He led qualified hitters with a 197 wRC+, the highest since the turn of the century among players not named Barry Bonds. This was a vast improvement on his already-impressive 2014 season, in which he totaled a 115 wRC+.

Depending on how you look at things, you could say Bryce Harper was the most improved batter in 2015. I choose not to for two reasons: 1) it’s too easy, and 2) it makes this article more fun. There’s also another more objective reason: with only 395 plate appearances in 2014, Harper didn’t qualify for the batting title.

This poses a question: what minimum do we set to determine who improved the most between 2014 and 2015? If we say that the player needed to qualify for the batting title each year, we get Chris Davis as the most improved batter, who increased his wRC+ from 94 in 2014 to 147 in 2015. If we set no minimum, our wonder-boy is none other than notorious slugger Carlos Torres, the Mets pitcher who upped his wRC+ from -100 to 491.

Clearly, there needs to be some minimum. For the purpose of the article, I’ve decided to set it at 100 PA. This seems a reasonably small enough number to include a wide array of players, but large enough to get rid of anomalies (I’m looking at you Carlos). When we set this minimum, we discover that the batter whose wRC+ increased the most between 2014 and 2015 is… Ryan Raburn. However, since Jeff Sullivan already talked about Raburn, I decided to go with the next name on the list: J.B. Shuck.

If you don’t know who that is, I don’t blame you. I didn’t until I started this research. If you do know him, I’m going to guess that you’re either a White Sox, Indians, or Angels fan. Either that, or you have more time to watch baseball than a college student taking a full course-load of credits. Who’s to say?

The reason the casual fan might not know Shuck is because, well, he’s not exactly a star player. Here are the players with the lowest wRC+ in 2014 of those with at least 100 PAs:

That’s right, he was literally the worst batter that year. Almost as bad as if I were to join the majors. It should be no surprise, then, that he was able to improve so much — he had the lowest starting point. Even so, he still had needed to improve quite drastically in order to surpass Harper’s wRC+ improvement. And that’s exactly what he did:

In 2015, Shuck improved so much that he almost managed to be an average player. But how did he manage to do it? Was it a matter of luck, or did he actually get better?

The number that stands out the most in Shuck’s 2014 season is his .146 BABIP (batting average on balls in play). For those of you that don’t know, that number is quite bad. Like, less than half of what it should be. His BABIP in other seasons is right around league average, so something must have gone amiss last year. Looking at the underlying numbers, some things showed up:

So. His FB% and Pull% numbers were way up as compared to other years. For some context, the league-average FB% has been approximately 34% the past two years, while Pull% has been approximately 40%. These numbers suggest that Shuck spent too much time trying to pull the ball over the fence two years ago, and the video suggests the same thing. Here’s an example of him trying to do just this to a pitch on the outside corner, but instead weakly grounding to first. You can see how he opens his hips before he even starts his swing, forcing him to simply slap at the ball if he wants to make any contact:

And here he is in 2015, driving a similar pitch into left field:

The cause of his change in approach is hard to say. He did get a new hitting coach to start off the year, switching from Jim Eppard to Don Baylor. From 2013 to 2014, the Angels as a team increased their FB% from 33% to 34% and their Pull% from 37% to 42%, so that argument does have some merit. Regardless of the reason, it’s clear that it had an effect. Here’s Shuck’s ISO by zone:


As can be seen on the left, Shuck had trouble hitting anything not on the inside edge of the plate in 2014. This past year, he learned to control more of the strike zone, and even though there’s less red than there was in 2014, there’s also a lot less dark blue. Shuck drove the ball from all parts of the zone to all parts of the field, and his numbers improved because of it.

While Shuck may not be an All-Star anytime soon, his year-to-year improvement is truly remarkable. If he can go from being the worst hitter in baseball to an average one, anyone can. And if that doesn’t inspire the Brendan Ryans of the world, I don’t know what will.