The New* Eddie Butler

Eddie Butler has been a different pitcher in 2017. Through four starts with the Iowa Cubs, he is sporting a shiny 1.46 ERA, a far cry from his career 6.50 ERA after years of turmoil in the Rockies organization. The story here is an easy one to latch on to: top-shelf pitching prospect gets devoured by an offense-heavy ballpark, gets traded to the Cubs, becomes a bona fide ace. It’s the same backstory as Jake Arrieta’s, and the early returns are pointing to the same conclusion.

I am here to disagree. The further I looked into his underlying stats, the more I realized that Eddie Butler still needs to make a serious change if he wants to have any big-league success. In 2017, the “new” Eddie Butler is really the same old Eddie Butler masked by some small-sample good fortune.

Butler has never been a big strikeout guy, so he has to limit walks to survive. While his 2017 walk rate is below his career average, his strikeout rate has dipped as well, leading to a K-BB% of 3.0%. That is not good, and unfortunately, it is right in line with his career mark of 3.3%. The most recent qualified starting pitcher to post a lower K-BB% was 2012 Ricky Romero who had a K-BB% of 2.3%…which was accompanied by a 5.77 ERA. Pitchers with this profile don’t accrue very many innings, and when they do, the results show why.

If you are walking guys without striking them out, you better keep the ball in the ballpark, and Eddie Butler has definitely done that this season. He has yet to give up a single home run in his time with Iowa. David Laurila recently chatted with the right-hander about his new approach, which involves driving the ball downhill and getting back to his two-seamer, while the Rockies always prioritized his four-seamer. This new approach sounds like a recipe for a successful ground-ball pitcher, and it would explain the new ability to limit home runs. But, hold on, Butler’s career FB% is 28%, and his 2017 rate has skyrocketed to 41%, which doesn’t fit the rest of the narrative. Allowing this many fly balls is not a good sign for Butler, who has always had a bit of a home-run problem, as his career HR/FB rate sits at 18% (and no, that’s not just Coors Field – since the installation of the humidor, Rockies pitchers have posted a HR/FB rate of 11.6%). When I look at Butler, I don’t see a guy who found success with a new approach; I see a guy who is prone to home runs with a massive spike in fly-ball rate.

Butler’s success at limiting home runs thus far has allowed him to strand runners at a rate that is screaming for regression: his LOB% of 86.7% would be the highest mark for a qualified starter since Dwight Gooden in 1985. Opposing teams haven’t been able to string hits together against Butler, but that tends to even out over time, especially considering the fact that Butler’s career LOB% is below league average. When you don’t strike guys out, the ground balls eventually find holes, the fly balls eventually leave the yard, and the walks start to come around to score.

To be fair, I have not seen footage of Eddie Butler pitching this year. He might be making guys look foolish, and he might be on the path to becoming the next king of soft contact; if you have watched him pitch first-hand this year, please feel free to share your observations. He does still have the pedigree and he seems to have the work ethic to go with it, and it would make an incredible story if he could put it all together.

After all, Eddie Butler is a professional baseball player, and I’m just a guy with some spreadsheets. But right now, the spreadsheets are telling me to seriously pump the brakes on the Arrieta comps – underneath the ERA, this still looks like the same Eddie Butler.


The Astros Might Not Need a First Baseman

A little over two weeks ago, Dave Cameron suggested here that the Astros might need a new first baseman. Last summer, they transitioned newly-signed Cuban prospect Yulieski Gurriel from third to first in hopes he would solve the Astros’ continual first-base issues. Gurriel did not live up to expectations, to say the least. In short, he displayed poor plate discipline as an extremely aggressive hitter, but did not hit the ball with enough authority to overcome his plate approach deficiencies (You can get the more detailed version in Cameron’s article).

However, since the exact day the article was released on April 11, Gurriel has been on a tear. He has accumulated 23 hits in 54 plate appearances, including five doubles and two long balls, to go along with eight runs scored and seven RBI. So, what has Gurriel changed recently?

In his 165 plate appearances in 2016 and up until April 11th, Gurriel posted an absurd 42% O-Swing%. The MLB average is just 29%. He paired that with a 76% Z-Swing%, nine percentage points above average. Gurriel was swinging at anything and everything thrown his way. Since then, he has lowered his O-Swing% to 34% and his Z-Swing% to 68%. Gurriel is showing much improved plate discipline, something he was vaunted for while playing in Cuba. It has not resulted in walks, as Gurriel has drawn only one walk since April 11th, but there is evidence as to why. Let’s look at this rolling average graph of Gurriel’s O-Swing% and Zone% across his career. As Gurriel has continually swung less at pitches out of the strike zone, the number of pitches he is seeing in the strike zone has grown. With more pitches in the zone, he has had less opportunity for walks.

Gurriel has taken advantage of the increase of strikes thrown his way. On his swings at pitches in the zone since April 11th, Gurriel has made contact 97% of the time. The MLB average for Hard% of batted balls from 2016-17 has been roughly 31%. Pre-April 11th, only 27% of Gurriel’s batted balls were hit hard. Post April 11, that number has skyrocketed to 44%. Gurriel is picking his spots now, and when he does decide to swing, he’s making contact. And hard contact.

Previously, pitchers were attacking outside of the zone, knowing Gurriel would swing and produce weak contact. With his decrease in aggression, pitchers have been forced to throw over the plate. Gurriel is sitting on good pitches to hit now, allowing him to make hard contact. The walks have not come yet, but if he continues to play like this, pitchers will learn not to throw in the zone to him. We are dealing with a relatively microscopic sample size here, but players don’t dramatically decrease their aggression just by chance. Gurriel’s current hitting is clearly unsustainable, as he is running a 253 wRC+ since April 11th, but if he continues to show the patience he is playing with right now, don’t expect him to revert back to pre-April 11th Yulieski Gurriel.

So, in summary, what has Gurriel changed?

Not a ton, it appears. He has simply just hit with more patience, which has trickled down into the rest of his game. Gurriel always had the ability to barrel up balls, but he was not showing it because he was not swinging at the right pitches. If Gurriel keeps doing what he’s doing, the Astros definitely won’t need a first baseman.


The Jose Altuve Adjustments

Out of the many differentiae that make up José Carlos Altuve’s thumbprint on baseball, from his 5’ 6” stature, to getting cut from his first tryout with the Astros but showing up the next day anyway, his groundball percentage would likely not rank toward the top for most fans of the Venezuelan. However, most of said fans have not seen this graph.

As you can see, after decreasing his rate consistently for four seasons, Altuve is hitting more groundballs and hitting more balls toward right field in 2017 than at any other point in his career. Although this is in a sample of just 88 plate appearances, and may be a statistical blip, I think that with a hitter like Altuve it is worth investigating.

Altuve’s BABIP is also a high, even for him, .393. Apart from being the most satisfying stat to say out loud, BABIP is also the one thing that alters early-season statistics more than any other, but .393 for Altuve isn’t like the clearly unsustainable .455 that Steven Souza Jr. is currently running. It’s just .044 points higher than his last season rate, so while it’s probably not sustainable (DJ LeMahieu led the league in BABIP last year at .388) it’s not lifting him to his 134 wRC+ by itself.

So what’s the reason for this? Is it a change in approach? A reaction to what other teams are doing? Teams don’t appear to be shifting Altuve, so it doesn’t look like he’s trying to beat them by hitting grounders through an open hole. It does, however, look like maybe teams are attacking him down and away slightly more than in the past. Here are Altuve’s heat maps the last two seasons.

2016

2017

There does appear to be a slight uptick in balls in the bottom corner of the zone, but it’s hard to call it a novel trend when the basic strategy against Altuve since he came into the league remains basically the same: down and away.

But the story doesn’t end there! There are two things that do appear to be starting a trend.

First, his Zone% (meaning the percent of the time that opposing pitchers throw him a strike) has been consistently trending downward since he came into the league. It’s currently at 46% according to Trackman, which is the lowest mark of his career.

Second, his Fastball%, according to Baseball Info Solutions, is at 49.7%, which is also a career low, and actually over 8 percentage points lower than the rate he’s seen in his career.

Now, this all makes intuitive sense. Altuve’s power has risen in recent seasons, and it looks like pitchers have adjusted accordingly; no surprise there. What I thinks is worthwhile in all this is that Altuve is adjusting right back. Before this past weekend in Tampa Bay, Altuve had no home runs on the year. He’s been going with what pitchers have been throwing him. They want to throw him offspeed down and away, and he’s been going with it, exchanging some of the power he took last year to keep his overall offensive profile as one of the league’s elite hitters.


The 2016 Strike Zone and the Umpires Who Control It

Introduction

One of the most-discussed issues in Major League Baseball is the consistency of the strike zone. The rule-book strike zone states “The STRIKE ZONE is that area over home plate the upper limit of which is a horizontal line at the midpoint between the top of the shoulders and the top of the uniform pants, and the lower level is a line at the hollow beneath the kneecap. The Strike Zone shall be determined from the batter’s stance as the batter is prepared to swing at a pitched ball.” After watching games throughout the regular season and playoffs, it is easy to realize this is not the strike zone that is called. Each umpire has tendencies and dictates his own strike zone and how he will call a game. With the rise of PITCHf/x and Trackman in the last few years, umpires have been increasingly monitored and judged for their accuracy and impartiality. For this reason, umpires are criticized for incorrect calls more than ever before and I believe are now trending towards enforcing the rule-book strike zone more than in years past.

The purpose of this research will be to do two things. First, I will focus on identifying overarching themes where I look at finding how umpires are adjusting to modern technology but also how the rule-book strike zone is not the strike zone we know. After this, I will dive into a few umpire-specific tendencies. The latter would be helpful to teams in preparing their advance reports by knowing how certain umpires call “their” strike zone dictated by situations in a game.

Analysis

Using PITCHf/x downloaded through Baseball Savant, I have looked at major-league umpires since 2012 in regards to their accuracy in correctly labeling pitches, primarily strikes, and their tendencies dictated by specific situations. While the height of the strike zone is often influenced by the height of the batter, there are other factors to take into account such as the how the batter readies himself to swing at a pitch. Unfortunately, the information publicly available to conduct this research does not include the batter handedness, pitcher name, or measurements of individual strike-zone limits. For this reason, a stagnant strike zone serves our needs best. The height of the strike zone shall be known as 1.5 feet from the ground to 3.6 feet from the ground. This is the given strike zone of a batter while using the pitchRx package through RStudio when individual batter height is not included.

All PITCHf/x data is from the Catcher/Umpire perspective, having negative horizontal location to the left and positive to the right. The width of home plate is 17 inches, 8.5 inches to both sides where the middle of the plate represents 0 inches. After calculating the average diameter of a baseball at 2.91 inches, we add this to the width of the plate. Therefore our strike-zone width will be 17 + 5.82, or 22.82 inches. The limits we will then set are going to be -.951 to .951 feet (or 11.41/12 inches). Throughout the paper I will be referring to pitches that fall within the boundaries of our zone as “Actual Strikes” and pitches correctly identified as strikes within this zone as “Correctly Called Strikes.”

Called Strike Accuracy By Year

As Table 1 shows, correctly identifying strikes that fall in the parameters of the rule-book strike zone has risen substantially. While 2015 has a higher percentage of correctly called strikes, 2016 PITCHf/x data from Baseball Savant was incomplete, with 28 days’ worth of games unavailable at the time of this research. A rise of 5.90 percent correctly called strikes from 2012 to 2015 shows the rule-book strike zone is being more strictly enforced.

table-one

While this provides some information, we can also look into where strikes are correctly being called using binned zones. Understanding that the evolution of umpires over the last five years is taking place and trending toward correctly identifying strikes more today than in years past, we can analyze where, in the strike zone, strikes have been correctly labeled.

Called Strike Accuracy by Pitch Location

In Table 2, we can see a tendency among umpires. Strikes are called strikes more routinely over the middle of the plate and to the left (from umpire perspective). As I have mentioned before, the publicly available PITCHf/x data I used did not include batter handedness and I am unable to determine who is receiving the benefit or disadvantage of these calls. Presumably from previous research on the subject, lefties are having the away strike called more than their right-handed counterparts, explaining the separation between correctly identifying strikes in zones 11 and 13 versus 12 and 14.

Binned Strike Zone
binned-strike-zone

table-two

While one may argue that there should not be strikes in these bordering zones, we consider any pitch that crosses any portion of the plate a strike. Due to our zone including the diameter of the baseball on both sides of the plate, the outer portion of the plate includes pitches where the majority of the ball is located in one of these zones.

Called Strike Accuracy by Individual Umpire

When gauging an umpire’s ability to correctly identify a rule-book strike, an 85.67% success rate sets the mark with Bill Miller, while Tim Tschida ranks at the bottom of this list, only calling 71.57% correctly. We can infer from Tables Three and Four along with Table One, that while umpires are calling strikes within the strike zone more often, they are still missing over 17% of these pitches. It is important to note that this information does not take into account incorrectly identifying pitches outside the rule-book strike zone as strikes, which when considering an umpire’s overall accuracy, should absolutely be taken into account.


table-three

table-four

Called Strike and Ball Accuracy by Count

One of the most influential factors in whether a taken pitch is called a strike or a ball is the count of the at-bat. We have all seen pitches in a 3-0 count substantially off of the plate called a strike, just as we have seen 0-2 pitches over the plate ruled balls. Table Five shows the correct percentage of strikes and balls by pitch count. While this shows that umpires are overwhelmingly more accurate at identifying strikes as strikes in a 3-0 count (91.06%) as compared to an 0-2 count (56.66%), we must acknowledge this only paints part of the picture. Umpires are conversely most likely to correctly labels balls in 0-2 (98.73%) counts and misidentify balls in 3-0 (90.32%) counts. I included their accuracy of correctly identifying both strikes and balls here as opposed to throughout the entire paper because we can clearly tell through this information that umpires are giving hitters the benefit of the doubt over pitchers. Umpires are far more likely overall to correctly identify a ball than a strike, as evidenced by the fact that there are no counts during which umpires correctly call less than 90% of balls.

table-five

The data in Table Five is corroborated by the visualizations in Figure One and Figure Two. These visualizations of the strike zone include pitches off of the plate and we can see that in a 3-0 count, a more substantial portion of the rule-book strike zone is called strikes while also incorrectly identifying balls as strikes. While in a 0-2 count, a smaller shaded area of the rule-book strike zone works with our findings that less strikes are identified correctly but more balls are correctly called.

figure-one-and-two

Called Strike Accuracy by Pitch Type

The next area I looked at was whether pitch type significantly altered the accuracy of umpires. In order to do this, I grouped all variations of fastballs into “Fastball” and all other pitches into “Offspeed”, while omitting pitch outs and intentional balls. I was able to see how umpires fared in correctly identifying strikes by pitch type in Table Six.
table-six

Not surprisingly, we see Bill Miller near the top of the list with both Offspeed and Fastball accuracy. For umpires as a whole, the difference in accuracy between the two is not large (79.05% Offspeed accuracy vs. 78.91% Fastball strike accuracy). On the other hand, what may come as a surprise is the fact that eight of the top ten highest accuracies were for Offspeed pitches.

Called Strike Accuracy for Home and Away

One of the most-mentioned tendencies of referees or umpires in any sport is home-team favoritism. Whether a foul or no-foul call in basketball, in or out-of-bounds call in football, or a strike or ball ruling in baseball, many think that the home team receives more of an advantage than their visiting counterparts. Looking at top and bottom half of innings, away and home team respectively, we can identify trends and favoritism in major-league umpire strike zones.

While a difference of .62% accuracy may seem like a lot, especially in a sample size of over 650,000 total pitches, we can look at this on a game-by-game level to see the actual discrepancies. For simplicity’s sake, we can assume 162 games a season, making for roughly 11780 games played in our data set (this subtracts all games from the unavailable 2016 data). This leaves us with 23.03 Correctly Called Strikes out of 29.05 Actual Strikes for away teams per game, meaning that 6.02 strikes were not called. As for home teams, we have 22.04 Correctly Called Strikes a game with 28.02 as the Actual Strikes, averaging 5.98 missed strikes a game. By this measurement we can see that more hitter leniency was given to the away team than the home team.

During this time frame, while a higher percentage of strikes were judged correctly, hitters were given more leniency as the away team than the home team on a game-by-game basis.

table-seven

Called Strike Likeliness in Specific Game Situation

Included in Table Eight are the three most and least likely umpires to call any non-fastball a strike below the vertical midpoint of our zone. I split the strike zone at 2.55 vertical feet and looked at any pitch (not necessarily within the zone) below that height. Here, we are not judging an umpire’s accuracy of correctly identifying pitches, but rather looking at where a certain umpire may call specific pitches. We can see that Doug Eddings is 5.34% more likely to call a strike on a non-fastball as compared to Carlos Torres.

While this does not paint the entire picture, we are able to see how their tendencies can play an important role in the game. Information like this may be valuable to a team in deciding how to pitch a specific batter, which reliever to bring into a game, or factor into being more patient or aggressive while at the plate.
table-eight

Conclusion

External pressures and increased standards are undoubtable effects on umpire strike zones. As evidenced throughout this paper, strike zones are called smaller than the rule-book strike zone specifies. And while umpires are trending toward correctly identifying strikes, situations such as count and pitch type can affect their judgment.

While the system in place is not 100%, we must understand that these umpires are judging the fastest and most visually-deceptive pitches in the world and are the best at what they do. Major League Baseball must use modern technology to their advantage and provide the best training for umpires to achieve the goal of calling the rule-book strike zone. Another option, while more drastic and difficult to implement, may include adapting the definition of the rule-book strike zone, something that has not been changed since 1996.


Jacob deGrom’s Encouraging Adjustment

Jacob deGrom struck out 10 batters in his fourth start of the 2017 season. He also walked six and gave up three earned runs on eight hits. The statline alone might tell you it was his weirdest game of the year, and maybe his worst.  

Before that, in his third start, he went seven innings and struck out 13.  He allowed back-to-back dingers early and then took control of the game, allowing only three more baserunners the entire night. His pitches were humming like a barbershop quartet. That statline makes it sound like his best start of the year.

But it wasn’t.

No, that would be his second turn, on April 10 at the Phillies, where he only struck out three. He also walked two and gave up six hits in six innings. That sounds terrifically pedestrian until you realize how he did it.

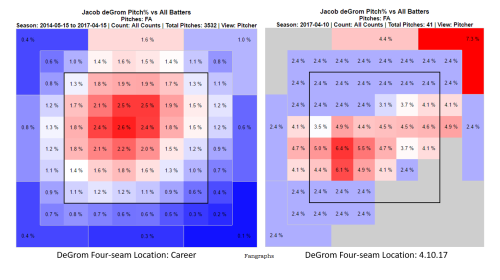
We can start with his fastball, which was a big reason he labored through 31 pitches in the first inning (he only threw 96 all night). Compared to where he’s located it through his career (left), it was all over the place that night (right). It contributed to six men reaching base in the opening frame. He also gave up both walks then, one of which came with the bases loaded. And then Brock Stassi came to the plate and worked a 2-2 count. deGrom threw a changeup, induced an inning-ending double play, and transformed for the rest of the night.

image


image

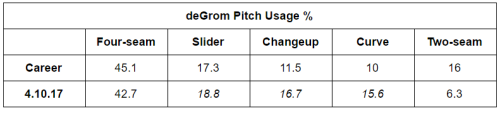
Equal pitch distribution is always interesting. It can speak to a lack of predictability and according effectiveness. But seeing it so even among the slider, curveball, and changeup in this way is more than interesting; it’s relatively unprecedented. Historically, I couldn’t find anyone whose pitch mix has broken down that way for their career.

That’s significant for a few reasons. First, it could explain why Phillies hitters ended up struggling when deGrom seemed to be on the ropes. I could hardly believe they didn’t do more damage as Stassi hit into the double play. But the rally faltered because deGrom had already started to adapt, and in a way that hitters simply aren’t exposed to. In that context, and considering the Phillies aren’t exactly Murderer’s Row, it’s not so strange.

The slider-change-curve pitch mix also speaks to the importance of an effective fastball. With an unreliable four-seamer, deGrom basically ignored his two-seamer. Maybe he did that because if he couldn’t locate the straight one, he figured the alternative that has four to five more inches of movement was no good, either.

But more than anything, deGrom’s adjustment that night was compelling because we’re in an age of sport where we constantly hear about guys unleashing their egos to achieve eminence. And he went the other way.

Alec Fenn of BBC delved into ego’s place in sports. He spoke with confidence coach Martin Perry, who tells how some of the most exceptional players “don’t see risks; they have a bulletproof certainty they’ll produce and [with that] supreme level of confidence, magic can happen.”

Perry compares ego to the stuff of Harry Potter and Disney World, around which entire entertainment universes have been built. For all the mystique ego can produce, it’s no wonder we speak about it so lustfully and embrace it so openly.

A pitcher is provided more opportunity to drive a game with his ego than any other player because of his involvement in every play. On that night in Philadelphia, Jacob deGrom was determined to assert himself and beat the Phillies by establishing his fastball, as any pitcher would try. When it didn’t work, he walked away from his ego but maintained bulletproof certainty. He went with the flow. He didn’t get the win but was a huge reason the Mets did, and gave us a glimpse at an alternative route to success in the process.

data from FanGraphs


Andrew Benintendi and the Lefty Strike

Andrew Benintendi is just 22 years old and has already shown that he belongs with some of Major League Baseball’s better hitters. He has just 195 career plate appearances, but he’s hitting a very impressive .297/.366/.448 so far in his young career. That’s a batting line that is 21% better than league average (121 wRC+). His patience, combined with his ability to put the bat on the ball, leads one to believe that this is sustainable.

So far in 2017, Benintendi has a walk rate of 9.1% and a strikeout rate of just 13%. His O-Swing% and overall Swing% are both above average at 27% and 42.5%, respectively. He also rarely swings and misses. Of 190 qualified hitters in 2017, Benintendi has the 18th lowest swinging-strike rate, at 5.5%. I think it’s safe to say that even at such a young age, Benintendi has a good idea of where the strike zone is. His numbers in 2017 are very good, with a line of .299/.377/.403, but they could probably be much better if he wasn’t so heavily penalized for the “lefty strike.”

So far this year, 135 left-handed hitters have seen at least 100 pitches. According to Baseball Savant, of those 135, Benintendi has seen the most called strikes that were off the plate away, with 22. To visualize, here is a strike-zone plot that includes every single called strike on Benintendi this year.

As you can see, a large amount of called strikes on Benintendi have either been up and away, away, or down and away.

Most of these calls have come in an 0-0 count as well. In the same sample of left-handed hitters, Benintendi has seen the most 0-0 called strikes that were off the outside part of the plate, with 12. An astounding 4.1% of all the pitches he has seen this season have been 0-0 called strikes that were off the outer part of the plate, which also leads that 135-player sample. There is only one other player above 4% and just 10 other players above 3%. Here is a visual of the called strikes Benintendi has seen with an 0-0 count.

Benintendi has been put into an 0-1 hole on pitches that are off the plate away more often than any other left-handed hitter that has seen 100 or more pitches. Starting off an at-bat with an 0-1 count is much different than starting with a 1-0 count. It’s only April 23, but this could be something to keep an eye on moving forward. If these strike calls begin to even out, and Benintendi has more calls go his way, his already impressive numbers may start to look even more impressive.


Important Michael Lorenzen Update

Michael Lorenzen has made some headlines this year as a hitter. He hit a home run! He has a 232 wRC+! Wow! But here’s an interesting tidbit about him you may not have known — he also pitches occasionally! As I’m typing this, he has pitched 11 innings with a 9.82 K/9 and a 2.45 BB/9, a pretty good start which suggests that his 5.73 ERA will come down soon. The most interesting part to me, though, is that he is getting these results in a completely different manner than the way he pitched in 2016.

We took a look at Michael Lorenzen’s 2016 season a little while back and noted that while he was throwing his sliders very hard, he simply wasn’t getting any results with them. Thanks to the Statcast search at Baseball Savant we can take a look at his 17 sliders this year. The first thing that jumps out is the velocity — he is averaging 86 MPH on his slider, significantly down from the 91.5 MPH average in 2016. In fact, he’s maxed out at 89 MPH this year, which means his average slider velocity from a year ago is two ticks higher than his maximum slider velocity this year. And that’s with everyone’s velocity looking higher this year.

But the second thing that you’ll notice is that the results when he throws the slider are really good:

Michael Lorenzen Sliders by Result, (early) 2017
Result Count
Ball 3
Called Strike 4
Foul 2
Groundout 3
Flyout 1
Swinging Strike 4
SOURCE: Baseball Savant

In 2016 Lorenzen threw 67 sliders of 94+ MPH and got four swinging strikes. He already has that many swinging strikes on his sliders in 2017, in only 17 pitches. He’s yet to allow a base hit on the pitch, and has only missed the zone three times. This is a pitch that’s really become a weapon for him, after being a serious liability last year.

Now if that were the only thing that’s different about Lorenzen, it would be fairly interesting. But it’s not. Based on results alone, he looks like a completely different pitcher than last year:

View post on imgur.com


Last year his cutter was his best pitch; this year it’s been his worst. Last year his slider was his worst pitch; this year it’s been slightly above-average. Now, just like in every other baseball article you’ll read this month, I will include the caveat that it’s early. But to see this kind of a swing in results is intriguing. I would suspect he’ll be going to his off-speed stuff a bit more in the coming months. It’s working for him, and it might help make his fastball look even faster. Don’t get distracted by his hitting — his pitching is the thing to keep an eye on. He’s put bits and pieces of it together in the past, and if he can put it all together now, watch out.


Late and Close With the Phillies

The Phillies are a remarkable 9-9 in what’s now 18 games in to the 2017 season.  Why is that remarkable?  Because of what they’re doing on both sides of the ball in the late innings.

The team, as a whole, has an ERA in the ninth inning of 7.36.  Batters they’re facing in the ninth are OPS’ing a ridiculous .910 in the inning and the team has given up six home runs, nearly one in every ten plate appearances.  By almost every metric, the ninth inning has been the worst for Phillies pitching.  Only two teams have a worse ERA in the ninth and only three have a higher OPS.  Of the two teams with a higher ERA, the Rangers gave up half of their ninth inning runs in two games, and no teams have given up as many home runs.

With those kinds of ninth-inning numbers you’d expect that the Phillies would have a high amount of losses attributed to blown saves.  Of their 18 games so far, eight have come down to save situations, and they’ve given up runs in six of those games and blown four of them.  What’s remarkable, though, is that they’ve only lost two of those games, and both games were where the Phillies didn’t get a chance to bat following the blown save.  In the other two they’ve managed to come back and win.

So, how is it that they’ve managed to be at .500 over the first 18 games to start the season?  Well, there’s some interesting anomalies in the late innings on the offensive side as well.

To counter the poor pitching in the 9th inning, the Phillies batters are excelling at hitting in the late innings.  Through innings 7-9 as a team the Phillies are hitting .267/.336/.497 for an OPS of .834, which puts them at the best in baseball.  To put that in perspective, that’s extremely close to what Edwin Encarnacion hit all of last year, .263/.357/.529 for an .886 OPS.  Encarnacion finished 14th in MVP voting.

What can be interpreted from this is that the Phillies are doing something all good teams seem to do – take advantage of relief pitching.  Indeed, their line against relievers so far this year is incredible at .282/.355/.531 for an OPS of .878, which is again the best in baseball.  Mets slugger Yoenis Cespedes earned himself a contract with an annual average value of $27.5M over the next four years by hitting similarly to what the Phillies are doing to relief pitchers early on this year.  He had a slash line of .280/.354/.530 for an OPS of .884.

For a team like the Phillies have been so far, every run seems to matter.  This isn’t a situation where they’re scoring extra runs or giving up meaningless runs in blowouts.  Over their 18 games they’re carrying a run differential of +7 runs.  To drive home how important every run is in a typical Phillies game, 13 of their 18 games have been decided by less than two runs, and nine have been one-run games.

So to say that the late innings for the Phillies have been adventurous is a bit of an understatement.  They’re giving up runs, but they’re scoring runs as well.  Surely this is a somewhat unsustainable balancing act, but due to the fact that it’s happening on both sides of the ball, when it does in fact even itself out, the end results aren’t likely to be much different.


Jeff Samardzija’s Ongoing Breakout

Early in the baseball season, I’m always checking the statistical leaderboards to see who sticks out. Sometimes it’s a batter with an incredible ISO (Thames), a hitter with a laughably low BABIP (Schimpf), or in this case, a pitcher whose swinging-strike percentage sits significantly higher than his career mark (Samardzija). While we’re only a few weeks into the season and the simple reasoning that small sample sizes shouldn’t be trusted looms large, occasionally a player makes a change that draws my interest. In Jeff Samardzija’s case, dating back to the last few months of the 2016 season, he’s undergone a noticeable modification in his pitch peripherals.

Pitchers are always making adjustments. Adding in new pitches, subtracting some from their mix, or altering a pitch to complement the rest of their offerings. While it shouldn’t come as a surprise when a pitcher does tweak a pitch, it stands out when the results are as drastic as Samardjiza’s. Let’s take a look at Jeff’s horizontal pitch movement for three of his most-used pitches dating back to the start of the 2016 season to see if anything jumps out.

Horizontal Movement

Month Sinker Slider Split
3/16 -9.74 1.16 -6.47
4/16 -9.70 1.11 -6.96
5/16 -9.55 1.17 -8.13
6/16 -9.62 0.34 -7.45
7/16 -9.68 -1.35 -5.75
8/16 -9.71 -0.83 -5.77
9/16 -9.84 -0.25 -5.57
10/16 -9.35 -0.60 -6.08
Month Sinker Slider Split
3/17 -9.42 -0.97 -6.65
4/17 -10.10 -0.01 -6.76


Nothing crazy happening here, other than a slight shift in the movement of his slider. It went from breaking away from righties, to not breaking at all. A difference of about an inch or two which can certainly add up under the right context. Now, for the vertical movement.

Vertical Movement

Month Sinker Slider Split
3/16 4.77 1.10 4.27
4/16 4.89 1.19 5.22
5/16 4.28 1.47 2.97
6/16 4.18 2.56 2.89
7/16 4.93 3.75 5.15
8/16 4.87 3.02 4.13
9/16 4.91 3.22 4.01
10/16 6.26 3.68 4.45
Month Sinker Slider Split
3/17 5.17 5.39 4.51
4/17 6.63 6.07 4.97


Over the course of the 2016 season, the continued refining of the slider is quite apparent. Consistently, month over month, the pitch featured less vertical movement than before. This mix of pitches starts to form around July to August of last year, and takes a huge step forward in 2017. The difference in vertical break between the three currently sits at less than an inch and a half.

Think about that from a batter’s perspective. Three pitches, all coming in with comparable downward break, yet two will feature severe break in on a right-handed hitter (sinker and splitter) and one won’t break in at all (slider). The batter is left guessing about which lateral direction the pitch will go in its final moments before crossing the plate. Previously, with a noticeable difference in vertical movement, the hitter had a better idea of what pitch was coming in. He could see the drop associated with a slider, leading to a more confident prediction of how the pitch would break. While the sinker is thrown harder, around 93, compared to the slider and splitter, both around 85-87, the combination of the three seems to have thrown hitters for a loop, as evidenced by the stark increase in whiffs.

Whiff Percentage

Month Sinker Slider Split
3/16 9.30 23.08 16.67
4/16 5.26 12.00 2.94
5/16 5.88 10.78 8.57
6/16 5.65 13.95 15.38
7/16 4.67 16.10 0.00
8/16 6.50 7.55 26.32
9/16 6.17 11.11 20.35
10/16 5.56 11.11 25.00
Month Sinker Slider Split
3/17 7.14 23.33 40.00
4/17 8.41 20.75 27.59


Notice how, starting in August of 2016, the splitter features a huge up-tick in whiffs. This was right when Samardzija was altering the vertical movement of the three to mask their identities. By this season, when the three became even closer in nature, the whiffs skyrocketed. The batter’s utter confusion in trying to classify each offering results in more whiffs.

Samardzija certainly seems to be onto something here. Again, while this is a small sample, it makes me wonder about usefulness of quantifying pitches individually by their velocity and movement. Before, his slider featured more movement, yet Jeff’s cumulative whiffs were lower overall. Once he changed the pitch to look more his like other offerings, the results improved. Perhaps a more holistic approach is necessary when we look at a pitcher’s individual pitch performance. How effective a pitcher’s repertoire appears is more than a sum of its parts, as seen in Samardzija’s recent changes.


Hardball Retrospective – What Might Have Been – The “Original” 2003 Indians

In “Hardball Retrospective: Evaluating Scouting and Development Outcomes for the Modern-Era Franchises”, I placed every ballplayer in the modern era (from 1901-present) on their original team. I calculated revised standings for every season based entirely on the performance of each team’s “original” players. I discuss every team’s “original” players and seasons at length along with organizational performance with respect to the Amateur Draft (or First-Year Player Draft), amateur free agent signings and other methods of player acquisition.  Season standings, WAR and Win Shares totals for the “original” teams are compared against the “actual” team results to assess each franchise’s scouting, development and general management skills.

Expanding on my research for the book, the following series of articles will reveal the teams with the biggest single-season difference in the WAR and Win Shares for the “Original” vs. “Actual” rosters for every Major League organization. “Hardball Retrospective” is available in digital format on Amazon, Barnes and Noble, GooglePlay, iTunes and KoboBooks. The paperback edition is available on Amazon, Barnes and Noble and CreateSpace. Supplemental Statistics, Charts and Graphs along with a discussion forum are offered at TuataraSoftware.com.

Don Daglow (Intellivision World Series Major League Baseball, Earl Weaver Baseball, Tony LaRussa Baseball) contributed the foreword for Hardball Retrospective. The foreword and preview of my book are accessible here.

Terminology

OWAR – Wins Above Replacement for players on “original” teams

OWS – Win Shares for players on “original” teams

OPW% – Pythagorean Won-Loss record for the “original” teams

AWAR – Wins Above Replacement for players on “actual” teams

AWS – Win Shares for players on “actual” teams

APW% – Pythagorean Won-Loss record for the “actual” teams

Assessment

The 2003 Cleveland Indians 

OWAR: 41.6     OWS: 262     OPW%: .500     (81-81)

AWAR: 26.7      AWS: 204     APW%: .420     (68-94)

WARdiff: 14.9                        WSdiff: 58  

The “Original” 2003 Indians came within one game of the American League Central Division title as the White Sox held off the Tribe and the Twins. Jim Thome launched a League-leading 47 moon-shots and drove in a career-best 131 baserunners. He scored 111 runs, drew 111 bases on balls and earned his highest finish in the MVP balloting (fourth). Manny Ramirez scorched the opposition with a .325 BA, 37 wallops, 104 ribbies, 117 runs scored and a League-best OBP of .427. Richie Sexson (.272/45/124) matched his career-best in home runs and fell one short of his top RBI mark. Brian S. Giles suffered a drop in production from his previous four campaigns but still managed to belt 20 long balls while posting a .299 BA.  “The Mayor” Sean Casey hit at a .291 clip but otherwise failed to deliver the power output expected from a first baseman. The lineup for the “Actual” 2003 Indians featured Milton Bradley (.321/10/56) and rookie outfielder Jody Gerut (.279/22/75).

Omar Vizquel (61st-SS) and Ellis Burks (77th-CF) placed in the top 100 player rankings according to “The New Bill James Historical Baseball Abstract among members of the “Actuals” roster.

  Original 2003 Indians                               Actual 2003 Indians

STARTING LINEUP POS OWAR OWS STARTING LINEUP POS AWAR AWS
Manny Ramirez LF 3.63 26.99 Matt Lawton LF 1.07 9.65
Brian S. Giles CF/LF 5.09 24.55 Milton Bradley CF 4.21 18.53
Dustan Mohr RF 0.52 7.06 Jody Gerut RF 1.98 14.24
Richie Sexson DH/1B 4.13 24.93 Travis Hafner DH 0.8 7.4
Jim Thome 1B 4.56 28.67 Ben Broussard 1B 0.59 8.77
John McDonald 2B -0.43 2.04 Brandon Phillips 2B -1.22 4.28
Jhonny Peralta SS 0.16 4.22 Omar Vizquel SS 0.11 5.25
Russell Branyan 3B 0.44 5.82 Casey Blake 3B 0.51 11.48
Einar Diaz C 0.63 4.75 Josh Bard C 0.81 6.35
BENCH POS AWAR AWS BENCH POS AWAR AWS
Sean Casey 1B -0.27 14.88 Coco Crisp CF -0.17 6.51
David Bell 3B 0.12 4.42 Shane Spencer RF 0.69 4.99
Kelly Stinnett C -0.07 3.49 Ellis Burks DH 0.38 4.76
Victor Martinez C 0.27 3.36 Jhonny Peralta SS 0.16 4.22
Damian Jackson 2B -0.44 1.85 Ryan Ludwick RF 0.56 3.94
Marco Scutaro 2B 0.19 1.81 Victor Martinez C 0.27 3.36
Julius Matos 3B -0.14 0.6 Alex Escobar RF 0.51 3.01
Zach Sorensen 2B -0.28 0.32 Tim Laker C -0.1 2.71
Mike Edwards DH 0.03 0.19 John McDonald 2B -0.43 2.04
Herbert Perry 1B -0.3 0.07 Angel Santos 2B 0.05 1.47
Mark Budzinski CF -0.09 0.03 Chris Magruder LF 0.32 1.42
Mike Glavine 1B -0.09 0.01 Ricky Gutierrez SS -0.08 0.79
Mitch Meluskey -0.04 0 Greg LaRocca 3B 0.06 0.39
Zach Sorensen 2B -0.28 0.32
Bill Selby 3B -0.5 0.3
Karim Garcia RF -0.51 0.22

Bartolo Colon (15-13, 3.87) fashioned a WHIP of 1.198 and topped the American League with 9 complete games. Six-time All-Star lefthander C.C. Sabathia (13-9, 3.60) appeared in his first Mid-Summer Classic. David Riske notched 8 saves and a 0.964 WHIP along with a personal-best 2.29 ERA. Danys Baez (3.81, 25 SV) and Julian Tavarez (3.60, 11 SV) bolstered the relief corps.

  Original 2003 Indians                            Actual 2003 Indians  

ROTATION POS OWAR OWS ROTATION POS AWAR AWS
Bartolo Colon SP 5.23 17.34 CC Sabathia SP 3.86 12.89
CC Sabathia SP 3.86 12.89 Brian Anderson SP 0.32 6.67
Jason Davis SP 0.07 5.13 Jake Westbrook SP 1.12 5.8
Danny Graves SP -0.4 3.4 Jason Davis SP 0.07 5.13
Jason Stanford SP 1.03 2.85 Billy Traber SP 0.05 2.96
BULLPEN POS OWAR OWS BULLPEN POS OWAR OWS
David Riske RP 2.07 9.84 David Riske RP 2.07 9.84
Julian Tavarez RP 0.52 9.19 Danys Baez RP 0.28 8.61
Danys Baez RP 0.28 8.61 Jack Cressend RP 0.95 4.05
Curt Leskanic RP 1.72 8.09 Rafael Betancourt RP 0.86 3.92
Paul Shuey RP 0.55 6.62 Jason Boyd RP 0.18 3.19
Steve Kline RP 0.44 5.05 Jason Stanford SP 1.03 2.85
Alan Embree RP 0.68 4.91 Terry Mulholland RP -0.62 2.71
Mike Matthews RP -0.18 2.91 Cliff Lee SP 0.42 2.69
Jaret Wright RP -1.84 1.31 Jose Santiago RP 0.51 2.28
Travis Driskill RP -0.95 0.64 Dan Miceli RP 0.38 1.54
Charles Nagy RP -0.11 0.17 Carl Sadler RP 0.29 0.92
Brian Tallet SP -0.23 0.14 Ricardo Rodriguez SP -0.62 0.59
Mike Bacsik SP -0.86 0 David Lee RP -0.01 0.51
Ryan Drese SP -0.85 0 Jason Bere SP 0.11 0.32
Tim Drew SW -0.58 0 Brian Tallet SP -0.23 0.14
Alex Herrera RP -0.35 0 Nick Bierbrodt RP -0.19 0
Albie Lopez RP -1.49 0 David Cortes RP -0.32 0
Robert Person RP -0.29 0 Chad Durbin SP -0.57 0
Rudy Seanez RP -0.17 0 Dave Elder RP -0.37 0
Matt White RP -0.93 0 Alex Herrera RP -0.35 0
Aaron Myette RP -0.5 0
Chad Paronto RP -0.44 0
Jason Phillips RP -0.24 0
Jerrod Riggan RP -0.19 0

Notable Transactions

Jim Thome 

October 28, 2002: Granted Free Agency.

December 6, 2002: Signed as a Free Agent with the Philadelphia Phillies. 

Manny Ramirez

October 27, 2000: Granted Free Agency.

December 19, 2000: Signed as a Free Agent with the Boston Red Sox.

Richie Sexson

July 28, 2000: Traded by the Cleveland Indians with a player to be named later, Kane Davis and Paul Rigdon to the Milwaukee Brewers for Jason Bere, Bob Wickman and Steve Woodard. The Cleveland Indians sent Marco Scutaro (August 30, 2000) to the Milwaukee Brewers to complete the trade. 

Brian S. Giles

November 18, 1998: Traded by the Cleveland Indians to the Pittsburgh Pirates for Ricardo Rincon.

Bartolo Colon 

June 27, 2002: Traded by the Cleveland Indians with Tim Drew to the Montreal Expos for Cliff Lee, Brandon Phillips, Grady Sizemore and Lee Stevens. 

Sean Casey 

March 30, 1998: Traded by the Cleveland Indians to the Cincinnati Reds for Dave Burba.

Honorable Mention

The 1941 Cleveland Indians 

OWAR: 43.0     OWS: 267     OPW%: .545     (84-70)

AWAR: 34.9      AWS: 225     APW%: .487     (75-79)

WARdiff: 8.1                        WSdiff: 42  

Engaged in heated combat with the Red Sox and Yankees down the stretch in ’41, the Tribe emerged in third place, four games behind Boston. Thornton Lee (22-11, 2.37) topped the Junior Circuit in ERA, WHIP (1.165) and complete games (30) to merit his lone All-Star invitation. Bob Feller (25-13, 3.15) led the League in victories, starts (40), shutouts (6) and innings pitched (343). “Rapid Robert” paced the AL in strikeouts for the fourth consecutive season and placed third in the MVP voting. Jeff Heath (.340/24/123) established career-highs in base hits (199), triples (20), RBI and stolen bases (18) while making his first All-Star appearance. “Old Reliable” Tommy Henrich clubbed a career-best 31 round-trippers and registered 106 tallies. Ken Keltner rapped 31 doubles, 13 triples and 23 circuit clouts. “Old Shufflefoot” Lou Boudreau socked 45 two-baggers and scored 95 runs.

On Deck

What Might Have Been – The “Original” 2010 Orioles

References and Resources

Baseball America – Executive Database

Baseball-Reference

James, Bill. The New Bill James Historical Baseball Abstract. New York, NY.: The Free Press, 2001. Print.

James, Bill, with Jim Henzler. Win Shares. Morton Grove, Ill.: STATS, 2002. Print.

Retrosheet – Transactions Database

The information used here was obtained free of charge from and is copyrighted by Retrosheet. Interested parties may contact Retrosheet at “www.retrosheet.org”.

Seamheads – Baseball Gauge

Sean Lahman Baseball Archive