Tommy Joseph Learns the Value of Patience

While Phillies first-base prospect Rhys Hoskins spent April on the Triple-A leaderboards, his big-league counterpart, Tommy Joseph, was among the least productive everyday players in the majors. Through the first month of the season, Joseph hit for a dreadful .179/.222/.254 slash line, along with a .211 wOBA and 25 wRC+. While a BABIP of .234 didn’t do him any favors, Joseph’s 27.8 K% and 5.6 BB% suggested that the 26-year old was simply being outmatched at the plate. All in all, despite passable defense at first base, Joseph’s lack of offensive output was enough for him to accumulate -0.7 WAR, tied for the third-lowest in the league.

It didn’t take long for the local media to start calling for Joseph’s spot in the starting lineup. Hoskins, who Eric Longenhagen rated in February as the Phillies’ ninth-best prospect, ended the month with six home runs and a .338 batting average — numbers that look even better when compared to Joseph’s disappointing output. By the last week of April, some Phillies writers were suggesting promoting Hoskins to the big-league starting lineup in favor of Joseph. Even the sports section of the city’s largest newspaper demanded the team make the switch. As longtime Philadelphia Inquirer columnist Bob Brookover wrote in the first week of May, Hoskins “[c]utting into Joseph’s playing time when he’s hitting below the Mendoza Line would not cause nearly as much turmoil as [Joseph cutting into Ryan Howard’s playing time] did a year ago.

Since the beginning of May, though, the cries to replace Joseph in the lineup have, for the most part, been quieting down. This trend can be attributed to the fact that, surprisingly enough, Tommy Joseph has been one of Major League Baseball’s best hitters this month. Since the beginning of May, Joseph’s 185 wRC+, .459 wOBA, and .344 ISO rank eighth, eighth, and twelfth, respectively, among nearly two hundred qualifying batters. Take a look at how drastically his rolling wOBA has shifted throughout the first two months of the season:

rollingwOBA

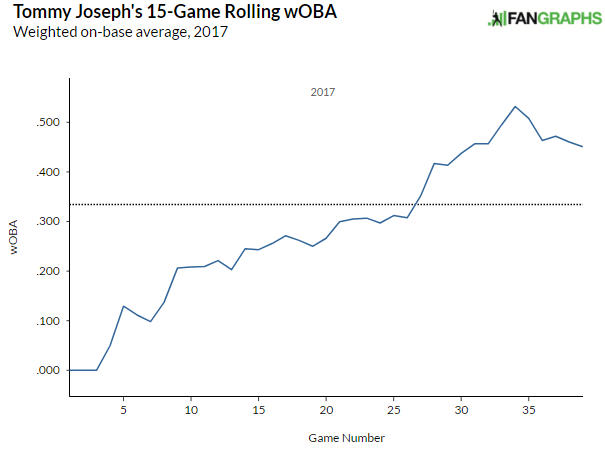
Among qualifying batters, Joseph’s improvement in wOBA from April to May was the largest such increase in the league. Such a change seems unlikely to organically occur, although luck certainly can play a part (I would be remiss not to mention Joseph’s .390 May BABIP). I expect, however, that there’s a more concrete explanation for Joseph’s recent success. It doesn’t take a very long look at Joseph’s numbers to get an idea of how he altered his approach. Put simply, Joseph stopped swinging at everything in and around the strike zone. Compare the following two heat maps, one from April and one from May:

swing pct - april

swing pct - may

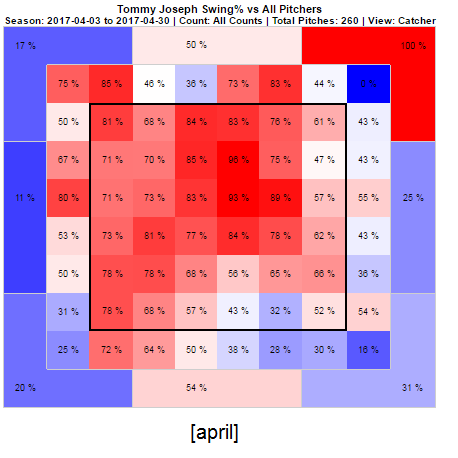
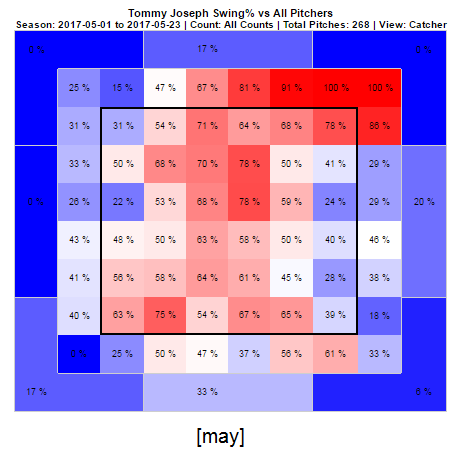
On April 30, Tommy Joseph had an O-Swing%, Z-Swing%, and overall Swing% of 38.8, 78.8, and 56.2, respectively. If those percentages sound high, it’s because they are; they ranked eighth, fifteenth, and eighth highest in the majors. May, on the other hand, has been a different story. While Joseph has still been chasing up-and-away pitches, he’s become far more adept at laying off of pitches on the inner half of the plate (even though he’s seen ten percent fewer fastballs), and has cut down his swinging rate in virtually every other section of the strike zone. With a May O-Swing% of 27.2, Z-Swing% of 63.9, and Swing% of 41.9, one of the majors’ most free-swinging hitters has been playing like one who, while not exactly Joey Votto, is far less extreme, relative to the rest of the league, than he was in April.

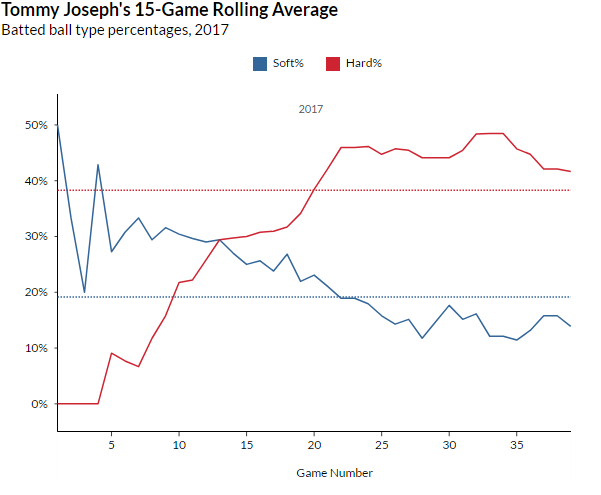
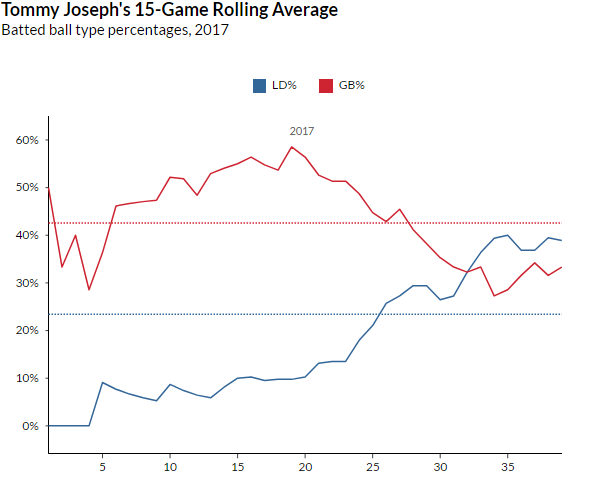
Interestingly, Joseph’s contact rates haven’t significantly changed since he started taking a more patient approach at the plate. We would, however, expect an improvement in the quality of his contact. His hard- and soft-hit percentages have trended in opposite directions since the beginning of the month, as have his line drive and ground ball rates:

rolling HardSoft - Copy

rolling GB-LD

While Joseph’s improvements must be encouraging for a Phillies team that has struggled mightily as of late, it’s still hard to imagine Tommy Joseph being a key contributor on the next contending Phillies team. As mentioned earlier, Joseph has had a .390 BABIP this month, and, even with his more refined approach at the dish, his 22.5 K% and 9.9 BB% in May shouldn’t exactly reassure anyone that he’s anything more than a solid placeholder while the team rebuilds. If Joseph can continue exhibiting patience at the plate, though, he might just put up numbers impressive enough to curb the antsiness of the more impatient members of the Philadelphia fandom. Phillies supporters shouldn’t necessarily give up on the idea that Rhys Hoskins, if he keeps mashing in Triple-A, could reach the majors this year — especially if Joseph gets injured — but as a rebuilding team, the Phillies have no need to rush any of their promising young prospects to Philadelphia. And if Joseph’s discipline changes are for real, they might find themselves with a better placeholder at first base than they may have been expecting.


Vince Velasquez Needs a New Approach, and He Knows it

When the season started I said that Vince Velasquez would be the future of the Phillies…if he could wrangle his fastball usage.

He hasn’t. And after only the first quarter of the season, that might not seem quite newsworthy. His last start was pretty much exactly what we’ve come to expect from him: 6 strikeouts, 2 walks, and 5 earned runs in 5.1 innings. But after the game Velasquez said, “I don’t know. I’m just clueless right now. I’m just running around like a chicken without a head.”

Those are the comments of a player worn down by his own consistent, tepid performance like running water does to the sides of a canyon. Manager Pete Mackanin had his own thoughts after the game. Per Corey Seidman of CSN Philly:

“He just has trouble commanding his secondary pitches,” Mackanin said. “He needs to command his secondary pitches. Once he does that, hitters can’t sit on his fastball. He’s got a real high swing-and-miss percentage on his fastball. I think he’s second to (Max) Scherzer.

“Players don’t square up his fastball but when you can’t command or show the command of your secondary stuff, then they just keep looking for the heater. And if you make mistakes with it, it gets hit. So his challenge is to start gaining better command of his breaking balls.

“If he throws a slider to a hitter and he swings and misses at it and it’s out of the strike zone, he’s got to have the ability to throw another one in the same location instead of just throwing a fastball.”

As of this writing, the Phillies have lost 19 of the last 23 games. They’re in the middle of a rebuild, a phase where they’re expecting the first wave of the next generation to start producing. Velazquez is a critical piece. With how the big picture and current moment are swirling, Mackanin’s comments are worth examining.

image

Yes, Velasquez needs to throw less fastballs. His approach is nearly identical to last year. In fact, with two strikes, he’s throwing the heater more often. Given that, even having command of his secondaries may not influence his results much.

And we may not be in a position to say he’s not confident in his secondary offerings because he’s thrown them so irregularly. He’s employed his fastball at least four times more than all of his secondary pitches in two-strike counts this year.

image

The relaxed environment built by the team seems to have enabled certain guys to grow into, or maybe even outgrow, expectations. Freddy Galvis, Odubel Herrera, and Cesar Hernandez all fit that description. But Velasquez could require additional structure. There might already be a successful player in the league to use as a template, too: Chris Archer.

Archer is mostly a two-pitch pitcher. His fastball (used 47.4% of the time this season) and slider (45.1%) account for nearly every pitch he’s thrown in 2017. He sprinkles in a changeup (6.6%) as the game goes on to keep hitters honest when they see him a second and third time. He’s used his slider in two-strike counts this year just about as much as Velasquez has used his fastball, so there’s already some semblance of a formula Velasquez knows that could help him transition his mental approach.

By movement, Velasquez’s slider is basically a flatter, faster version of his curveball. It hasn’t been effective. He’s thrown it less this year than last, but further reducing its use would leave him with an electric four-seamer, a sharp curve, and a solid changeup.

The repertoire would be different from Archer’s, and the effectiveness of its differences could be debated, but the goal would be straightforward: simplify Velasquez’s game, so that when he does find himself in a two-strike count, his fastball could play up like Archer’s slider. Get him out of his head and let his stuff do the talking because it is capable of speaking for itself.

Once he feels comfortable with this strategy, Velasquez could add to the velocity gap between his fastball and changeup, which could provide some much-needed guile to his game. And while it might seem foolhardy to think of step two of a plan for a struggling player before they even start step one, it’s vital, because he’s never had more than one step to his approach.

It’s been apparent for some time that Velasquez throwing only the fastball wouldn’t be enough, no matter how good it is. Now we know he knows it, too, and we’re all waiting for the next step.


Is Launch Angle Having a Contact Cost?

This is for now the final article of my launch angle series (Sorry Carson, or whoever edits all those articles).

Alan Nathan wrote an article that suggested that a steeper attack angle (upward swing angle of the bat) produces more extra-base hits but has a cost in power.

That makes sense since the average pitch only has a downward angle of like 5-10 degrees and if you swing up at 20 degrees you are on plane with the pitch for a shorter time.

Unfortunately, we don’t have attack angles for pro players in games, because there are cheap bat sensors that measure that now but they have only been used in ST and futures games (suggesting attack angles of like 8-15 in most cases I have seen), but I will assume that the average exit angle over a long sample should be pretty similar to the attack angle, or at least correlate closely.

For that, like in my last post, I looked at guys that had at least 500 ABs in 2015-2016.

I looked at LAs of <7, 7-9, 9-11, 11-13, 13-15, 15-17 and >17 degrees.

LA <7  7-9 9-11 11-13 13-15 15-17 >17
K% 18.2 18.2 20.7 19.7 20.3 19.3 20.7

I did not really find very big differences. Below 9 degrees it was about 2 percent lower than at the higher angles, but after that there isn’t a big change. Even looking at the small sample above 19 degrees, it was only elevated to 21.6%, which is higher but not spectacular (and it was a small sample of only seven batters).

To look further I looked at exit velo. If I looked at the batters above 91 mph they averaged 23% Ks, vs 19.1% for the below-91 group.

So there may be some penalty for swinging hard, but there also might be a selection bias, since low-power swing-and-miss guys are weeded out while power hitters with bad contact skills produce more and stay in the league longer.

Overall, looking at those data, I would say that contact is mostly a skill that is separate from launch angle. In my prior articles I have shown that there is a punishment for  angles that are too high, but it seems to come more in the form of pop-ups and routine fly outs and thus lower BABIP, and not in the form of whiffs. Now we know there are some high-LA, high-whiff guys like Chris Davis for example, and those guys do trade BABIP for ISO with higher LAs to get the most out of their contact, but the more extreme uppercut likely isn’t the source of their whiffs but an attempt to compensate for them by trying to strengthen their strength while “punting” their weakness.


Should You Be Buying Into Zack Cozart?

No, you shouldn’t. Well, that was easy. I’ll be moving on to my “Why Haven’t You Bought Jeff Samardzija Yet?” article now.

OK, so it’s not quite that simple and I suppose you want some things like facts, charts, numbers, etc, etc.  You FanGraphs readers are all the same.

Zack Cozart has been a bit of a fantasy darling early this year. Writers have pointed out his 13%+ walk rate to begin the year. His improved .230+ ISO. His .340+ batting average (I hope this is still valid by the time we go live, because it probably won’t be). Because you’re FanGraphs readers, I also know you’ve already looked at his .400 BABIP and processed the fact that he’ll likely regress, but how far? To what level? Will he be 12-team mixed relevant? 10-team? I’d like to take a shot at answering those questions.

First of all, it’s not all bad news with Cozart. As Travis Sawchik would say, Cozart has joined the merry band of fly-ball revolutionaries, as evidenced by his increased fly-ball rate from 2013 to 2016, and he was on my list of possible value picks coming into auction season. His overall value in home-run leagues is capped by his HR/FB%, but I play in quite a few TB leagues so I wanted to keep an eye on him.

Zack Cozart FB% & HR/FB% By Year
Year FB% HR/FB%
2013 31.6% 8.1%
2014 37.7% 2.5%
2015* 42.2% 12.9%
2016 39.9% 10.5%
2017 40.7% 17.4%
* 53 games

I have a tool I like I built in Excel years ago to monitor BABIP-inflated statistics, and to regress the triple slash lines based on expected normalish-BABIP for ROS.

While Cozart is currently sporting a triple slash line of .348/.428/.585, his .394 BABIP says that he should have approximately 10-13 fewer hits than he’s accumulated this far. It’s ~10 hits if you assume a league-average BABIP and ~13 hits if you assume his career .281 BABIP. What this means for you is that Cozart’s talent level right now is only supporting a .251/.331/.528 triple slash, or .274/.354/.541 if you believe he’ll overachieve his career BABIP.

You may be thinking, okay, that’s great, sign me up, but there’s just one more outlier caveat on Cozart’s amazing start to this season. Did you spot it?  He has four triples already! Unless you’re an extremely speedy player, and Cozart is not, triples basically come down to batted-ball or fielding luck. Hit it in just the right spot, or have a fielder take a bad run at a ball, and voila, you’ve got a triple (when you’re not fast).

If we were forecasting Cozart’s triples for the rest of the season, based on his lifetime triples output, he might accumulate three more triples over the course of the final ~125 games, and we should probably have expected him to have only one or two thus far this season. If we correct for this we can adjust his SLG to somewhere between .485-.495, or another way to look at it is via his ISO which I’d forecast to be somewhere around .170-.185.

Overall, if we’re projecting Cozart out over the rest of the season, I think it would be safe to bank on something in the range of .260/.340/.490, which isn’t a bad player and allows for some of his HR/FB% luck to stick in his projection. For those of you playing in OBP leagues, you can monitor the walk rate and perhaps you’ll get some new-found value there this year. With the growth we’ve seen in Cozart’s fly-ball rate, along with his corresponding doubles and home-run output over the past three years, he should safely set career highs in SLG and WAR.


Miguel Sano Is the Three True Outcomes Hitter We’ve Been Waiting for

The idea of a “three true outcomes” (TTO) hitter, a batter whose plate appearances typically end in a walk, strikeout, or home run, is nothing new — Rany Jazayerli proposed the idea all the way back in the forgotten year of 2000, when the Backstreet Boys dropped their latest hit album “Black & Blue” and Dora the Explorer debuted.

In that article, Jazayerli describes how the Rob Deer Fan Club (of which I am a card-carrying member) had just discovered the newest prophet for the gospel of TTO — Russell Branyan, who seemed poised to demonstrate the TTO philosophy on the big stage, had just been named the Indians’ top prospect by Baseball America.

While Branyan lived up to the TTO promise, it appears as though he may have been a false prophet — Branyan struggled to stay in a starting role, jumped around the majors for a bit, and never made a significant impact while he played.

Worry not, for the Rob Deer Fan Club (or as it is otherwise known, the RDFC) was not without a champion during the 2000s. I present to you our holy savior, Adam Dunn. Dunn surpassed Deer as the king of the TTO, finishing his career with a TTO% (HR+BB+SO/PA) of 49.9% to beat Deer’s 49.1% figure. Dunn clubbed 462 home runs, drew 1317 walks, and struck out 2379 times — finishing 35th, 42nd, and 3rd respectively all-time despite only playing 14 seasons. He out-Deer’d Deer!

Nevermind the fact that the RDFC was blessed with the presence of Jack Cust, who set the TTO% single-season record in 2007 with a TTO% of 58.2% (among qualified players). Or Jim Thome, who in his quiet and humble way, finished his career 4th in TTO%. How about Mark Reynolds? Or Ryan Howard? Or Pat Burrell? All of them are worthy disciples of the school of TTO.

But it has been years since we’ve seen someone live up to the TTO promises of Mark McGwire’s 1998, where he finished with a TTO% of 56.8% and a wRC+ of 205. Why did the gods of TTO forsake us?

Mercifully, our prayers have been answered, in the form of Miguel Sano. Sano is on pace to the be the first player since McGwire to finish with a TTO% of 55% or more and with a wRC+ of 150+. In fact, Sano is on pace for the highest TTO% ever: 59.4% entering Monday.

This raises the question: how is Sano doing this?

Sano has a few things going for him, namely his contact. Sano is seemingly no longer hitting balls softly — end of story. Not only is Sano posting the lowest Soft% ever (3.9%, besting Joe Mauer and Briant Roberts’ 2006 figures of 5.1%), but he’s also second in the majors in Hard%. Sano is leading the average exit velocity charts by 3.6 MPH — our lord Rob Deer must be smiling down upon him.

Sano’s plate discipline has also quietly improved. This season represents the high mark for his Z-Swing%, and the low mark for his O-Swing%. This is crucial to executing the TTO philosophy — by swinging less at pitches out of the zone, Sano draws more walks, and by swinging at pitches in the zone, Sano avoids taking strikes.
Miguel Sano Z-Swing% vs. O-Swing%

Sano is still striking out at the same rate that he’s done in his career — his 35.2% figure for 2017 is roughly in line with his career 35.7% figure. But by improving his discipline, Sano has managed to bolster the weakest portion of his TTO game — walks. Sano has seen his BB% skyrocket from 10.9% last season to 18.2% this season. Furthermore, Sano made an adjustment to his swing this offseason that may have sent his swing from one of the hardest in the game to the hardest in the game — by miles.

We are only a quarter of the way through the season, which means that we still have three-quarters of the season left to see players regress, get injured, fall into old habits, etc. But it also means that we’ve seen Sano sustain being the best TTO hitter since McGwire for an entire quarter of the season.

Sure, Sano is hitting with a .463 BABIP and a 28.6% HR/FB%. But he’s also making the best contact of anyone that FanGraphs has ever measured — so such a crazy high BABIP and HR/FB% might not be as unsustainable as you think.

Regardless of how Sano finishes the season, I and my fellow Rob Deer Fan Club members are thanking the holy trinity of Home Runs, Walks, and Strikeouts (hallowed be thine names) for blessing us with Sano, who stands to be a treat to watch for the foreseeable future.


Christian Yelich’s Growing Pains

I’ll admit it, I watch Christian Yelich far too closely, and so far this season, it hasn’t been good for my state of mind.  Not because watching the Miami Marlins nearly everyday is like staring into the abyss (I embrace the darkness), but because the 2017 Christian Yelich I dreamed of, one that was going to seamlessly continue the rapid ascent he began in 2016, one that was going to stop pounding the ball into the ground and start pounding it out of the park, one that went on a hitting streak batting third on Team USA in the WBC, hasn’t quite shown up to the plate yet in 2017.

It hasn’t been totally bleak, of course.  As of the writing of this article on May 21, he has hit six home runs, which puts him solidly on pace to beat last season’s total of 21.  And being the leggy brunette and intelligent baserunner he is, he’s scored 28 runs (Mike Trout has 29).  His fielding in his new full-time position of center field has been anecdotally good (if slightly goofy), and he’s certainly shown he sees the outfield wall as no obstacle.  But Christian Yelich is a hitter, and as a hitter in 2017, he’s been largely unremarkable.

So, what’s wrong with Christian Yelich?  With my naked eye and human brain, I would tell you that he’s swinging when he shouldn’t, he isn’t walking, and for some reason he keeps pulling the same weak ground ball straight to the second baseman.  Over and over the outcome of his plate appearance seems to be a futile trot down the first base line and back to the dugout.  And if not that, it’s a strikeout and a slightly cringe-worthy display of perfectionist angst perpetrated against his bat.  (Or a cursing match with the home-plate umpire, who was wrong, by the way.)

That’s what my flawed human brain would tell you.  What do the numbers say, when compared to his 2016 Silver Slugger season, his career averages before the onset of 2017, and the rest of MLB this year?

Christian Yelich Production
OBP AVG BABIP K% BB%
2017 .322 .261 .290 18.9 8.3
2016 .376 .298 .356 20.9 10.9
Career (through 2016) .368 .293 .363 20.9 10.4
MLB Average 2017 .322 .250 .294 21.4 8.8


The numbers would say that his production is down, and as a hitter in 2017 he has nearly been (gasp) league average.  Surprisingly, though, he’s striking out less than my impressions would have me believe, less than his own average, and the league’s.  He isn’t striking out too much, which is good, but he isn’t walking nearly enough, which is bad.  Clearly, he must be putting his bat on the ball, and somewhere between his bat and the opposing defense, his hits are disappearing.

So is there something obviously wrong with the quality of his contact, or is he merely having bad BABIP luck?

Christian Yelich Batted Ball
GB% FB% LD% Soft% Med% Hard% Pull% Cen% Opp%
2017 59.2 26.2 14.6 18.5 44.6 36.9 35.4 40.0 24.6
2016 56.5 20.0 23.4 17.5 44.5 38.0 36.0 35.1 29.0
Career (thru 2016) 60.3 17.3 22.5 16.8 48.1 35.1 31.8 38.4 29.8
2017 MLB Average 44.4 35.6 20.0 18.9 49.2 31.9 39.9 34.5 25.6


If I were to sum up Christian Yelich in a single type of batted ball, it would be a hard-hit grounder to the opposite field, so it shouldn’t surprise me that Christian’s ground-ball tendencies are back with a vengeance, despite a slight remission in 2016, but I’d hoped for a lower number.  Weirdly, though, the persistence of his nearly 60% ground-ball rate hasn’t hampered the growth of his fly-ball rate, which has risen to a career high over 25%.  This rise is encouraging, and harmonizes with the pace at which he is hitting home runs.  More balls in the air, however, have come at the expense of his line-drive rate, hollowed down to a troubling 14.6%, which I am inclined to blame for his uncharacteristically low BABIP and overall drop in production.

Another interesting difference, in addition to the disappearance of his line drives, is the overall right-ward shift of his spray chart.  Continuing his trend from 2016, he is hitting more balls to right and center field.  Christian Yelich is still Mr. Ground Ball, but he’s no longer Mr. Opposite Field.  This, combined with an increased fly-ball rate, suggests that he has tinkered with the timing and angle of his swing.  Has his approach at the plate changed as well?

Christian Yelich Plate Discipline
Zone% Swing% Contact% Z-Swing% Z-Con% O-Swing% O-Con%
2017 41.2 43.5 80.0 67.0 90.4 26.2 60.4
2016 42.7 40.5 77.3 64.3 88.4 22.9 54.0
Career (thru 2016) 42.8 43.8 79.3 63.9 88.4 23.4 60.7
2017 MLB Average 45.1 45.9 77.6 66.5 85.4 29.0 62.9

His plate discipline data reinforces the idea that he is making a lot of contact, and his O-Swing and O-Contact rates, which are closer to league average than they’ve ever been in his career, could explain the regression towards league average in his production.  Pitchers aren’t pitching around him much more than usual (though they do pitch around him more than the average batter), but he is swinging more, at pitches inside and outside the zone, and since he is Christian Yelich and his bat is drawn to the ball like a magnet, he is making contact with pitches that he’d probably be better off missing.

The conclusion I’ve come to, after turning off MLB.tv for the afternoon and meditating on the data, is an optimistic one.  Christian Yelich is swinging more, and earlier, and at slightly different angles, I think, because he is experimenting, and this doesn’t worry me because I trust that his talent, instincts, and mechanics are sound.  I’m encouraged by the six home runs I mentioned earlier (evenly distributed to all parts of the field, mind you, including one 442 ft dead center in Marlins Park), the stability of his above-average hard contact rate (his average exit velocity is 90.7 mph according to Statcast), and his outstanding ability to see and make contact with pitches inside the zone.  I think we’re merely witnessing the awkward larval stage of his evolution into the franchise player Jeff Sullivan prophesied, and I expect his experimentation to pay off soon, perhaps as soon as the second half of the current season, as long as the woes of his franchise don’t hold him down.


How Important Is Exit Velocity for the Optimum Launch Angle?

I looked at the Statcast leaderboard from 2015 to early 2017 and sorted for below-average (88 MPH) and above-average exit velo for batters who had at least 500 ABs in these two and something years as an arbitrary cutoff.

The Top 15 in wOBA above with an EV of above 88 MPH averaged a wOBA of .402 while the top 15 below 88 MPH averaged .351. As expected, the higher EV Group has a higher wOBA than the lower group.

The average LA for the harder-hitting group was 14.16 +- 2.5 while the LA for the softer-hitting group was 11.75+- 4.3. It seems like the softer group does better at a lower LA and there also is a greater variance for different LAs.

I also looked at the worst hitters of each group. The bottom 20 in the soft-hitting group came in at 10.15 degrees +- 4.2.

In the hard-hitting group, the worst wOBA hitters averaged 11.15 degrees +- 3.8.

So there seems to be some relationship of LA in the harder-hitting group, while it doesn’t matter much for the below-average group.

Now, if we expand it to 90+ MPH you get an average angle of 13.43 +- 2.9 for the good wOBA group and 12.26 +- 3.7 for the lower level group.

So the conclusion seems to be that harder hitters benefit more from increasing the LA while for the soft hitters it doesn’t seem to make a difference. Of course, I did not factor in Ks and BB in my calculations (I unfortunately had no access to wOBA/con in the leaderboard) and that is probably a big influence.

Overall, when I did a correlation test of wOBA and LA, I didn’t really find anything significant for both groups.

Where it got interesting was when we got into more extreme launch angles. The top 15 wOBA below 9 degrees was .328 (-23 points compared to the best soft hitters) while for the harder hitters the average was .358 (-44 compared to the best hard hitters).

At 7 degrees, the performance of the hard hitters was .340 (- 62 and the first time it was worse than the best soft hitters) while for the best soft hitters below 7 degrees the average was .320 (-27) and only marginally worse than minus 9.

Looking at the other end, the top hitters above 15 degrees had a wOBA of .376 (-26 compared to all LA) — maybe this is due to sacrificing contact for more lift?

And finally, in the softer-hitting group, there were only 12 guys with a LA above 15 degrees, and their wOBA was .314 (-37).

Overall, it seems like LA only has an effect if you get farther away from the average (around 11-12 degrees). Harder hitters can benefit from going higher, while for soft hitters it doesn’t matter much, as long as they stay somewhere near the vicinity of average.

The guys who really benefit from a LA change are the really hard hitters with really low angles.


The Other Adjustments Aaron Judge Has Made

Aaron Judge has been one of baseball’s best players this season, as well as one of its biggest surprises. After slashing a sub-replacement level .179/.263/.345, good for a 63 wRC+, he has jumped out near the top of the leaderboards with 2.2 WAR (7th) and .388 ISO (4th) at the time of this writing. Much has been written about the adjustments Judge has made to get to this point, but I may have something to add to that analysis.

Travis Sawchik began documenting Judge’s strikeout improvements back in March, and has since expanded upon those changes here. Judge mentioned in the original piece that his offseason philosophy focused on swing path: “For me, it’s just kind of getting into my lower half, and getting my barrel into the zone as soon as I can and keep it through the zone as long as I can. If my bat is in the zone for this long [demonstrating with his bat] my margin for error is pretty high.” That rebuilt swing helped him cut down his spring strikeout rate, a development that has continued so far this season, as Judge has posted a 28.3% K rate this year after his disastrous 44.2% in 2016.

Travis focused on the bat path changes, but Judge hinted at another adjustment when he mentioned “getting into my lower half.” Let’s look at two screenshots of Judge’s stance (from videos here and here), one of his first career home run in 2016, and the other of his 2nd jack on April 28 of this year:

It’s impossible to know, but Judge’s great start could be attributed solely to his switching to the pants-up look. Comfort and breathability can go a long way towards improved performance; just ask George Costanza.

Uniform changes notwithstanding, look closely at the differences in Judge’s setups. The first picture shows Judge more upright. Not only are his legs fairly straight, but his torso is more erect, as well. The stance from the bottom picture is noticeably lower, with increased bend in the knees and a slight upper-body lean over the plate, maintaining a similar balance. As he said in spring training, Judge is more in his lower half.

One effect this change may bring is a smaller strike zone. One of the concerns with Judge as a prospect was, ironically, that his enormous 6′ 7″ frame would create a strike zone too large for him to consistently control. Judge seems to have addressed this issue slightly by getting lower in his stance, thus decreasing the area above the plate he is responsible for. Kris Bryant is another big guy (6′ 5″) who noticeably crouches in his stance, albeit for different reasons.

Judge has gotten lower in his setup, sure, but what really matters is how he looks as he is about to enter the hitting zone. Let’s look at he top of his leg kick and plant:

Look at the height of the leg kick. Judge has made his kick much smaller this year, and while that would usually result in a slight loss of power, something tells me he has enough in reserve to make that trade-off.

When the foot lands, he gets to similar positions both years. To my eye, he has a little more knee bend this year, and his lean over the plate is slightly increased, creating a smaller strike zone as he is about to launch.

The results of all these changes have been staggering. Judge has increased his Contact% from 59.7% to 71.5%, with nearly all of that improvement coming in the zone (Z-Contact% improved from 74.3% to 85.0%, while O-Contact% improved from 40.7% to 41.0%). He is swinging in the zone more, chasing less, and has decreased his whiff rate. All together, this means more contact, and more balls put in play really, really hard.

Aaron Judge Plate Discipline
2016 2017 Change
O-Swing% 34.9% 22.5% -12.4%
Z-Swing% 59.7% 65.4% 5.7%
O-Contact% 40.7% 41.2% 0.5%
Z-Contact% 74.3% 85.0% 10.7%
Contact% 59.7% 71.5% 11.8%
SwStr% 18.1% 11.8% -6.3%
K% 44.2% 28.3% -15.9%

To be clear, I am not suggesting that getting lower in the setup triggered some breakthrough for Judge that allowed him to miss less. When players tinker with their swings, it is seldom one big change that unlocks massive potential, but rather a series of smaller adjustments that work in tandem and add up to improvements. Think about Eric Thames, who not only worked on meditation, visualization, and tracking when struck with boredom in his apartment, but also greatly improved his flexibility. For Judge, getting lower in the stance did make the strike zone smaller when he was about to swing. It also decreased the amount of head movement he had as the ball was in flight. Judge’s head noticeably lowers from stance to plant in the screenshots from 2016, but there is virtually no movement in 2017. A stable head makes it easier to track a moving baseball. The smaller leg kick contributes to the improved head stability, and the increased simplicity makes it easier for Judge to be on time. All of that, in addition to an improved swing path that stays on plane with the ball longer, led to more contact.

It will be interesting to see where the league goes from here regarding Judge. He has made his adjustment, and now it is up to pitchers to start attacking him differently. My guess is that pitchers will start throwing him fastballs up and in off the plate to prevent him from extending his gargantuan biceps, and A LOT of soft stuff away. Hard in, soft away; innovative, right? The problem, as Jeff Sullivan has noted, is that Judge is so otherworldly strong that he can get beat in off the plate and still inside-out a home run the other way. Someone will figure Judge out and adjust. Judge will struggle, then adjust, as he has shown he will do at every level of pro ball he’s been at.


Lance McCullers is Changing Things Up

The narrative of Houston Astros starting pitcher Lance McCullers has been well-documented. In his first couple seasons in the major leagues, he flashed electric stuff, but did not have the health or consistency to be considered a top pitcher. One of those consistency issues was his road pitching performances.

Up until May 5th, McCullers was sporting a 5.32 ERA on the road against 2.11 ERA at home. But across his last three road starts, he has accumulated 19 innings and given up no runs, allowing just nine hits and walking only four. He may able to attribute the success to one thing: his changeup.

McCullers has had a changeup his whole career, but it was used only 7.4% of the time in the 2015-16 seasons. McCullers, along with Rich Hill, has sort of redefined curveball use, as he thrown more curveballs than fastballs the last two years. McCullers essentially threw two pitches his first two seasons in the majors, and the changeup was needed simply because any starter needs to throw more than two pitches. The changeup showed promise, but McCullers just did not have the command of it to make it a prevalent pitch.

Most of you have probably seen this, but if you haven’t, well, just watch. Yes, a 94mph changeup (kind of). McCullers tantalized us with that in 2015, but the changeup sort of disappeared after that.

It is back now, and in a big way. McCullers has thrown the pitch 22.2% of the time over his last five starts, the last three of which were those dominant road performances. His first start with the changeup increase didn’t go so well, as he gave up five earned runs against the Cleveland Indians. But McCullers has stuck with it, and he is dominating now.

Hitters are batting just .192 against the changeup this year, a massive improvement from the way it was smacked around to a .458 batting average last year. To give you an idea of what the pitch is doing to batters — McCullers throws the changeup in the zone only 27.2% of the time, but is drawing a swing 41.2% of the time, which is more often than on his fastball. At 89.3 MPH on average, McCullers has thrown the hardest changeup in the league among qualified starters. His K%-BB% on the pitch in 2017 is 22.2%. Simply, the changeup is dominating players. McCullers overall K% has dropped from 27.3% in his career to 24.2% in his last five games, but this has not been a negative.

McCullers’ fastball has not been a strength in his career, as it’s average against in 2015-16 was .334. His success lived off the curveball in those years because of his lack of an effective fastball or changeup. Surprisingly, the more changeups thrown has not caused a decline in fastballs thrown, but rather in curveballs. McCullers has thrown the curve nearly half the time in his career, but has thrown it only 38.0% of the time in his last five starts. He is throwing roughly the same amount of fastballs, but with much improved results.

His fastball GB% is up to 61.2% this year, much improved from his 37.2% mark in 2015. The average against is way down from .334 in 2015-2016 to .200 this year. Most importantly, though, McCullers has halved his BB% on the fastball from his first two seasons. Hitters were destroying the fastball in the zone and not chasing on it out of the zone. McCullers is getting fewer strikeouts because he is throwing fewer curveballs, but the overall pitching results are better. He is drawing softer contacts and walking fewer guys at the cost of a couple strikeouts.

McCullers decided to change up his extreme curveballing ways with some more changeups, and it is working beautifully. The changeup is dominating hitters, creating strikeouts and soft contact without walking guys. But perhaps most importantly, an effective third pitch from McCullers is finally keeping people on their toes, and they can no longer sit on the fastball. But don’t forget about his curveball, which is still one of the best in baseball.

The consistency at home and away from Minute Maid Park is finally there, and McCullers is pitching lights out right now. Health is still a concern, but McCullers is yet to have an issue this season. If his health keeps up, Dave Cameron may be saying “I told you so!” come November.


Albert Pujols Still Loves Having Ducks on the Pond

While Albert Pujols is the active leader in RBI and is 13th all-time with 1,849, there is something different about how he is getting them this year. He has 32 RBI, good for second-best in baseball, despite the fact that he has a meager .247/.293/.370 slash-line. Even considering the fact that Pujols has the exclusive luxury of batting after Mike Trout, my brain has a hard time comprehending how this could happen without breaking the matrix that is baseball correlations. So let’s dig.

First of all, high rates of RISP is, in fact, a major contributor: Pujols has had a runner in scoring position in 54 or 174 plate appearances this year, good for a 31% rate. As a mark of comparison, his career rate of RISP is 28%, so he’s getting a little boost this year. However, the interest is in the parity of those plate appearances, where he has produced a .326/.407/.478 slash-line compared to a .216/.242/.328 in situations with no RISP.

But it doesn’t stop there. Let’s go deeper into these ABs with RISP. In situations with at least two men on, Pujols has 30 plate appearances and has hit a vintage Pujolsian .370/.433/.630! This results in an OPS+ of 183, which is roughly equivalent to Barry Bonds’ career OPS+. Not bad. In contrast, however, with fewer than two men on, Pujols has hit .222/.264/.319 in 144 plate appearances this season, for an OPS+ of 59, which is equal to the career OPS+ of Rey Ordonez. D’oh!

So there’s life in the old dog yet! Or maybe the Central American Cichlid is more like it. A species that pretends to be dead only to lure unsuspecting prey. Time will tell if Pujols will remain this great with RISP (and this bad with no RISP). If it does hold up, it’s too bad that Pujols has a full no-trade clause to go along with the 114 million dollars he’s owed through 2021, because he could be a great pinch-hitter for a National League team. In the meantime, it is really going to drag the Angels down if they continue to plug “clutch Rey Ordonez” in the 3 or 4 hole every night.