Using Statcast Data to Measure Team Defense

As I’m sure you all know, Statcast allows us to measure the launch angle and velocity for each batted ball. These measurements afford us the ability to estimate precisely the expected wOBA value of every batted ball. Due to the skills of the opposing defense (as well as, admittedly, factors like luck, weather, and ballpark quirks), these estimated wOBA values are often drastically different from their actual values. That is the idea behind Expected Runs Saved (xRS), a metric that I have created to measure team defense. What follows is a discussion of the xRS methodology and some results.

The methodology: The calculation of xRS is actually quite simple. I started by downloading Statcast data from Opening Day through August 29th using Python’s pybaseball module. I then created a dataset consisting of all fair batted balls (excluding home runs) during that time frame. Conveniently, the downloaded data already has the expected wOBA value (based on exit velocity and launch angle), and the actual wOBA value (based on the outcome of the play) for each batted ball. Since we want to penalize teams for making errors, I changed the actual wOBA values for errors from 0 to 0.9 (the value of a single). Then all we have to do is take the average of each metric by team, find the difference, convert that to run values, and we have Expected Runs Saved.

Note that xRS is quite a bit more simplistic than UZR or DRS, as it doesn’t include any of the defensive value derived from keeping baserunners from taking the extra base, preventing steals, turning double plays, etc. While these surely play a role in run prevention, they are less important than converting batted balls into outs, and since I have a full-time job I decided to keep it simple and ignore them.

The results: Let’s start with the most obvious question: which team has the best defense?

It’s the Angels, and it’s not particularly close. While their pitchers have allowed a lot of hard contact (.323 batted-ball xwOBA, 28th in baseball), their actual wOBA on contact is 2nd in baseball at .291, trailing only the Dodgers (.284), who, as Jeff Sullivan recently noted, excel at inducing weak contact.

On the opposite end of the spectrum are the Blue Jays, who have been generally good at generating weak contact (.305 batted-ball xwOBA, 5th in baseball) but terrible at converting those weakly hit balls into outs (.322 batted ball wOBA, 28th in baseball).

In both cases UZR tends to agree, ranking the Angels and Blue Jays 1st and 27th, respectively. Due to (I think) the simplicity of the model, the run values for xRS are quite a bit more extreme than those of either UZR or DRS, but it ranks the teams in generally the same order. At the very least, xRS doesn’t disagree with UZR and DRS much more than the latter two disagree with each other.

Two teams that xRS likes a lot more than UZR and DRS are the Mariners (2nd in xRS, 11th in UZR, 15th in DRS) and Yankees (4th in xRS, 13th in both UZR and DRS). Meanwhile, it dislikes the Dodgers (12th in xRS, 3rd in UZR, 1st in DRS) relative to the other metrics, as well as the Reds (28th in xRS, 5th in UZR, 4th in DRS). Why is this happening? I really don’t know. Could be some defensive components I have left out of xRS, could be ballpark effects, or it could just be that defensive metrics are weird. It remains a mystery. Such is baseball, and such is life.


Two Reasons Why Mookie Betts Has Been Less Awesome

Mookie Betts was incredible in 2016. As the third-best player in the Majors, he posted a 7.9 fWAR. But this year has been different. His .261/.341/.434 triple slash line is a far cry from the one he posted last season of .318/.363/.534. His 101 wRC+ tells us he’s producing runs at a rate that is barely above league average, while also revealing a lot of his value has come from his defense.

And yet, he’s still on pace for about 4.5 fWAR, which still makes him one of the game’s top assets. He continues to be awesome, but a different kind, and different enough to ask “what’s changed?”

betts 4

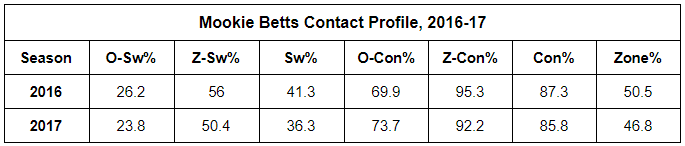
There are some significant differences from last year to this year in Betts’ contact profile. In general, he’s swinging less. Like, a lot less. Last year he took the 20th-most pitches in the league. This year, he’s taking the fourth-most. He’s also swinging at fewer pitches in the zone, while making more contact when he goes outside it. That’s an odd combination for a player so disciplined at the plate. It suggests pitchers have adjusted to Betts and that he might have picked up on it, but that he hasn’t quite countered yet.

And though it helps us see what’s fueling a lower triple slash this year and, by matter of course, lower WAR, it doesn’t tell us how pitchers have adjusted to Betts. He’s seeing just about the same pitch mix this season as last, save for one thing. He’s getting about 22% sliders this year, or an additional 5% more than in 2016.

His wOBA against sliders is just .276 this season. That’s lower than what even his expected wOBA against sliders was last year, which he topped by 57 points. And like dominoes, this one push is impacting other pitches he’s seeing.

betts 3

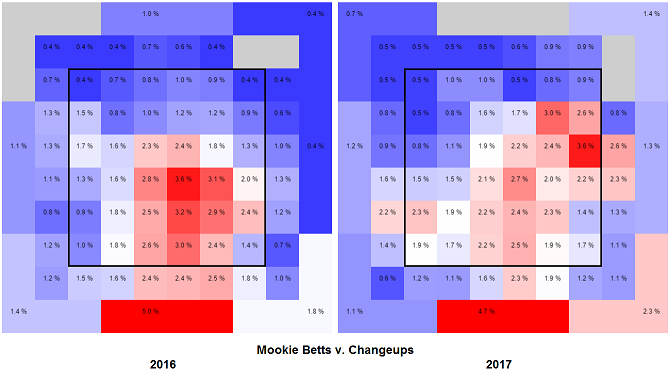
Changeups are also giving Betts considerable problems, and it could be because he’s been oddly less patient with them than other offerings in 2017. Despite seeing almost the same exact amount this year as last, and swinging at them at a nearly identical rate, his weighted pitch value against the offering is more dramatic than any other. He’s managing an unimpressive -0.43 mark this season. In 2016? It was at 3.67. He’s gone from waiting for changeups to show up in his wheelhouse to swinging at them freely. It’s extremely uncharacteristic for Betts, and it’s yielded just a .260 wOBA against the pitch.

Consider how the changeup is designed to induce weak contact, how it can often fade and drop away toward the lower outside corner of the zone, and how sliders drive to the same portion of the plate. Pitchers seem to have found a way to sequence their stuff against Betts to thoroughly influence the damage he can create with the bat.

This is particularly true with right-handers, against whom Betts is batting only .253 in 2017. Last year, he hit .331 against them. And because the league features about two and a half as many right-handers as southpaws, the trouble for Betts becomes emphasized that much more.

Mookie Betts is still exceptional. He’s still demonstrating elite control of the zone, as evidenced by a walk rate that equals his K rate. But there appear to be plate adjustments that will be necessary for him to make if he’s to return to being one of the game’s absolute best.


Recent Historical Comps for Rhys Hoskins

This is probably not going to be a long article but I was curious which players fit the Hoskins profile best in recent history. Carson already established the Hoskins profile as a guy who hits the ball in the air and makes contact.

For that, I searched first basemen that played from 2002 to 2017. I used 2002 because that is the year we started to have batted-ball data. It also means that it mostly covers a high-K era, although it got more extreme recently. As a cut-off, I used 1500 PAs played. 96 players fulfill those criteria.

First, I filtered for an ISO of .200 or greater. I also filtered for a BB% of greater than 9% (because Hoskins also walks), a K% of 20% or smaller, and finally a ground-ball rate of 40% or under.

That leaves a list of just eight names:

Name G PA HR BB% K% ISO BABIP AVG OBP SLG wOBA wRC+ WAR GB%
Carlos Delgado 1044 4523 244 12.40% 19.50% 0.26 0.298 0.278 0.38 0.538 0.385 134 21.5 38.50%
Derrek Lee 1393 5980 259 11.50% 19.40% 0.222 0.325 0.289 0.374 0.511 0.38 130 31 39.30%
Jeff Bagwell 513 2195 100 13.80% 18.30% 0.22 0.301 0.277 0.382 0.496 0.378 127 12.2 39.70%
Mark Teixeira 1862 8029 409 11.40% 17.90% 0.241 0.282 0.268 0.36 0.509 0.371 127 44.9 38.70%
Anthony Rizzo 885 3799 165 11.20% 16.80% 0.222 0.288 0.269 0.368 0.491 0.369 133 23.8 39.20%
Edwin Encarnacion 1646 6781 342 11.10% 16.50% 0.233 0.272 0.265 0.354 0.498 0.366 126 29.7 36.40%
Rafael Palmeiro 573 2390 122 13.30% 11.50% 0.231 0.249 0.264 0.364 0.495 0.365 120 7.2 32.80%
Paul Konerko 1827 7458 355 10.20% 15.00% 0.211 0.285 0.278 0.357 0.489 0.363 120 18 37.90%
Average 1217.875 5144.375 249.5 0.118625 0.168625 0.23 0.2875 0.2735 0.367375 0.503375 0.372125 127.125 23.5375 0.378125

The list is a pretty good group. It averages 23 career WAR, a 127 wRC+ and a .273/.367/.503 line. The only downside there might be is that the fly-ball profile could supress BABIP some. The group has a .287 BABIP which is below the league average of .300 during that time span, especially if you consider how hard those guys hit the ball. That means that those guys do underperform their K/BB/ISO profile a little bit. For example, Konerko has a very good power/contact/discipline profile that by my math points to more of a 140+ wRC+, but his actual wRC+ is 120. That is the disadvantage of that extreme profile — you are losing some BABIP to fly outs, especially if you hit more balls in the high fly ball range, which tend to be either HRs or outs, and even more so if there is a slightly elevated pop-up rate coming in conjunction with the fly balls.

But overall that doesn’t matter that much if the K/BB/ISO profile is that good; those guys are all really good hitters even with a slightly lower BABIP. Just expect Hoskins’ hit tool to play under his contact rate a little bit due to that Bautista-like profile (who also had that lower-BABIP, pulled-fly-ball profile with great contact and walk rate).

That means Hoskins might be a .265 hitter despite above-average contact, which also makes his SLG play a little bit down on his power, but he should still get on base on a very good clip and produce excellent power. Just be a little careful when looking at his power, contact, and discipline if you want to bank him for a .300 average/.600 SLG for your fantasy team. He might pay some cost with his elevating that doesn’t come in the form of Ks, but BABIP. But nonetheless he should be very good, even if it is “just” a Konerko/Teixeira type of player and not the next Miggy like some Philly fans probably think right now.


Sandy Alcantara Controls Nothing

Noted stoic Epictetus famously said, “Freedom is the only worthy goal in life. It is won by disregarding things that lie beyond our control.” If we accept this to be true, then St. Louis Cardinals prospect Sandy Alcantara might need to disregard small balls of cork wrapped in yarn and cowhide.

Alcantara was called up from AA to join the big-league club on Friday, bypassing AAA completely.

For the purposes of this article, we’re going to assume control is referring not to a pitcher’s ability to not walk batters, but by his ability to throw the ball somewhere that, by the end of the exchange, it ends up in his catcher’s mitt, be it as a ball or a strike.

By this definition, in 125.1 innings pitched for Springfield this year, Alcantara has controlled next to nothing. He has thrown 20 wild pitches and hit 15 batsmen, all with a repertoire that includes a fastball which, according to Eric Longenhagen, “sits 95-97 and will touch 101 with plus movement.”

This comes out to Alcantara being expected to either hit someone or throw the ball to the backstop once every 3.58 innings. For this study, let’s call this his “Craziness Per Inning Pitched” or CPIP. I know it would be better phrased as innings pitched per craziness, but IPPC isn’t an acronym that rolls off the tongue.

Here is a list of (as far as I can tell with my inexperienced play indexing) the lowest single-season CPIPs of all time (minimum 50 IP).

  1. 2011 Daniel Cabrera: 3.4
  2. 1995 Toby Barland: 4.35
  3. 2000 Hector Carrasco: 4.37
  4. 2000 Matt Clement: 5.26
  5. 2010 A.J. Burnett: 5.32

As you can see, Alcantara, with his 3.58 CPIP would slide right in at second lowest all-time. However, the top three on my list were all used primarily as relievers, where you can get away with a little more wildness. Only four of Alcantara’s 125.1 innings have come out of the bullpen this season. Among starters, his CPIP would rank as the lowest all-time.

Now, obviously, these are all major-league seasons, and Alcantara’s was in AA, but still, a player being expected to throw a ball that ends up somewhere other than in his catcher’s mitt once every 3 1/2 innings is some special craziness at any level. You could probably even make the argument that, due to increased competition and pressure, a prospect who is suddenly vaulted two levels higher should expect to see an increase in wildness.

With the Cardinals promoting fellow pitching prospect Jack Flaherty as well, it does seem likely that Alcantara will be pitching in relief for the Cardinals, but Cabrera’s record is still within reach if he can just allow himself to control a little less.


The Reality of the Anti-Ground-Ball Revolution

Is your name Christian Yelich? If not, please stop hitting ground balls. Right now. Please. Thank you.

Christian Yelich is the only MLB player to log 2400 PAs over the course of 2014-2017, hit 55% or more ground balls and log a wOBA of .340 or higher in a single-season. And he’s done it in all four seasons.

How does he do it? He combines a league-average line-drive rate (22%) with a .270 batting average on ground balls and a 10%+ walk rate.

Sure, Jean Segura (3yr+ GB 55.9%) did it last year, but he dropped his GB rate to 53% and had a HR/FB excursion up in the 13%+ range that year.

You might point out that during the same year, Jonathan Villar managed a .356 wOBA, but he needed an even-better-than-Yelich .316 average on ground balls with a 20% HR/FB ratio and an 11%+ walk rate. We’re talking about the definition of outlier seasons.

After a quick back-and-forth with another FanGraphs reader/commenter, John Autin, in the recently published Justin Turner piece by Travis Sawchik I started wondering what sort of wOBA does each type of player carry based on the percentage of ground balls that player hits on average. But for starters, I had to understand how many players carried ground-ball rates in what ranges.

wOBA

More than half of the qualified player seasons in the last four years have come from players who averaged 40-50% GB. Of those, 65 (16%) resulted in players contributing less than a .290 wOBA. FanGraphs’ own wOBA rule of thumb page considers these seasons “awful.” This includes seasons you might remember such as “Albert Pujols’ season in progress (2017),” “Every Billy Hamilton season ever,” and “most seasons from Alcides Escobar.”

To provide a little more context, let’s view these player seasons on a 100% graph. Players who have averaged greater than 40% ground-ball rates have a 4-in-10 or better chance of producing a below-average season by wOBA standards (.310-.319 bin and lower).

wOBA2

The “Great” (.370+) seasons lodged in the 50% bin are from Eric Hosmer (2017), DJ LeMahieu (2016) and Ryan Braun (2016). Braun needed an outlier HR/FB (~29%) season, LeMahieu is one of the ten deadliest line-drive hitters in all of baseball, and Eric Hosmer, well, he’s straddling the line 5/6th of the way through the season. There just aren’t that many great hitters carrying a GB rate between 50-55%. You’re going to either need to hit a TON of line drives to make up for all those ground balls, or pound three out of ten FBs for a HR. Otherwise you’re looking at a very average offensive season a quarter of the time, and well below average another 50% of the time.

What I’ve learned is that 30-40% GBs is the sweet spot, and only a quarter of MLB player seasons from 2014 have been recorded by players in this bin. Freddie Freeman, the king of line drives, has lived in the 30-35% GB range over this time period. He’s joined by players like Lucas Duda (putting up three above-average seasons), Kris Bryant, Matt Carpenter and Brandon Belt.

Interestingly enough, Ian Kinsler might want to rethink his approach. Along with a high infield fly rate, he’s just not doing enough damage with the HR to put up high wOBAs. The exception being his 2016 and 2011 seasons. Being that he’s an above-average line-drive hitter, he could benefit from shifting his focus a little more that way as he ages through his last few seasons. Or I suppose he could benefit from a more hitter-friendly home park as he enters free agency this year.

Now that we have the table set, I’d like to share a short list of players that are putting up terrific wOBAs, but could benefit from putting even more balls in the air. Of course there’s Christian Yelich, but let’s let him do what he’s doing. And while we’re at it, we won’t recommend any changes for Joey Votto.

One thing I’ve noticed, and this isn’t a new revelation to me, is that Cuban players like Puig, Grandal, and Abreu all hit a very high number of ground balls, even while enjoying quite a bit of success. But if they ever decide to make the anti-ground-ball leap, they may find an MVP trophy or two. Ditto for George Springer. Let’s get him ripping air balls and see how high he can fly.

And maybe there are a couple of careers to save as well, a la Yonder Alonso or Justin Turner? Here are the low-flying 2017 players who could use the #turneradjustment

Looking team by team, at the approaches employed by their players who gathered at least 400 PAs minimum in any given year, and also have accumulated 1000 PAs over the last four years, we can pick out some trends as well. I was a little surprised to see the Mets at the top of the list, but the A’s, Tigers, Reds and Blue Jays didn’t surprise me as “put it in the air” types of teams. You’ve got some of the poster children for the air-ball revolution on those teams such as: Donaldson, J.D. Martinez, Jose Bautista, and Yonder Alonso. Those teams also feature some of the game’s deadliest line-drive hitters in: Nicholas Castellanos, Joey Votto, Miguel Cabrera, and Daniel Murphy (from his Mets years).

On the flip side, we see the Marlins, led by aforementioned ground-ball expert Christian Yelich, pound-it-into-the-ground Dee Gordon, and Ichiro Suzuki, as well as a team-wide approach by Ozuna, Realmuto, Hechavarria, and Martin Prado to hit ground balls and line drives. Prado is the only one other than Yelich to do it well.

The White Sox were led by Adam Eaton (54% GB), Avisail Garcia (52%), Alexei Ramirez (49%), Yolmer Sanchez (48%), Melky Cabrera (47%), and Jose Abreu (46%). Tim Anderson is the latest, though he doesn’t factor into the analysis yet, to pound out 52% ground balls like it’s his job and turn in awful wOBA seasons (.315 and .274 in progress).

2014-2017 Player Seasons By Team
Team Air Ballers Neutrals Ground Ballers Air to Ground Ratio
Mets 12 4 2 6.0
Athletics 9 6 3 3.0
Tigers 13 10 5 2.6
Reds 8 10 4 2.0
Blue Jays 9 8 5 1.8
Padres 3 9 2 1.5
Rays 7 8 5 1.33
Twins 8 6 6 1.29
Rockies 9 2 7 1.29
Orioles 5 13 4 1.25
Cubs 8 7 7 1.14
Multi-Team 15 15 14 1.07
Nationals 9 5 9 1.00
Phillies 8 3 10 0.80
Pirates 10 3 13 0.77
Indians 5 9 7 0.71
Cardinals 7 7 10 0.70
Yankees 3 14 5 0.60
Royals 9 4 16 0.56
Angels 5 8 9 0.56
Astros 6 6 11 0.55
Mariners 5 4 13 0.38
Dodgers 3 11 9 0.33
Brewers 3 8 9 0.33
Red Sox 5 4 16 0.31
Giants 3 12 10 0.30
Braves 3 12 10 0.27
White Sox 2 1 17 0.12
Diamondbacks 1 7 12 0.08
Rangers 1 9 13 0.08
Marlins 1 3 21 0.05
Minimum 1000 PA from Player 2014-2017
Minimum 400 PA single season to be included

What if Postseason Winners Got to Draft Postseason Losers?

The MLB playoffs had not changed its format for the past 13 years. This season, however, we will see a “minor” change taking place during the World Series. The home-field advantage will belong to the team with the best regular-season record, thus ending the already established tradition of it pertaining to the league that won the All-Star Game in July. As this is not a mind-blowing change, I’m here to propose something much more interesting that will probably never happen, but still.

What if after each round of the postseason, from the wild-card games to the league championships, the players of each losing team entered a pool from which the winning teams could draft some of them for the next round of the playoffs?

First of all, we must recognise that we hate when a player gets injured and misses playing time. Were it in our hands, we’d put our favourite players on the field for the 162 games, make them bat first, get as many plate appearances as possible, and see their numbers grow during the summer and into the autumn with pleasure. Even more, how frustrating it is when one of our favourite players, or just one of the best players of the game (hello, Mike Trout!) is stuck on a franchise that never ever makes it to the postseason, or that every time it does it seems to not be able to advance past the first round?

On top of this, there is the seeding and the way we watch underdogs trying to beat the odds and outplay the best teams of the regular season on a yearly basis, which in all honestly is nothing crazy given how much of a lottery the game becomes once we reach October. Wouldn’t it be great to do something to even the field a little and make the “bad” teams get more on par with the “good” teams during the playoffs?

Enter the Losers-Turned-Into-Winners Draft! Let’s explain the basics and then run some historical simulations based on them.

The idea behind this system is pretty simple. As things are nowadays, the best team from each division of the American and National Leagues automatically makes the playoffs, followed by two wild-card teams that can come from any of the divisions and are determined by their record during the regular season. We can therefore assume that the two wild-card teams from each league, which have a round of the postseason exclusively dedicated to them, are the two worst teams from each side of the bracket. Once a winner is named, that team advances to the Divisional Series and faces the best-seeded divisional champion. Seeds number two and three also go against each other, and after that the Championship Series of each league comes to fruition to determine who will face who in the World Series.

What I propose is to take advantage of the seeds assigned to each team at the start of the postseason, and play a two-round draft after each round of the playoffs is finalised, with the picking order going from worst-to-best remaining seeds. Each team would be able to pick two players, no restrictions applied to their position (so they can pick two batters, two pitchers, or a combination of both), and players from all losing teams would be available at the draft for any team, no matter the league they play for. Once a draft is completed, the players left unselected are removed from the pool, so players not selected during the draft held after the wild-card round are no longer available for the draft held after the Divisional Series, and so on.

This system would solve some of the problems fans need to deal with during each season, and most of all would make the playoffs as exciting and competitive as they could get. Every star player would get far more chances to win the World Series (who is going to pass on Kershaw if the Dodgers fall at any point?) during his career, players wouldn’t mind re-signing long-term deals with the franchises they’ve always played for as they would “only” need to reach the postseason in order to have a shot at the title from multiple angles and not only depending on the success of their team, low-seeded teams (supposedly worse than the rest of the field) would have influxes of talent as long as they progress as they would pick first in those drafts, and fans would have even more events to get excited about during an already exciting time. Don’t fool yourself, this is a win-win master plan!

Let’s take a look at how the 2016 MLB postseason could have changed had this draft-system being in place. To not make this too confusing, we will leave the results of each round as they were without taking into account the players taken by each team after each round’s draft. We would comment on how those picks could have affected the outcome of the playoffs, though.

The wild-card round made Toronto face Baltimore for a place in the AL Divisional Series against Texas. In the National League, San Francisco had to play against New York to stay alive. After those two games were played, the Blue Jays and the Giants made it to the second round. What would this have meant in our loser-draft system? Given the regular-season results, San Francisco (.537 W-L%) would have picked first and Toronto (.549 W-L%) second in a draft with a pool made out of the rosters of both the Mets and Orioles. Without much thinking applied to player valuations, these would have been the best-WAR players available per Baseball-Reference.com:

  1. Manny Machado, 3B (BAL): 6.7 WAR
  2. Noah Syndergaard, P (NYM): 5.3 WAR
  3. Zach Britton, P (BAL): 4.3 WAR
  4. Kevin Gausman, P (BAL): 4.2 WAR
  5. Chris Tillman, P (BAL): 4.1 WAR
  6. Jacob deGrom, P (NYM): 3.8 WAR
  7. Bartolo Colon, P (NYM): 3.4 WAR
  8. Chris Davis, 1B (BAL): 3.0 WAR
  9. Yoenis Céspedes, LF (NYM): 2.9 WAR
  10. Asdrúbal Cabrera, SS (NYM): 2.7 WAR

With a rotation already featuring Cueto, Bumgarner and Samardzija, among others, San Francisco could have added Manny Machado to replace Conor Gillaspie (1.1 WAR). Toronto may have followed that selection with that of Syndergaard (back up north!) in order to improve their rotation for the Divisional Series, and the last two picks could have gone either way with top-notch players on the board (San Francisco could have gone Yoenis’ way to move from Angel Pagan, and Toronto with Chris Davis to replace Justin Smoak at first). If that is not an improvement, you tell me what is.

Moving onto the Divisional Round, the Dodgers, Cubs, Indians and Blue Jays defeated the Nationals, Giants, Red Sox and Rangers, respectively. In this case, both Machado and Céspedes would become available again, and enter the draft pool for the remaining four teams. This again goes in favour of star players, as they would keep moving onto later rounds if they’re still good enough as to keep being selected round after round, and we all want to watch the best players competing for the highest stakes. These are the second round’s best available players, again per Baseball-Reference.com WAR (keep in mind all players from New York and Baltimore, barring those selected by San Francisco – now eliminated from contention – are no longer available):

  1. Mookie Betts, RF (BOS): 9.5 WAR
  2. Manny Machado, 3B (BAL/SFG): 6.7 WAR
  3. Adrian Beltre, 3B (TEX): 6.5 WAR
  4. Max Scherzer, P (WSN): 6.2 WAR
  5. Dustin Pedroia, 2B (BOS): 5.7 WAR
  6. Johnny Cueto, P (SFG): 5.6 WAR
  7. Tanner Roark, P (WSN): 5.5 WAR
  8. Jackie Bradley, CF (BOS): 5.3 WAR
  9. Rick Porcello, P (BOS): 5.1 WAR
  10. David Ortiz, 1B/DH (BOS): 5.1 WAR
  11. Madison Bumgarner, P (SFG): 5 WAR
  12. Cole Hamels, P (TEX): 5 WAR
  13. Buster Posey, C (SFG): 4.6 WAR
  14. Daniel Murphy, 2B (WSN): 4.6 WAR
  15. Brandon Crawford, SS (SFG): 4.5 WAR

By this point, and looking at the regular-season results, the seeding for the draft would make teams pick in the following order: Toronto (.549 W-L%), Los Angeles (.562), Cleveland (.584) and Chicago (.640). Judging by the wild-card draft picks already made by the Blue Jays and the rest of their roster, we may infer their first pick would be Mookie Betts to replace Michael Saunders in left field. Los Angeles would probably look to improve their offense with their first pick, which could have been Dustin Pedroia in order to remove Utley from the lineup. Cleveland, given their not-so-great pitching staff, would have selected Scherzer in a hurry, and Chicago may have closed the first round of selections with that of Buster Posey to get aging David Ross out from behind the plate.

With pretty much every roster spot already stacked for every team, the second round would become some sort of a best-available-pick affair. I’m betting on Toronto getting Manny Machado and finding a spot for him, taking advantage of the designated-hitter slot in the lineup. The Dodgers could improve their pitching rotation with the addition of Johnny Cueto. Cleveland’s outfield would welcome the addition of Jackie Bradley more than anything. And finally the Cubs would close this round by going the pitching route and picking Madison Bumgarner.

Without taking those additions into account and respecting what happened in real-world MLB, after the Divisional Round finished the two teams making the World Series for the 2016 season were the Chicago Cubs and the Cleveland Indians, which means every player from Toronto’s and Los Angeles’ rosters (including those being picked in the first two drafts) become available in the final postseason draft event. Let’s take a look at the best players on the board by their regular-season WAR:

  1. Mookie Betts, RF (BOS/TOR): 9.5 WAR
  2. Josh Donaldson, 3B (TOR): 7.5 WAR
  3. Manny Machado, 3B (BAL/SFG/TOR): 6.7 WAR
  4. Corey Seager, 3B (LAD): 6.1 WAR
  5. Dustin Pedroia, 2B (BOS/LAD): 5.7 WAR
  6. Johnny Cueto, P (SFG/LAD): 5.6 WAR
  7. Clayton Kershaw, P (LAD): 5.6 WAR
  8. Noah Syndergaard, P (NYM/TOR): 5.3 WAR
  9. Justin Turner, 3B (LAD): 5.1 WAR
  10. Aaron Sanchez, P (TOR): 4.9 WAR
  11. J.A. Happ, P (TOR): 4.5 WAR
  12. Edwin Encarnación, 1B/DH (TOR): 3.7 WAR
  13. Marco Estrada, P (TOR): 3.5 WAR
  14. Joc Pederson, CF (LAD): 3.4 WAR
  15. Kevin Pillar, CF (TOR): 3.4 WAR

As can be seen, five of the best 15 players available come from teams already out of contention, with Manny Machado being the only one having made it through the first two postseason drafts by going from Baltimore to San Francisco to Toronto, which proves his value among his peers. The Blue Jays, both from their original roster and their picks, provide nine of the 15 players, while the Dodgers only add four original men and two acquired through the draft.

In terms of what Chicago and Cleveland could do in order to create the best possible rosters with the World Series in mind, multiple approaches could be taken by them. Both teams made the finals without playing in the wild card, so they only have two draftees each between their players – not that they need much more. As Cleveland finished the season with a worse record, the Indians would pick first, and they’d probably take Clayton Kershaw because you just simply don’t pass on the best pitcher of his era. Chicago’s pitching is already stacked, so they would probably look at the outfield and bring Mookie Betts in. Jose Ramirez had a great season for Cleveland in 2016, and it would be hard for the Indians to leave Donaldson on the board, although they may look at the outfield options and pick someone like Pillar or Pederson to get Lonnie Chisenhall out of the lineup. Let’s go Joc Pederson here. Finally, Chicago would close the draft by taking Johnny Cueto, as they don’t even have holes to fill in their offense at this point.

And with this third and final couple of draft rounds, the postseason would end in a World Series win for the Cubs over the Indians in a series that would feature two incredibly great teams that through the course of the playoffs would have added the names of Betts, Scherzer, Cueto, Kershaw, Bradley, Bumgarner, Posey and Pederson to their rosters. Are you telling me those eight players wouldn’t make the final meetings of the season much more exciting than they could ever be? While I haven’t applied much thought to each selection and I’ve based them mostly on each player’s WAR or flagrant team needs, the process could turn into a really tough war between teams at the time of picking players not only for their benefit but also to block other franchises from taking them, and improving spots where they may lack a player of certain quality, be it in their hitting lineup or in their pitching rotation.

This winners-draft-losers type of draft will probably (definitely) never happen. There would be much trouble implementing it and a lot of collateral implications that make it impossible to be a real thing. But hey, at least we can dream of a parallel world where Mike Trout could reach the World Series each and every seas– oh, yes, I forgot he plays for the Angels…


Better Stats for Finding the Next Rhys Hoskins

Carson had an interesting article about finding contact hitters who can elevate. That makes a lot of sense, especially if the ball is really juiced, because that new environment means that more FBs are going out even though they are not totally crushed. A couple months ago I already correlated power and contact together with walks, and had pretty decent correlations with performance. Power and contact together is definitely a good thing. However, when it comes to low-minors players, often the power is not present yet, so it can make sense to look at the batted-ball profile instead when evaluating potential for growth.

Now, that is not a hard rule, and you could actually say that a strong ground-ball hitter like Daniel Murphy when he was young has actually more potential for growth than a weak FB hitter when he actually learns to elevate, and he and others have shown that it is possible to make that change even in the late 20s, but we also know that sustainable swing changes are quite hard to attain (there are the Murphys and Donaldsons but also guys like Jason Heyward who tinker with the swing every year and make it worse because muscle memory gets confused), and it is probably a safer bet that a young minor leaguer (17-19-year-olds especially) can add some muscle and make some of the FBs go over the wall.

Instead of FBs, however, I have tried a new stat. Instead of FB% I have used a stat I called “effective off the ground percentage.” I used off the ground percentage because line drives are just as good as FBs (actually better) and everything off the ground is good unless it is a pop-up. Basically it is 100 minus GB% minus PU% (IFFB*FB/100). I think that is important because pop-ups are a terrible result and we do know that extreme FB hitters like Schimpf, Story, or Odor tend to have elevated pop-up rates. Overall, there is a small but not super significant positive correlation between FB% and IFFB% (0.3 Pearsson), but at the extreme top end of launch angle, the pop-ups do get higher.

That means, obviously, a hitter who can get the ball off the ground while avoiding pop-ups (like Trout or Votto) is a big asset. Still, the overall correlation of wRC+ and effective off the ground percentage is not huge, although it is better than just FB% (0.23, vs 0.17 Pearsson).

The effect gets stronger at the extreme ends; for example, the top-20 in effective off the ground percentage is at a 117 wRC+ and the bottom 20 just at 99. However, of course power still plays a big role, as do strikeouts. Launch angle does help, but there are limits to that; it is not a magic pill. The most important things are still the big three — power, contact, and plate discipline. But a bad batted-ball profile can make the other peripherals play down. There is an effect of diminishing returns. Getting balls in the air is good, but it is mostly an issue when it gets extreme. If you have 6-degree LA/50% grounders, that is bad, but once you get past average (10 degrees, 45% grounders) there is not that much of a gain by further increasing LA.

I don’t believe in that “steeper swings lead to more Ks” thing, but higher LA can have a cost of BABIP and sometimes pop-ups. So I’m not sure a Hoskins / Jay Bruce / Cody Bellinger FB profile is that much better than a normal 40% FB profile. In the end, there is a threshold when LA can’t be further increased.

The FB revolution is mostly helping the guys who had extreme grounder profiles; in the end, it is probably best to have a slightly above-average LA of like 12 degrees, and have an off the ground percentage of 60+%, but extreme FB profiles probably only make sense for extreme power guys.

Carson’s article had Rhys Hoskins in it, but also Willians Astudillo, who probably won’t become a star. I think it is good to look for prospects who don’t hit on the ground too much, but I’m OK if my prospect hits like 45% grounders since many prospects tend to improve that a little in the majors, and I don’t think looking for extreme off the ground profiles brings that much of an extra advantage.

However, when a guy hits a ton of grounders, it is a red flag, especially if it comes with K issues. If you can’t make contact better, make your contact count with hard-hit fly balls. Moncada has that problem somewhat, and needs to improve that.

However, what is also bad is pop-ups with no power. J.P. Crawford, for example, has good off the ground rates (almost 60%) but also insane pop-up rates. He is starting to develop some pop, but unless it gets better, he probably might be a low-BABIP guy. He probably might be better off with a more conservative batted-ball profile of like 45% grounders and a little less pop-ups, so that his BABIP gets better. His off the ground rate is 60% but his effective off the ground rate is actually slightly under 50%, which means he is not getting the benefit of staying off the ground, but is paying the costs.

Of course, his plate discipline and contact profile would still work with average power, but the batted-ball profile definitely is not ideal.


Predicting the Playoffs

By Dr. Gregory Wood and David Marmor

Among the sabermetric community, the baseball postseason has the reputation of being random. In the past 20 years from 1996-2015, the predicted winner — i.e. the team with the best season record — won the World Series only four times. This raises the question as to what specific skills and performances of a team during a season have a meaningful, if any, correlation with postseason success. This study analyzed data from every playoff team from 1996-2015 to search for significant relationships that could be used to predict postseason wins.

The first method that I used was looking for linear correlations between regular-season statistics and various measures of postseason success. If some statistics were more correlated to playoff success, they could be used to predict a team’s playoff performance.

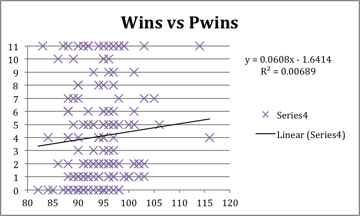
The most obvious place to start was regular-season wins. As I had expected, there was very little correlation between regular-season wins and postseason wins.

In the graph below, every playoff team’s regular-season wins has been plotted compared to their playoff wins. The data has an extremely low correlation coefficient and is not a good fit with the trend line. The correlation coefficient was 0.007, which is far below the usual significance level of 0.6 or higher. It appears that regular-season record is not a significant factor in post-season success. This explains why postseason success is considered random.

wins vs pwins.png

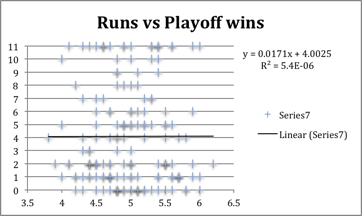
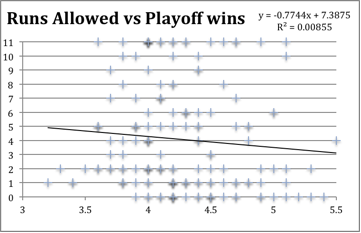
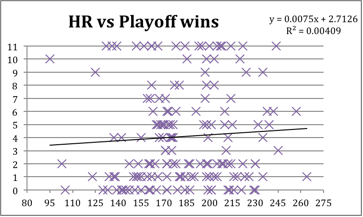
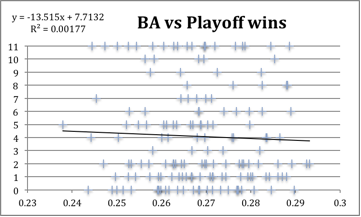
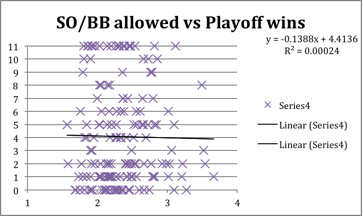
The goal was to find another statistic that had a significantly stronger correlation to playoff success. I studied many other statistics including runs, runs allowed, ERA, hits and hits allowed, home runs and home runs allowed, walks and walks allowed, strikeouts and strikeouts allowed, slugging percentage, and on-base percentage.

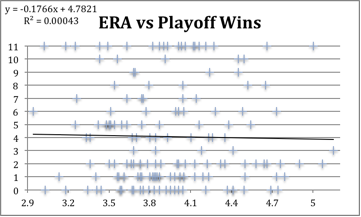
For each one I plotted the correlation chart and found the coefficient of correlation assuming a linear correlation. However the R-squared term was always very small no matter what I tried. This was true even with statistics that are vital to regular-season success, like ERA, OBP, runs and runs allowed.

Untitled1.png

I looked at both the actual totals as well as the totals adjusted for that year’s league average. That way I could account for the fact that the total runs scored has varied quite a bit over the 20 years.

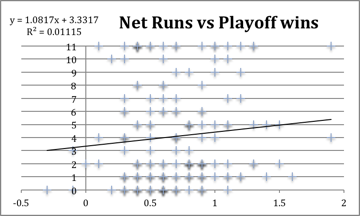
I also tried defining playoff success in three different ways: playoff wins, playoff series won, and playoff winning percentage. However, I got similar results no matter which method I used. None of them had correlations that were significant either way. The statistic that correlated best to playoff wins was run differential, but even it was too weak a correlation to be meaningful.

net runs vs playoff wins.png

The R-squared is still very small, so run differential is not a good predictor of post-season success. This method seems to suggest that the playoffs are in fact random. However, while each statistic individually was not strongly tied to playoff success, maybe combinations of them were.

To find combinations that might be meaningful, I tried using linear modeling. I used a computer program to find the best-fit line between playoff success and the regular-season statistics I was using. The model adjusted the weight given to the different factors to try and find results that were closest to what actually happened by minimizing its chi-squared term. The advantage of this method was that it could combine several factors at once. That way it could determine if there were certain factors that were important in playoff play.

The program was designed to run thousands of simulations at a time to try and improve on its previous best result by minimizing its error compared to the actual results. For each run I selected which statistics would be used. I could give the simulation different starting assumptions and set ranges for how much weight each category could be given. When the initial conditions were changed, the simulation would return different results. However, it was never able to find a result that was statistically significant. The best coefficient of correlation I found was 0.063, far below the level that implies correlation.

It seems that the sabermetric community is correct. Playoff performance is random and not predictable by regular-season performance. Therefore, teams should attempt to build the best regular-season team they can and hope to then get lucky in the playoffs, as opposed to trying to plan specifically for the playoffs.

Appendix

runs vs playoff wins.png

RA vs playoff wins.png

HR vs playoff wins.png

batting average .png

Untitled2.png


Guillermo Heredia, Starting Center Fielder

With Jarrod Dyson set to be a free agent, and Leonys Martin both ineffective and DFA’d twice, there has been some uncertainty among Seattle Mariners fans regarding who will patrol center field for the team in 2018. Luckily for Mariners fans, they have an internal option who is potentially an above-average player already playing for their favorite team: Guillermo Heredia.

At 26, Heredia is a bit old to just be emerging. Though unlike other players his age, his late arrival to the major leagues has nothing to do with his ability. Heredia defected from Cuba in January of 2015, just a few weeks before his 24th birthday. Before defecting, Baseball America ranked Heredia as the 11th best prospect in Cuba. He was signed by the Mariners in February 2016, after sitting out the entire 2015 season.

Heredia, considered by most to be a glove-first prospect, started the year hot with the bat in AA Jackson, hitting .293/.405/.376 in 260 plate appearances while living up to his defensive reputation. Heredia walked more times (36) than he struck out (32) and earned a promotion to AAA Tacoma after just 58 games. Heredia’s 35 AAA games—where he hit .312/.378/.414—were split by a cup of coffee when the major league club. In AAA, Heredia improved his strikeout rate to 9.6%, while his walk rate fell to 7.5%, but his combination of solid on-base skills and great defense earned him a call up to the majors for good on August 22nd.

Heredia made the most of his cup of coffee, hitting a solid .250/.349/.315, drawing 12 walks against just 15 strikeouts in a small sample of 107 plate appearances. Thanks to his strong on-base skills, and stellar defense, Heredia managed 0.4 WAR in just 45 games — with most of his playing time coming as a late-inning defensive replacement.

Despite his stellar defensive reputation, Heredia was relegated to corner outfield for all but one game of 2016 due to Leonys Martin’s stellar defense in center. Still, Heredia managed to make an impression. Heredia passed the eye test, and scored positively in both UZR/150 (+7.2) and DRS (+3). But what stood out most was his throwing arm. This throw made me a believer that among his many pretty good skills, he had at least one that was elite:

Petit out after challenge

He made an equally impressive throw this season to get George Springer trying to go from first to third, an out that proved pivotal in the Mariners securing a series win against the Astros:

Heredia nabs Springer at third

In just 705 innings in the outfield this season, Heredia has four outfield assists and +2.3 rating in the ARM component of UZR. His arm is an asset, and potentially one of the better throwing arms in the league.

Heredia’s scores in the range component of UZR were positive in 2016, and have been negative in 2017, for a total of -2.9 in 705 innings across three outfield positions. DRS is more favorable, giving him a +7 score across all three outfield positions, and exactly even at -1 in 251 innings in center. There’s no doubt he has the speed to play there, though his route efficiency is in question. Still, Heredia has nabbed 19 out-of-zone plays in center this season, and can outrun plenty of his poor jumps. Across all three outfield positions, he has scored +0.0 UZR, and +0.3 UZR/150. Even the most pessimistic evaluation of his defense would likely call him slightly below average in center.

If you’re someone that does hold the pessimistic outlook on his defense, then his bat would have to justify his playing time. The good news is Heredia now has a little more than two-thirds of a full season’s worth of plate appearances, and has steadily improved.

Heredia is hitting .271/.344/.368 (97 wRC+) in 450 career plate appearances, with a solid 14.5% strikeout rate, and decent 6.1% walk rate. He’s not riding an unsustainably high BABIP, either — his BABIP sits at .310, perfectly reasonable for someone with well above-average speed like Heredia.

In 34 games in the second half of 2017, Heredia has found a little more power: his first half ISO was just .091; it currently sits at .137 in the second half. Nine of his extra-base hits came in 208 plate appearances before the break, while 12 (11 doubles, 1 home run) have come after.

Even more encouraging is the fact that Heredia isn’t just a pull, or slap, hitter. Heredia’s career numbers split by where the ball is hit show that he can be effective hitting to any part of the field.

(Since walks aren’t put into play, this split is just AVG/SLG)

Pull: .333/.571
Center: .308/.342
Opposite: .323/.376

Essentially, Heredia only has power on his pull side, but can get on base hitting the ball in any direction.

There is one elephant in the room, though: despite his outstanding speed, Heredia just can’t steal bases. Perhaps he can learn how to get better jumps as he gains experience. It’s important to note that he missed his entire age-24 season trying to become eligible to sign with a team. But so far, Heredia has shown that he’s probably best utilizing his speed once the ball is put in play, rather than trying to advance via the steal. Between the minors and majors, Heredia has seven steals and has been caught 11 times.

Heredia can be an effective baserunner outside of when the ball is being pitched, though. He’s turned numerous singles into doubles by hustling out of the box, and shown that he can take two bases on a wild pitch If the catcher is lollygagging, as he did against Boston earlier this year:

Gamel scores on a wild pitch, ties the game

What the Mariners have in Heredia is a raw, speedy athlete with an absolute cannon for an arm, above-average on-base skills, and below-average, but developing, power. Heredia might never hit more than 10 home runs in a season. He might never steal more than 10 bases, either. But he’s amassed 1.2 WAR and posted a .344 OBP while playing at the very minimum passable defense in center field, with the upside for better.

He’s not Jarrod Dyson with the glove. He’s not Andrew McCutchen at the plate. What he is, though, is a competent offensive and defensive player with untapped potential. Even if he never improves, he looks capable of giving Seattle a 2-win center fielder going forward. Even a slight improvement could turn him into an above-average player, and one who is under team control for five more years.


dScore: End of August SP Evaluations

I went over the starters version of dScore here, so I’m not going to re-visit that here. I’ll just jump right in with the list!

Top Performing SP by Arsenal, 2017
Rank Name Team dScore +/-
1 Corey Kluber Indians 69.41 +2
2 Max Scherzer Nationals 62.97 -1
3 Chris Sale Red Sox 56.82 -1
4 Clayton Kershaw Dodgers 55.26 +1
5 Noah Syndergaard Mets 47.39 +2
6 Stephen Strasburg Nationals 47.24 +5
7 Danny Salazar Indians 43.46 +16
8 Randall Delgado Diamondbacks 42.00 +1
9 Luis Castillo Reds 37.99 +5
10 Alex Wood Dodgers 40.72 -8
11 Zack Godley Diamondbacks 39.55 -1
12 Luis Severino Yankees 39.24 +1
13 Jacob deGrom Mets 36.69 -1
14 Dallas Keuchel Astros 37.37 -8
15 James Paxton Mariners 35.81 +1
16 Carlos Carrasco Indians 34.23 +4
17 Sonny Gray Yankees 30.59 UR
18 Brad Peacock Astros 29.98 +6
19 Lance McCullers Astros 32.18 -11
20 Buck Farmer Tigers 31.31 UR
21 Nate Karns Royals 30.21 -2
22 Zack Greinke Diamondbacks 29.45 -4
23 Charlie Morton Astros 28.55 UR
24 Kenta Maeda Dodgers 27.40 -7
25 Masahiro Tanaka Yankees 26.83 -3


Risers/Fallers

Danny Salazar (+16) – dScore never gave up on him, despite him being absolute trash early on this year. He came back and dominated, launching him up the ranks even farther in the process. Current status: injured. Again.

Sonny Gray (newly ranked) – If there were any doubts about the Gray the Yankees dealt for, he’s actually surpassed his dScore from his fantastic 2015 season. He’s legit (again).

Alex Wood (-8) – Looks like the shoulder issues took a bit of a toll on his stuff, but dScore certainly isn’t out on him.

Dallas Keuchel (-8) – Keuchel’s stuff isn’t the issue. He’s still a buy for me.

Lance McCullers (-11) – Poor Astros. Maybe not too poor though; their aces have gotten hammered but haven’t fallen far at all. McCullers is going to bounce back.


The Studs

Some light flip-flopping at the top, with Kluber taking over at #1 from Scherzer. The Klubot’s been SO unconscious. Everyone else is pretty much the usual suspects.


The Young Breakouts (re-visited)

Zack Godley (11) – He’s keeping on keeping on. He barely moved since last month’s update, and I’m all-in on him being a stud going forward.

Luis Castillo (9) – He’s certainly done nothing to minimize the hype. In fact, he’s added a purely disgusting sinker to his arsenal and it’s raising the value of everything he throws. Also, from a quick glance at the Pitchf/x leaderboards, two things stand out to me. He seems to have two pitches that line up pretty closely to two top-end pitches: his four-seamer has a near clone in Luis Severino’s, and his changeup is incredibly similar to Danny Salazar’s. That’s a nasty combo.

James Paxton (15) 


The Test Case

Buck Farmer (20) – Okay, so to be honest when he showed up on this list, I absolutely thought it was a total whiff. By ERA he’s been a waste, but he’s really living on truly elite in-zone contact management, swinging strikes, K/BB, and hard-hit minimization. His pitch profile is middling (not bad, but not great either), so I really don’t think he’s going to stay this high much longer. He’s certainly doing enough to earn this spot right now, and I’d expect him to not run a 6+ ERA for much longer.


The Loaded Teams

Yankees – Luis Severino (12), Sonny Gray (17), Masahiro Tanaka (25) / Some teams have guys higher up, but the Yankees are loaded up and down.

Astros – Dallas Keuchel (14), Lance McCullers (19), Brad Peacock (18), Charlie Morton (23) / Similar to the Yankees. Morton and Peacock are having simply phenomenal years.


The Dropouts

Rich Hill (39)

Trevor Cahill (35)

Marcus Stroman (28)

Poor Rich Hill. Lost his perfect game, then lost the game, then lost his spot in the top 25. Cahill’s regressed to #DumpsterFireTrevor since his trade to the Royals. Stroman really didn’t fall that far…and his slider is still a work of art.


The Just Missed

Jordan Montgomery (26) – Too bad the Yankees couldn’t send down Sabathia instead. This kid is good.

Aaron Nola (27) – #Ace

Carlos Martinez (29) – Martinez simply teases ace upside, but frankly I think you can pretty much lump him and Chris Archer (30) in the same group — high strikeouts, too many baserunners and sub-ace starts to move into the top tier.

Dinelson Lamet (32) – He’s absolutely got the stuff. He could stand to work on his batted-ball control though.

Jimmy Nelson (34) – dScore buys his changes. He finished at #148 last year. I’ll call him a #2/3 going forward.


Notes from Farther Down

Jose Berrios is all the way down to 47. His last month cost him 19 spots, but frankly it could be much worse: Sean Manaea lost 39 spots, down to 87. Manaea really looks lost out there. I don’t want to point at the shoulder injury he had earlier this year since his performance really didn’t drop off after that…but I’m wondering if he’s suffering from some fatigue that’s not helped by that. He’s pretty much stopped throwing his toxic backfoot slider to righties, and that’s cost him his strikeouts. Michael Wacha is another Gray-like Phoenix: he’s up to 52 on the list, once again outperforming his 2015 year. I’m cautiously buying him as a #3 with upside. And finally, buzz round: Mike Clevinger (33)Alex Meyer (36)Robbie Ray (38)Rafael Montero (41), and Jacob Faria (43) are already ranked quite highly, and outside of Montero and maybe Meyer I could see all of them bumping up even higher. Clevinger’s really only consistency away from being a legitimate stud.


My next update will be the end-of-season update, so I think I’m going to do a larger ranking than just the top 25; maybe all the way down to 100. Enjoy the last month-plus!