HOW MUCH DOES APRIL MATTER ?
April is the first hard evidence of what may be in store for the new season. But like any single month, April usually has some extreme results. Typically 40% of all teams start conspicuously well (.600 +) or poorly (.400 minus) where by season’s end only 12% of all teams are at those outer edges of win percentage. With 85% of the season to go, plenty of time remains for fates to change. Or do they really alter that much post-April ? This study focuses on that question and is based on the April records of all teams from 2000-2017 compared to their post-April results and chances for making the playoffs. Two issues are addressed. First, how closely have teams’ remaining matched their Aprils and second, what effect April has had on teams’ playoff chances.
PREDICTICE VALUE OF APRIL FOR REMAINDER OF SEASON (ROS) RESULTS
April records of all teams from 2000-2017, were divided into six win % categories: Excellent (.650+ win % ), Good (.550 – .650), Slightly Positive (.500 – .549), Slightly Negative (.450-.499), Weak (.350 -.449) and Poor (below .350). Teams in each April win category were compared to their post-April and full season win/loss percentages. The percentage of teams in each April category who played at playoff level (.580), contention level (.540+) or near-contention (.500) after April were also measured as well as the percentage of teams in each April win category who made the playoffs. Following are the results:
| April W/L |
April Win % |
Last 5 month |
Full Yr |
.580+ last 5 |
.540+ Last 5 |
.500+ Last 5 |
Made Playoffs |
Pct of All |
Pct of Playoff |
| Category |
Teams |
Average |
Win % |
Win % |
Months |
Months |
Months |
|
Teams |
Teams |
| .650+ |
60 |
0.688 |
0.535 |
0.558 |
25% |
53% |
72% |
60% |
11% |
23% |
| .550-.649 |
119 |
0.595 |
0.519 |
0.530 |
18% |
44% |
65% |
43% |
22% |
33% |
| .500-.549 |
104 |
0.519 |
0.510 |
0.511 |
19% |
37% |
55% |
33% |
19% |
22% |
| .450-.499 |
75 |
0.472 |
0.495 |
0.491 |
11% |
29% |
48% |
20% |
14% |
10% |
| .350-.450 |
126 |
0.409 |
0.484 |
0.473 |
11% |
25% |
37% |
14% |
23% |
11% |
| under.350 |
56 |
0.305 |
0.445 |
0.424 |
4% |
7% |
23% |
4% |
10% |
1% |
Each level of April performance has had better remaining performance and playoff chances than the level immediately below it. Contrasts between the top 1/3 and bottom 1/3 April teams are stark. Two thirds of teams who’ve started well (.550 +) play .500 + ball afterward and roughly half make the playoffs. Only one third of teams who have been .449 or worse in April play .500+ ROS and just 9 % of these early strugglers have made the playoffs. Nearly 4 of every 5 of all playoff teams were .500+ or better in April and less than 1 in 10 playoff teams started .425 or worse. April has done a good job of quickly identifying contenders and non-contenders.
Much of that comes from April strongly relating to prior season results and current season records having solid resemblance to prior season records. So April simply confirms that many (if not most) teams are headed for the same general fate as last year. While these are generally reliable maxims, they’re hardly infallible. Many teams April wrongly suggest things will stay the same. Likewise April often may indicate a change is coming in the current season and it doesn’t materialize. That will be explored next – just how often does April “fool” ?
HOW MANY TEAMS ARE APRIL “FOOLERS” ?
Roughly 3 in 8 teams had more than .100 pt change in their April v. rest of season (ROS) win percentage. For some teams at the April extremes, even huge April v. ROS differentials don’t change their basic seasonal fate. The 2003 Yankees started the year at .769 win % but played “only” .596 ball the rest of the way and won over 100 games. Conversely a .260 point jump in win % for the 2000 Tigers over the last 5 months still didn’t push them over .500 on the season. Still for a great number of teams the last 5 months can wash out a great deal of the good or bad April does. Hot starters fall apart and teams buried in April can rise from the ashes.
To show both the amount and type of “foolery” April provides a logical starting point is prior year records. Fully 70 % of teams with 90+ wins the prior year have .500 + Aprils v. 37% for teams with 69 minus wins. Since many teams tend to have Aprils which are “characteristic” of their prior season , measuring the true amount of “April deception” can be done in two ways: 1 – How many Aprils “characteristic” of last year give true v. false signals of another similar season ? 2 – How often do “uncharacteristic” Aprils end up being true v. false signals of a better or worse year ?
1st – How reliable are “characteristic” Aprils. The following chart illustrates this
Prior Yr Wins April Win Category # Teams % win 90+ % win 81+ % Playoffs
90 + .520 + 83 64 % 84 % 62 % 80-89 .520 + 71 48 % 76 % 49 % 70- 79 .499 minus 73 5 % 22 7% Below 70 .499 minus 65 3 % 6 % 6 %
As can be seen, prior year good teams with good Aprils have had even better odds than their already favorable odds of making the playoffs. On the other side, prior year sub-.500 who have sub-.500 Aprils have seen their already thin odds get even slimmer. Only 9 of 138 such teams have overcome the odds of a bad start. The percentage of teams finishing above .500 is also remarkably different. 80 % of good teams with good Aprils end up plus .500 on the year, where a mere 14 % of bad teams with bad Aprils do. Conclusion: “characteristic” Aprils are highly reliable indicators of either continued contention or non-contention.
“Highly reliable” does not mean “perfect”. The 90+ game winner/good April formula didn’t work for defending world champions 2004 Marlins, 2013 Giants nor defending NL West champion 2008 D-Backs or 2005 Dodgers. Nor did bad team/bad April deter the 2015 Rangers, 2011 D-Backs, and two Rockies teams (2009, 2007) plus the 2007 Cubs from rising up and making the playoffs. But these are exceptions.
Applying these principles of “characteristic” Aprils to 2018 would bode well for the Red Sox, Yankees, Astros, Cubs and Diamondbacks. It would not for the Tigers, Rangers, Marlins, Padres, White Sox, Orioles, Royals and Reds. Only 1 in 15 sub-.500 prior year teams with sub-.500 Aprils have made the playoffs so such odds would indicate none of the above 8 will either. Of course none of these clubs were expected to contend but neither were the Braves, Phillies, Pirates, and Mets who’ve had good Aprils. Which brings up “uncharacteristic” Aprils.
2nd – How often are “uncharacteristic” Aprils false or true signals of a change in team fortunes ?
Logically when Aprils deceive, teams often return to their “true selves” (good or bad) in the last 5 months. The data largely supports that logic. But it also supports the notion that some uncharacteristic Aprils correctly signal changes in a team’s fortunes. This time the data is parsed more finely to show where the false and true indicators of change can appear.
Prior Yr
90 + wins + .401 – .499 April 26 % win 90+ – 77 % win 81+ 29% in playoffs
90 + wins .399 minus April 14 % win 90+ – 43 % win 81+ 21 % in playoffs
70-79 wins .600 plus April 39 % win 90 + – 72 % win 81 + 44 % in playoffs
70 -79 wins .500-.599 April 22 % win 90 + – 51 % win 81 + 25 % in playoffs
Below 70 win .600 + April 18 % win 90+ – 64 % win 81 + 18 % in playoffs
Below 70 win .500-.599 April 7 % win 90 + – 22 % win 81 + 14 % in playoffs
More extreme “uncharacteristic” Aprils have greater accuracy in signaling real change. Of the 90 + winners who started below .400 in April, less than half finished above .500 and only 22 % made the playoffs. By contrast, 90 + prior year winners who had .520+ Aprils made the playoffs 62 % of the time. So very bad Aprils from previously good teams are strong early warning signs of trouble ahead.
What about extremely strong Aprils from previously bad teams ? Of the 29 teams who had prior losing records but .600 + plus Aprils, 20 finished above .500 and 10 made the playoffs. This includes some notable turnarounds: 2000 Cardinals, 2000 White Sox, 2006 Tigers, 2012 Orioles, 2013 Red Sox, 2015 Astros, 2015 Cubs, 2017 Rockies, 2017 D-Backs. Of course, excitement over great Aprils by prior bad teams should be tempered by the fact that 65 % of such teams still have missed the playoffs. This may somewhat damp expectations raised by the start of the 2018 Mets. Although the 2015-2016 Mets were playoff teams so it’s quite possible their strong April 2018 could be a legitimate sign of revival. Teams who gained 15 or more wins over the prior year showed an average of 120 points jump in April v. prior year win %. The Mets have jumped 220 points.
Mildly uncharacteristic Aprils have a higher incidence of sending wrong signals. Only 22 % of the bad (“below 70”) teams with .500-.599 Aprils finished over .500. Only 23% of the 90+ winners who started .400-.499 became bad sub-.500 teams thereafter. Former 70-79 winners with good but not great Aprils (.500-.599) have boosted their playoff odds but at 20% those odds are still below average. Seven teams fit this description in 2018 – Mariners, Pirates, Phillies, A’s, Braves, Blue Jays, Giants. Historical odds are that 1 will make the playoffs, 2 would be very optimistic.
However, one type of mildly uncharacteristic April is very noteworthy. Previously good teams who show up with modestly bad Aprils (.400-.499) have seen a big drop in playoff odds (29% for bumpy .400-.499 starts v. 62% for “characteristic” good Aprils). That is not good news for 2018 Dodgers, Nationals or Twins who all were expected to be playoff teams again. Which brings up the next issue – how does April influence playoff chances ?
WHAT IMPACT DOES APRIL HAVE ON MAKING THE PLAYOFFS ?
As one old adage goes “you can’t win the pennant in April but you can lose it”. While there is a definite truth in this, April has the fewest games of any month, and still leaves ample time to recover. The 2001 Oakland A’s had a miserable 8 -17 April but went on to win 102 games. That said, they were the only sub-.400 April team to win 100 + games and only one of 8 teams who started that poorly and still made the playoffs. Another 10 such bad start teams played the rest of the season at contender levels (.540+ ) yet failed to make the playoffs and their poor Aprils were instrumental in that.
While it is clearly possible to recover from a bad start, bad Aprils leave a diminished margin of error. Two-thirds of all playoff teams start the year solidly (.530+ ), the vast majority (78%) are at least .500 + and fully 95 % of all playoff teams have avoided disastrous (sub. 400) Aprils. Teams who’ve started miserably haven’t been able to count on fellow playoff contenders being in the same underwater boats. They have to play serious catch-up with rivals whose yachts have begun to float away. An “average” playoff team has a .564 April win percentage. So a club with a 9 -15 April usually has to catch teams who’ve gone 14-10 or better. If the 15-9 April teams plays at “only” .537 ROS and gets 88 wins, it takes a .580 ROS from the poor April starter to overcome that. Playing at .580 + level ROS has been done by only 15% of all teams, which equates to being one of the top three teams in one’s league after May 1st.
Those 8 playoff teams who started sub-.400 averaged a .604 ROS win percentage. Five of the eight were .580 + ROS and the lowest ROS win percentage was .572 which translates to 93 wins over a full season. In addition, there were four teams with a .580+ ROS that missed the playoffs since their average Aprils were 9 – 14. Despite Herculean May 1st-on efforts and being better ROS than their key divisional or wild card rivals those four teams (2004 Giants, 2005 Indians, 2011 Red Sox, 2012 Angels) lost out on the playoffs because of their inferior April records to rivals who had solid or even stellar starts.
Losing ground to playoff competitors due to a bad April and rivals’ typically good starts makes the task tougher. Even slightly below .500 starts mean a club usually needs to play at .560+ ROS to catch up as most playoff bound teams are already above .550 + in April. The other side is that very strong Aprils can provide a cushion to play at less than .550 ROS (the average playoff team is .581 ROS). There are even occasions where teams with less than a .520 ROS have made it in due to strong Aprils: 2016 Mets, 2015 Astros, 2014 A’s, 2006 Cardinals, and 2000 Yankees. Ironically there are two World Series winners in that group (Cardinals and Yankees). The Cardinals were particularly unusual as they were the only team to make the playoffs with a sub-.500 ROS record.
The lone .600 + ROS who missed the playoffs (2005 Indians) provide a classic example. They were the second best team in the AL after April, outplaying their division rival and subsequent World Series winner White Sox 84-55 to 82-56 ROS. However, with the 17-7 April of the Sox, and Indians’ poor 9 -14 start, Sox gained a 7.5 game cushion. The double whammy was that the Tribe’s poor April also cost them the wild card to Boston. Had the Indians played even 12-13 instead of 9-14 they’d have ousted Boston. Of course Cleveland’s 13-16 July didn’t help either, nor did going 1 -5 the last week of the season (including a 3 game sweep by the Sox) after the Indians had whittled the lead down to 1.5 games on Sept. 24. But the April cushion built by the Sox allowed them to withstand an incredible Aug/Sept run by Cleveland and the Tribe was forced to play unbelievably well to stay in the hunt. This all happened before the second wild card was introduced in 2012, and if it had applied back then Cleveland would have made it as that second wild card. So has this second wild card now made it easier for April stumblers to recoup ?
HOW THE SECOND WILD CARD HAS CHANGED PLAYOFF ODDS
Adding a second wild card team has changed the odds in some meaningful ways as follows: Prior to 2012, teams had a 94 % chance of making it with 92+ wins , but only 43% with 87-91 wins did. After 2012, teams had a 100 % chance of making it with 92+ wins, and an 83 % chance with 87 -91 wins.
Clearly 87 – 91 wins stands nearly twice the chances of making the playoffs than before when 92 wins was the benchmark to lock in a spot. Prior to 2012 good Aprils helped but a team needed to be stoking the engine every month to reach that 92 plateau. Only when teams hit the magic 580 ROS (94 win pace full season) did they have a near lock (96%) getting in. Now that lock is at 560 ROS. This is a critical difference. That can make it easier for a strong April team to ease into the playoffs with a lower ROS or it can make it easier for a team that stumbles in April to recoup. In fact for those teams who started less than .450 and then made the playoffs prior to 2012, the average ROS was .604. For the three teams that have done that since 2012, the average ROS is .574. But that only 3 teams have made it with subpar Aprils says the new wild card system has not been a boon to bad April starters.
It’s a lot easier to have a .600+ April than a .600 + ROS. 111 teams have had such Aprils, but only 42 have done so ROS. The new wild cards have actually made it easier for the good April teams to coast in with lower ROS records and there is no shortage of good April teams. Since 2012, each year an average of 15 teams start the year with .520 + Aprils to compete for 10 playoff spots. Of those teams, 56% (or 8 per year) make it in. That leaves only 2 spots on average per year for sub-.500 April teams to compete for.
Following is a breakdown of the number of playoff teams after 2012 who’ve played at given ROS levels categorized by their April win levels
| APRIL WIN LEVEL |
600+ROS |
580-599 ROS |
560 -579 ROS |
540-559 ROS |
520-539 ROS |
500 -519 ROS |
# teams |
| 600 Apri |
4 |
4 |
6 |
4 |
2 |
3 |
23 |
| 550-599 |
3 |
4 |
2 |
2 |
2 |
0 |
13 |
| 500-549 |
4 |
3 |
4 |
1 |
1 |
0 |
13 |
| 450-499 |
3 |
3 |
1 |
1 |
0 |
0 |
8 |
| 400-449 |
0 |
0 |
1 |
0 |
0 |
0 |
1 |
| below 400 |
0 |
0 |
2 |
0 |
0 |
0 |
2 |
As can be seen, 49 of the 60 playoff teams were .500 + in April. However, 91 % of the under .500 April teams who made the playoffs were forced to play .560 + ROS to get in. Whereas only 64% of teams who started .550 or better were able to play under .560 ROS and still make it. So the second wild has so far given the fast start April teams a better chance to ease coast into playoffs at a lesser ROS pace rather than make it easier for the slow starters catch up. But the same math could be applied to any month, good or bad, so to paraphrase the classic Passover question: why is April so different from all other months ?
PSYCHOLOGICAL EFFECTS OF GOOD OR BAD APRILS
Despite the fact that April is only 15% of the overall season, when early-mid season personnel decisions are being made, April results can still have considerable impact. April’s record can influence decisions such as: the patience a team has for a younger player with early season struggles or whether the team tries for a mid- May trade to replace an injured starter and/or considers promoting a top notch AAA player despite his arb clock issues. When trading season starts in June, 35% – 40% of the team’s record at that point has been baked in by April’s wins and losses. Even by the late July deadline, April still comprises 25% of the season. If early results have affected fan attitudes and attendance, ownership may be either more or less willing to commit dollars to bigger name players at the deadline.
These factors may give April importance beyond its mathematical impact on the standings. That teams tend to mirror their April win-loss %’s as the season progresses may be in part that April can create a sort of self-fulfilling prophesy. The 2014 Cleveland Indians were 75-60 after April 30th, the Oakland A’s were 70-63 over the same time. Yet Oakland got the wild card by 3 games over Cleveland due to a 18-9 April v. the Indians 10-17. Early season results were still impacting July decisions as the A’s were buyers and the Indians sellers. To be sure, the A’s record worsened post-July and the Indians got better. But without Jon Lester (2.35 ERA with A’s) and Jeff Samardzija (3.14) who knows how much worse it might have been for the A’s . While ridding themselves of Justin Masterson may have helped the Indians and trading Cabrera didn’t hurt, how much better would they have been had they gotten an OFer and starting pitcher in July instead of being sellers ?
Conversely, the 2016 White Sox benefited from a 17 -8 April despite a May tailspin which left them with a 29 -27 record on June 4th and only 2 games behind in the AL Central. They then traded a very talented younger prospect named Fernando Tatis Jr. for James Shields. Needless to say this is a trade that has not worked well short or long term. Despite the fact that the Sox had 3 straight losing seasons prior to 2016, management seemed to believe that April/early May represented the success they felt the team was capable of as opposed to the more recent reality of losing. Successful Aprils can sometimes keep wishful thinking alive for too long.
CONCLUSIONS
Clearly April has proven to be a good proxy for the team’s chances going forward that season. But April records have to be viewed in context of all evidence. How much of a factor were injuries, over or under performances, or new offseason acquisitions? Thoughts of dumping contracts and rebuilding, while too premature for May 1st, are still logical for poorer prior year clubs who are off to bad starts.
For clubs in the playoff hunt, April can have real impact since 3-5 more or fewer wins can make/break. Since 2013 teams with 87-88 wins have made the playoffs in 10 of 11 cases where only 2 of 14 teams with 85-86 wins have. Clearly these margins apply to other months’ results too, but as noted before, a very good or bad April can affect team decisions in June and July. Having some breathing room afforded by a 16-10 April instead of the catch-up pressure of a 10-16 start can play into the psychology as well.
Winning the division winner is far preferable to having to win a one-game playoff as a wild card and April provides a good checkup on division rivals. Both Boston and NY look like they will fight it out all year although Toronto can’t be ignored. In the Central, the Indians’ are in a strong position with their chief rival, the Twins, are 4.5 games back already and the rest of the Central bad teams who’ve started with bad Aprils. Houston’s good start helps especially since all of their closest chasers (Mariners, Angels, A’s) were sub-.500 teams last year, but the Angels improved through offseason acquisitions. In the NL East, even though the Nationals are 5 games back they’re chasing teams who were all sub-.500 last year (Mets, Braves, Phillies). Where the Dodgers, who are 8 games back, are pursuing a D-Back team that won 93 last year. Turner’s absence hurt in April but so did the lack of offense from the rest of the team which may continue particularly since Seager is lost for the year. Plus the bullpen woes cannot be overlooked. So April’s 12-16 record cannot be easily dismissed as an aberration. Nor can the historical evidence of diminished playoff odds (20-25% range) of good teams who’ve had the Dodgers’ kind of April. We shall all see soon enough.
 ,
, ,
,


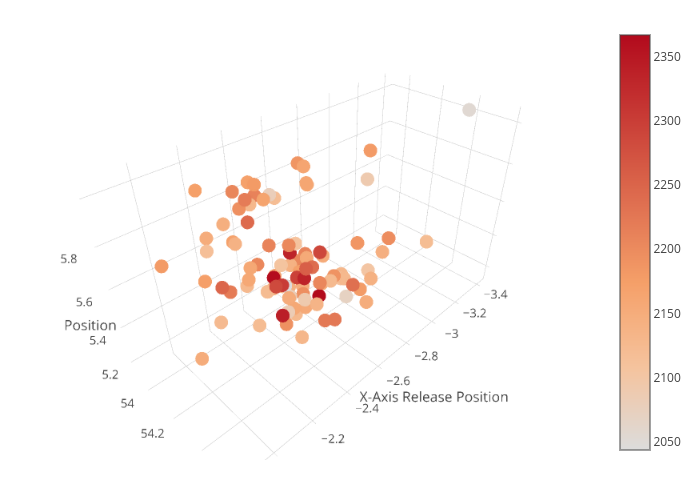
 First thing first, Hinch is right about pitch usage. Sinker rate is way, way down. But, as you can see below, it cannot account for within-pitch spin variation, as his individual sinker and 4-seam spin are both spiking this year.