The Latest and the Greatest
Note: I have no idea if I’m the first to do this, but quite frankly I don’t care.
Long before I was a fan of baseball (much less a fan cognizant of sabermetrics), I was a fan of the NFL, and more specifically, of people writing their opinions of the day-to-day happenings of the NFL. One of my favorite opinion-writers (or “columnists”, if you prefer) was, and is, a Mr. Gregg Easterbrook, who wrote, and still writes, a weekly column for ESPN during the NFL season, entitled Tuesday Morning Quarterback. One of the article’s more enjoyable endeavors–for me, at least–was tracking the best of the “unwanted players”, the criteria for which Mr. Easterbrook defined as follows: “A player must have been undrafted, or been waived, or been let go in free agency when his original club made no bona-fide attempt to retain him.”
In baseball, more so than most other sports (or so it seems), the majority of successful players are high-round draft picks (i.e. first 3 rounds). So recently, I began wondering: which active players have been good, over the course of their careers, after being “unwanted”?
For the purpose of this exercise, I defined “unwanted” as simply late-round draft picks, as there doesn’t appear to be too many examples of undrafted* U.S. players having done well (the only active ones I could find were Greg Dobbs and a bunch of relief pitchers, and Greg Dobbs is fucking Greg Dobbs). As a cutoff (to ensure only true “unwanted” players were included), I excluded everyone drafted within the first 200 picks–sorry, Shane Victorino and Aaron Harang–and everyone with less than 20 career WAR–so long, Marlon Byrd and Josh Willingham. Also, draft spots were determined via ESPN (at the bottom right of each player’s page is their draft year and position, among other information); there may be some discrepancies between those and, say, Baseball-Reference’s. Oh, and WAR values are as of Tuesday, August 6th.
These criteria yielded 24 results; they are listed below in order of lowest to highest draft pick.
Matt Holliday–210th overall (7th round) in 1998; 43.8 WAR**
Prior to this post, I Googled “mlb late round draft picks“, and looked at a few of the top results, on Comcast, Yahoo, and ESPN. Many of the players listed appear later on this list, but Holliday was conspicuously missing. I can’t decide which is odder–that a player that had 4 consecutive 5-WAR seasons went in the 7th round, or that no one seems to realize this. Regardless, the Rockies ended up picking Holliday out of Stillwater HS (OK), after drafting such quality players as Matt Roney, Choo Freeman, and Jeff Winchester, and it worked out pretty well for them.
Most teams were apparently scared off because they thought he might pursue football instead, after being one of the top quarterbacks in the state; he was recruited by Oklahoma State, but instead chose to go to MLB. Based on his -24.8 career Outfield Arm runs above average, I can’t be too certain he’d have made it as a passer. (As an aside, one of the Rockies’ other picks in that draft is later on this list.)
Allan James Burnett–217th overall (8th round) in 1995; 35.9 WAR
Contrary to popular belief (or at least my belief, before I looked this up; not a whole lot of people care about Burnett, from what I understand), Burnett was not drafted by the Marlins, with whom he spent his first 6 major-league seasons; the Mets selected him out of Central Arkansas Christian HS, seeing him as everyone else saw him–a raw prospect with potential, but someone who needed a lot of work.
Just how much work was needed became apparent pretty quickly, when Burnett walked 7.35 (!) batters per nine innings in his Mets career. In no small part because of these control issues, in 1998 the Mets traded him to the Marlins in one of their (i.e. the Marlins’) many infamous fire sale deals. Along with Burnett, the fire sales brought the Marlins Derrek Lee and…well, that’s pretty much it. Burnett, however, couldn’t have been happier with the trade, later saying “if [he] hadn’t gotten traded, [he] probably would’ve retired.”
So, a major league player, that is to say, an ACTUAL HUMAN BEING, at one point desired a trade to Baseball Hell? Hold on, I need a sec…Okay, I’m good. Who’s next?
Coco Crisp–222nd overall (7th round) in 1999; 27.2 WAR
I’m with DJ Gallo on this one–it’s simply criminal that it’s taken TWELVE YEARS to have a Crisp-cereal tie-in. And, of course, Billy Beane is the one to make it happen. That son-of-a-bitch, thinks he’s so damn smart…But I digress. After being a graduate of baseball’s RBI program, Crisp was selected by the Cardinals, in the same year they selected one of the BOAT (Best Of All Time, for those who are unedumacated), who will also appear further down on this list. I think it’s a sign of the insanity of baseball that the Cardinals–widely known to be one of MLB’s most well-run organizations–could get three (count ’em, three) first rounders in one draft, and completely whiff on all of them (not to mention whiffing on their next six picks). But, of course, being the Cardinals, they still ended up drafting two quality major leaguers.
Moving on…Crisp had shown impressive plate discipline, but little power, and academic issues hindered him along the way. (In that article, he brags about getting a 1070 on his SAT; am I missing something here?) Because he frequently transferred from high school to high school, he actually only ended up playing one season of high school ball, then went to Southern University in Louisiana. They wouldn’t let him play, however, as they couldn’t sort through all his high school transcripts (what are they, the VA?); since he had only gone there to play baseball, he sat out of classes, and was nearly expelled.
That summer, he was signed by the Angels; as a freshman at a four-year college, the Angels were forbidden from signing him–apparently they didn’t know he was in college–and the deal was voided by MLB. Crisp, however, was thankful for the error, saying it “put [him] back on the radar.” The next year, he went to Pierce Junior College in California, and was good enough academically that he was able to be drafted, albeit as a second baseman. The Cards moved him to the outfield, traded him to the Indians for Chuck Finley, and Cereal Man’s career was off.
Kevin Youkilis–243rd overall (8th round) in 2001; 28.4 WAR
The man with the most annoying batting stance in the majors (not to mention the most ironic nickname) was not, unlike many of the Red Sox’ other recent great players, a high round draft pick. Rather, he slid to the 8th round, where the Sox picked him out of Cincinnati; this was due to concerns about his, uh, voluptuous physique, along with–get this!–concerns about his defense. As an Orioles fan who has seen more than his (or the Orioles’, I guess) fair share of base hits robbed by Youk, this was news to me. Apparently, with a career 27.2 Fielding Runs Above Average, this is news to everyone else, too.
As an added irony, the Red Sox’ top pick in that draft was Kelly Shoppach–basically the polar opposite of Youk. And of course, as another irony, the player the Red Sox traded him to get more playing time for–Will Middlebrooks–is also basically his polar opposite.
Mark Ellis–271st overall (9th round) in 1999; 26.1 WAR
I’m going to be honest here for a second: Before I embarked on this endeavor, I had no idea who the hell Mark Ellis was. I vaguely remembered him from a series the Dodgers played against the O’s back in April, but other than that? Nada. But, for the purpose of this list, I needed to find out more about him, so I’d be able to fill this space. So I searched. And I searched. And I searched some more, ’till my searcher was sore. And you know what conclusion I came to? Mark Ellis is completely insignificant. He’s average. He’s every kid on the playground that didn’t get picked on. He’s a business casual potted plant, a human white sale. He’s VH1, RoboCop 2 and Back to the Future 3. He’s the center slice of a square cheese pizza–actually, that sounds delicious. I’m the center slice of a square cheese pizza. He’s Jim Belushi.
Sorry, had to get that out of my system. But seriously, though Ellis has had a pretty nice career, he’s just flown pretty much under the radar for most of it. He was drafted by the Royals out of Florida, and went to Oakland (where he spent most of his career) in the three-team Johnny Damon trade. As a prospect, he had excellent plate discipline, but little power, and was probably severely undervalued. This was probably just a problem with being drafted in the pre-Moneyball era; had he been 10 years younger, he probably would’ve been drafted much higher. Of course, once he came up, his numbers spoke for themselves.
Howie Kendrick–294th overall (10th round) in 2002; 20.0 WAR
Funny story with Kendrick: I actually started writing this piece on Saturday the 3rd, with only 23 players meeting the criteria. Then I saw Kendrick, who at the time had 19.8 career WAR. I knew by the time this piece was finished, he’d probably have 20, meeting the criteria and making me look like a dumbass for excluding him. So, even though this piece was finished by early Saturday, I had to wait until Tuesday to publish it.
Anyways…Kendrick was taken by the Angels out of St. John’s River State Community College in 2002; yeah, I’m confused too. I mean, really, what kind of self-respecting baseball player goes to a goddamn community college? It’s not like any historically great hitters–hitters that may or may not appear later on this list, and that may or may not have already been referenced as appearing later on this list–went to a community college.
Annnnnnyways…Angels guru Tom Kotchman found Kendrick’s talents wasting away at SJRSCC (damn, long anagram), and was thunderstruck that “there weren’t other scouts there…” and that “…other JC’s [had] cut this guy…” He alerted the Angels immediately, who drafted him later that year. Oddly enough, like Youkilis, concerns about Kendrick’s defense were apparently what scared other teams off. 8 years and 30.3 fRAA later, it’s safe to say those concerns were unfounded.
Dan “Yo Mama So” Uggla***–338th overall (11th round) in 2001; 24.5 WAR
Long before he was subjected to the unbridled fury of any and every Braves fan (seriously, when you type “Dan Uggla is” into Google, results 2-4 are “terrible”, “a jerk”, and “a douche”; also, people apparently care about his marital status), Uggla was actually drafted, not by the Marlins, but by the Diamondbacks, out of Memphis. The Marlins swiped him in the Rule 5 draft, just one of many shrewd management moves by the genius owner Jeffrey Loria.
Many teams were scared off because of Uggla’s vertically-challenged nature–less than 6 feet tall? The horror!–and tendency for whiffing; this problem has manifested itself in the major leagues as well. As with Youkilis and Kendrick, he was also viewed as a defensive liability. “Well, Youkilis and Kendrick sure proved their doubters wrong!” you, the naively optimistic reader, say. “Golly gee whiz, I’ll bet Uggla did the same thing!” Yeah, about that…
Juan Pierre–390th overall (13th round) in 1998; 23.4 WAR
Couple things on Pierre:
1. The fact that he exists on this list shows the inherent flaw with it–I’m taking career aggregate WAR values, as opposed to averages per, say, 600 plate appearances. Oh, well. Maybe next time.
2. I’m racist, I guess. Before this, I had always thought Pierre was Hispanic, and was signed as an IFA out of some Central-American country. Now, in my defense, how many people who aren’t Hispanic are named “Juan”? I mean, really? Well, as it turns out, I’m not the only one confused about this; also, he was apparently named after Juan Marichal.
3. When the Rockies picked Pierre out of South Alabama (in the same draft they picked Holliday), the scouts liked his speed, but were unsure how he’d fare with wooden bats, fearing it might sap what little power he already had. Huh. Maybe those people who are payed to evaluate talent for a living are actually good at their jobs! I mean, now that I write that, I realize that I should have seen this all along. I mean, it’s not like scouts have ever completely missed on a guy who turned out to be…
Albert Pujols–402nd overall (13th round) in 1999; 87.4 WAR
…One of the best hitters ever. *Sigh* Well, anyways…
Pujols had to fight adversity long before his major league career even began; after immigrating to America from the DR, he had to deal with an alcoholic father and no mother. Despite this, he still managed to excel at high school baseball–when he wasn’t being IBB’d, he hit 8 home runs in 33 plate appearances–but received little attention from big name colleges and was forced to go to Maple Woods Community College in Missourah. (Fun fact: Logan Morrison, the Marlin first baseman, also attended MWCC. That is the only time Logan Morrison will be mentioned in the vicinity of Albert Pujols in his life.)
Pujols (predictably) raked at MWCC, hitting .461 with 22 homers; he was (predictably) ignored by everyone, mainly because they were unsure where he’d play, and were doubtful about his age. And, like so many of the players on this list, teams were concerned over his build. The Cardinals, apparently the only sane team in the majors, were happy to swoop in and pick him with the 401st pick, and the rest is history.
While on the subject of Pujols: it seems that one of the best players of the generation should have some good nicknames assigned to him. When I Googled “Albert Pujols Nickname“, it gave me a lot of results, but none that I’d heard used before. Does he have any nicknames that are actually popular?
James Shields–466th overall (16th round) in 2000; 26.1 WAR
Before I start, I’d like to make a suggestion to Cameron, Sullivan, or whoever else, for a future article: Players (maybe just active players) with the highest career gap between fWAR and rWAR. Shields’ differential is pretty high, as his rWAR is only 19.5. Most of the players, I’m sure, would be pitchers, but it might also be interesting to see for position players as well. Food for thought.
Anyways, Big Game James was drafted by the Rays out of William S. Hart HS (CA); he had been good his junior year there, but a shoulder injury (i.e. pitcher Kryptonite) he suffered his senior year scared many teams off; fear that he may forgo the draft and go to LSU didn’t help either. The shoulder injury worry wasn’t an illusion–he missed the entire 2002 season after undergoing surgery on it–but it sure as hell hasn’t resurfaced since, as he’s pitched (or is on pace to pitch) 200 innings in every year since his rookie year. In a draft where Rocco Baldelli was the top pick, this was probably the best possible outcome for the Rays.
Jake “Michelle Bachmann Hates Vaccinations for H” Peavy****–472nd overall (15th round) in 1999; 35.8 WAR
The curious case of Jake Peavy is one of hypocrisy. In his senior year at St. Paul’s Episcopal School (AL), Peavy dominated the competition, leading to many scholarship offers. Peavy was especially interested in Auburn, which was offering a full ride; apparently, Peavy committed to Auburn, but then said he would go pro if taken in the first 4 rounds. When Peavy was drafted by the Padres in the 15th round, he eventually did sign with them–but for the price of a fourth-rounder. So, just to recap, he lied to Auburn, saying he’d play for them; then he lied to MLB, saying he’d only play for them if drafted in the first 4 rounds; then swindled them out of 4th-rounder money(yeah, it probably wasn’t that much more money, whatever).
Concerns about college weren’t the only problem with Peavy. In the words of former Padres scout Mark Wasinger, who discovered him prior to the draft in 1999, “At 6-foot-1, he wasn’t the 6-foot-5, Brandon Workman physical type that is the prototype. A lot of people thought that for Peavy, maybe that wear and tear might not suit him for the long term.” Sure enough, injuries have plagued Peavy (at least to some degree) for his career–he’s been on the DL in 5 of the past 6 seasons. Still, for a player who averaged 4.3 WAR between 2004 and 2008, this was one helluva bargain.
Ian Kinsler–496th overall (17th round) in 2003; 28.0 WAR
Kinsler was drafted not once, but twice, by the Diamondbacks, in the 29th round in 2000 and the 26th round in 2001, deciding to forgo them for Central Arizona College and ASU, respectively. By the time the Rangers took Kinsler out of Missourah in 2003, he had moved all the way up to the 17th round! So that just goes to show, kids–if you keep working hard, you can improve from completely irrelevant to slightly less completely irrelevant! Oh, and be a three-time All-Star, 2-time member of the 30-30 club, and one of the best second baseman, if not all-around players, in the game of baseball.
Kinsler himself has said that he didn’t worry about his major-league future while in college, saying he “…always knew [he]’d get a chance and get drafted, but [he] basically had to prove [him]self to put [him]self on the map.” When he was drafted, he weighed 170 pounds–pretty light for a six-footer. He made a commitment to himself after that to pack on some muscle mass, and given that he’s now listed at 200 pounds, I’d say he achieved that goal.
Mike “The Foulin’ Italian” Napoli*****–500th overall (17th round) in 2000; 21.3 WAR
Before he was providing a soothing breeze to everyone in the first few rows, Napoli was drafted by the Angels out of Charles W. Flanagan HS (FL). Apparently, he didn’t “fit the prospect prototype“, or as former Angels scout Todd Claus put it, “lots of people…couldn’t get past his body.” Concerns about that body, along with the usual worrying over defense, led to him skidding in the draft, until the Angels picked him up. Oddly enough, though, one caveat not mentioned about the pre-draft Napoli was fear of injury–odd, considering he’s qualified for the batting title exactly once in his eight-year career.
Interesting side note (which the article points out): the 17th round of the 2000 draft also featured future quality major-leaguers Josh Willingham, Rich Harden, and (although he didn’t sign) Paul Maholm. The best pick of that round, however, was Napoli, an catcher who was much better at the plate than behind it–the antithesis to which would be…
Russell Martin–511th overall (17th round) in 2002; 25.0 WAR
Even before his incredible year this year, Martin had 21.2 career WAR, making him the 4th-best catcher in baseball over that time (Napoli was 5th). So why was he still around in the 17th round, when the Dodgers selected him out of Chipola Junior College (which another player on this list also attended)? Well, he didn’t really have a position–the Dodgers picked him as a third baseman, but thought he might play shortstop or even a corner outfield spot. In spring training 2003, however, the Dodgers experimented by having him attempt to catch flamethrowing, wild righty Jose Diaz, with good results. From there on out, he was a catcher.
Also a cause for his low draft position: the Dodgers feared he didn’t have enough power to be an everyday third baseman. At the major league level, however, he has a respectable .141 ISO, and as as everyone knows (or should know) offensive standards for catchers are much lower than for third baseman. That’s why this guy somehow continues to exist. In a draft where the Dodgers would pick James Loney, Jonathan Broxton, Eric Stults, and Martin’s current teammate James McDonald, he (i.e. Martin) was clearly the best pick.
Placido Polanco–530th overall (19th round) in 1994; 38.5 WAR
Earlier this year, Matt Klaassen wrote a swan song for Carlos Lee; soon, I fear, the same shall have to be done for Placy. However, the purpose of this is not to examine the career of one of the best defenders of this millenium, but to look back at how that career came to be. And for Polanco, that proved to much easier said than done. Seriously, there’s almost nothing on the guy! But I persevered, and this is what I discovered:
Polanco was born in the DR, leaning baseball in Manny Mota’s Little League program. After excelling at this level, he won a scholarship with Miami-Dade Community College, and immigrated to the U.S. (though he did not become a citizen until 2008). Because he went to a junior college, he was not as publicized–remember, they didn’t got no internet–and as a result, he went undrafted until the 19th round, when the Cardinals took him.
At first, he struggled a bit in the minor leagues, especially–believe it or not–with the glove, committing 10 errors in his first 32 games (yeah, errors are a terrible statistic for measuring defensive contributions, I know; that’s still really bad, though). He later said he “…made a lot of throwing errors, from not really knowing the game, not knowing when to hold on to the ball and when to throw it.” Suffice to say, he now knows when to hold and when to throw.
Andy Pettitte–594th overall (22nd round) in 1990; 66.9 WAR
How’s this for surprising? Pettitte–the only one of the US-born Yankees who wasn’t a high-round draft pick–said in 2008 that signing with the Yankees “was the dumbest thing [he’s] ever done.******” How’s this for more surprising? Pettitte was apparently hefty enough to be the starting center and nose tackle on his Texas high school football team, as well as a pitcher who threw in the mid-80’s. Because of this combination of (relatively) low velocity and a burly figure, he was picked late in the draft by the Yankees, but went to San Jacinto Junior College.
Now, this is where it gets tricky. Pettitte was picked in 1990, but went to college instead. So why does his profile page on ESPN list him as not having attended college? Well, because of the “draft-and-follow” rule–which states, in a nutshell, that a pick who attends a junior college may be signed at any point 51 weeks after the draft–the Yankees were able to sign him on May 25th, 1991, almost pushing the DAF rule to its limit. But why would they devote this much time to a mere 22nd-round pick? Were they able to see into the future with the crystal ball Rex Ryan used to predict the Jets’ Super Bowl victory?
Perhaps…or perhaps, during the DAF year, Pettitte was coached by the now-legendary Wayne Graham, who shaped him from an offensive lineman physique into…well, Andy Pettitte. As is detailed in the first article, when Pettitte got fitter, his fastball got faster, up to the low- to mid-90’s it occupied during his dominant stretch in the 1990’s and early 2000’s. So to summarize, the Yankees got one of the best pitchers in their history through a rule quirk that almost no one knows about. I think I speak for all of us when I say…goddamn Yankees.
Jose Bautista–599th overall (20th round) in 2000; 21.8 WAR
As you’ve probably forgotten by now, this whole brouhaha was based on the concept of “unwanted” players as told by Gregg Easterbrook. His definition involves not only players who were undrafted (which, I’ve discussed, are scarce in MLB) but also those who had been repeatedly released by their teams, and had bounced around for a few years before finding a true home. By this definition, Joey Bats is the best unwanted player on this list. Just in case you didn’t know, here’s the story of his major-league career:
1. Goes to Chipola Junior College in Florida (the college of Russell Martin) after immigrating from the DR.
2. Is drafted by the Pirates. (To all the Bucs fans, pining for their team to plunder the farm system for Giancarlo Stanton, just know that your team could’ve had one of the best right fielders in baseball. Just remember that, along with every other misery Pirates fans must always carry with them.)
3. Is selected in the 2003 Rule 5 Draft by the Orioles, and is on the Opening Day roster. Go O’s!
4. Is claimed off waivers on June 3rd by the Rays. Stupid O’s!
5. Is purchased on June 28th by the Royals. Stupid Rays!
6. Is traded on July 30th to the New York Mets in exchange for Justin Huber. Stupid Royals!
7. Without playing a game for the Mets, is traded back to his original team (i.e. the Pirates) along with Ty Wigginton and Matt Peterson, in exchange for Jeff Keppinger and Kris Benson. Stupid Mets! Also, Jeff Keppinger? Ha!
8. Just to recap, Bautista was on 5 teams in the same season. Know how many other players have done that? NONE!
9. Plays in only 11 games for the Pirates in 2005.
10. Is a Pirates regular for 2006 and 2007; posts wRC+’s of 96 and 97, respectively.
11. Struggles through 2008, and is traded midseason to the Blue Jays for a PTBNL (Robinzon Diaz). Stupid Pirates!
12. Is mediocre in 2009, posting a 102 wRC+.
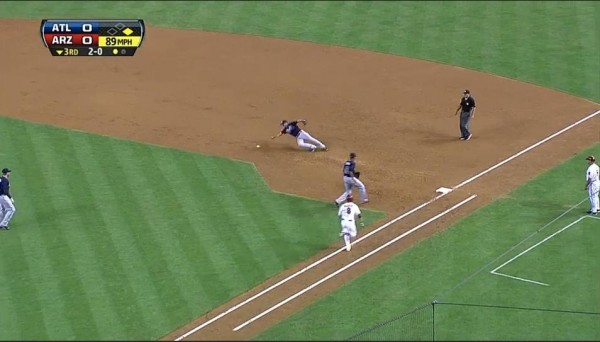
13. This.
‘Nuff said.
Jason Bay–645th overall (22nd round) in 2000; 20.4 WAR
Now, here’s where I bend the rules a bit. See, at the time of my writing this, Bay no longer exists on any major league roster, and is therefore not an “active player”. However, he did play this season, so I’m including him (along with the player two spots down on the list).
Long before Bay was the poster boy for horrible contracts in sports (and the poster boy for, well, the Mets), he was a quality major leaguer–over 2003 to 2009, the fifth-best offensive left fielder, in fact. Long before that, he was picked out of Gonzaga by the Expos, and involved in many a trade before he became a regular (Lou Collier, Jason Middlebrook, and Brian Giles******* going the other way in those trades).
Long before all that, however, he was a Canadian high schooler who was interested in, and very good at, a non-hockey sport–not exactly a one-way ticket to success. Undeterred, he went to North Idaho CC–basically the only place that would take him–and proceeded to crush the competition. And his reward for the perseverance? He played at glamorous Gonzaga and was drafted by a now-defunct franchise! Well, at least he’ll always have the hatred of the largest city in the U.S.…
Roy Oswalt–684th overall (23rd round) in 1996; 49.6 WAR
Oswalt’s career path was similar to that of Pettitte–a dominant high-school pitcher, who fell in the draft because of concerns about his weight. Except, Oswalt’s problem was the opposite of Pettitte–he weighed too little, a 150-pound senior at nearly 6 feet tall. So I guess Oswalt’s more like Kinsler than Pettitte. Whatever.
The obscurity of Oswalt’s school, in (essentially) the pre-internet days, certainly didn’t help his case. Oswalt attended Weir High, in Weir, Mississippi; the town had a total population of about 500, and there were about 30 in Oswalt’s class. Before Oswalt badgered the school, it didn’t even have a baseball team. After a year pitching for Holmes Community College, the Astros were apparently the only team to scout Oswalt, and they were smitten. Not quite smitten enough to draft him before the 23rd round (because they were the only team to scout him, they let him fall in the draft, knowing no one else would take him), but still smitten. He didn’t sign immediately however, and the Astros used the DAF rule on him, allowing him to pitch another year at Holmes CC. So, I guess he is more like Pettitte. Whatever.
Signing him proved to be a little daunting, as he was being offered a full ride from Mississippi State, and his boyhood dream had always been to pitch for the Bulldogs. Getting half a million as a signing bonus tends to make people forget about their boyhood dreams, however, and Oswalt was no exception. On May 18th, 1997, pushing the DAF rule to its limit (like Pettitte), Oswalt signed with the Astros, and, well, you know the rest. Pretty good for a 23rd-rounder in 1996. Speaking of which…
Ted Lilly–688th overall (23rd round) in 1996; 26.3 WAR
On Lilly, I have a few things to say:
1. If only he’d finished .1 WAR lower! Then I could’ve called him “Marathon Man”, and made horrible puns like “Why don’t you just try pitching?” and things of that ilk. Oh, well. A man can dream, though.
2. Lilly, like Bay, is no longer on a major league roster, so he shouldn’t technically be considered an active player. However, he played in the majors this season (not well, but he played), so he’s on the list. Deal with it!
3. Was the 23rd round of the 1996 draft the best late draft round ever? If not, certainly one of the best. I mean, only 3 players from it made it to the major leagues, and one of them was Jason Smith, so it wasn’t exactly deep, but still–74.7 combined WAR, for the TWENTY-THIRD FUCKING ROUND! Maybe a subject for a future article…
4. Lilly was drafted by the Dodgers in 1996, then traded to the Expos in 1998, along with Peter Bergeron, Wilton Guerrero, and Jonathan Tucker, for Hiram Bocachica, Mark Grudzielanek, and Carlos Perez. Obviously, looking back, Lilly was the best player in that trade (though an argument could be made for Grudzie), so why was he considered a low-level prospect? Well…I’m not really sure. Seriously, I couldn’t find anything about the bastard! I mean, there was this article, which talked about his minor-league ascension and success, but nothing about him pre-draft. Well, 23 out of 24 ain’t bad. Hey, at least I’m better than the Phillies.
Kyle Lohse–862nd overall (29th round) in 1996; 24.7 WAR
Yeah, that’s right, another pitcher from 1996! Think I’m done? Baby, I’m just gettin’ started! Well, anyways…Lohse’s main clam to fame is being one of the only Native Amuricans in MLB, along with Joba Chamberlain and Jacoby Ellsbury (insert racist joke about how “he should play for the Indians or Braves!” here). Despite being a star athlete in high school, he was largely unnoticed, and fell in the draft. He went to Butte College after the Cubs picked him, ‘cuz of that nifty DAF rule, and signed with them at the end of his freshman year.
What kept him so low in the draft? His velocity was never great as a minor leaguer, and he projected to be a back-of-the-rotation starter; with a career ERA of 4.79 innings prior to 2011, he achieved that goal. Then, of course, came 2011 until the present, during which he’s pitched to a 3.14 ERA and provided 6.7 of that career WAR. This sudden turnaround, while fairly unprecedented, is not necessarily luck–he did make some major changes to his pitch selection, and changing your repertoire can lead to new success, even for old, unproven pitchers (see Dickey, Robert Alan).
Travis Hafner–923rd overall (31st round) in 1996; 20.9 WAR
Okay, seriously? How many players from the goddamn 1996 draft are there?!?! *Sigh* Well, Pronk was similar to Kendrick and Pujols in that he went to a community college–Cowley County CC–and this certainly contributed to his low position in the draft. (As an aside, whoever enters colleges for ESPN must’ve really liked CCCC.) Though Hafner had natural ability at baseball (obviously) before coming to CCCC, he knew absolutely zilch about the rules and lingo, having to ask his coach during practice, “What’s a fungo?” Nature, however, won out over nurture, and Hafner soon mashed at the (low) collegiate level.
When he was drafted by the Rangers, though, he struggled early on; by the time he hit his stride in 1999, and was major-league ready in 2002, the Rangers (like the Rangers today) had a plethora of high-caliber first baseman-DH types (namely, Mark Teixeira and Rafael Palmeiro). With Ivan Rodriguez an impending free agent, however, they needed a catcher, so after the 2002 season, the Rangers traded him to the Indians, along with Aaron Myette, in exchange for Ryan Drese and Einar Diaz. The Indians were prepared to let Jim Thome, a free agent, walk, so they needed a new first base-DH type; after a mediocre first year, Hafner did a pretty good Thome impersonation (at least when healthy).
Raul Ibanez–1006th overall (36th round) in 1992; 20.8 WAR
Well, we’re down to our final two. I feel like we’ve grown closer over this whole process. You know what I mean? At the beginning, we were just doing this because we felt like we had to, but now, we’re doing it because we want to. What’s that? I’m just being creepy, and I should get to the explanation of why Ibanez was drafted as late as he was? Okay then. I thought what we had was special, but I guess I was mistaken.
Ibanez (one of the two “millennium men” in the countdown; if you can’t figure out why they’re called that, you’re on the wrong website) was successful at high school and went to play college baseball at Miami-Dade CC (the same school as Polanco). He was viewed as a project by major league scouts, and was drafted by the Mariners accordingly. Now, this isn’t an uncommon path–a player is told he’s flawed, gets drafted in the late rounds, goes back to school to correct those flaws, and gets drafted higher the next year. In Ibanez’s case, though, going back to school wasn’t an option, as his father died a few months before the draft; knowing that his father would’ve wanted him to play, Ibanez signed with the Mariners (who were prepared to use the DAF rule on him).
Now, back to why he was drafted so late: Ibanez was seen as someone who would take several years to develop into an everyday player; as the article above puts it, “Ibañez is to baseball what Kurt Warner was to the NFL, a late-blooming talent no one knew how to develop.” Once he did develop, he turned into a quality player, which makes him–unquestionably–the best of the active late-round draft picks. At least, it would make him that, if not for…
Mark Buehrle–1139th overall (38th round) in 1998; 47.3 WAR
Buehrle?…………..Buehrle?…………..Buehrle?…………..Buehrle?…………..
The premier innings-eater of the new millennium, as well as heading towards a 13th straight 200-inning season (pretty impressive when you put it in perspective), Buehrle must’ve been, at the very least, a third- or fourth-round pick, right? Nope. He is, in fact, the other millennium man on the list.
As a high schooler in Missourah, Buehrle had the MJ treatment (i.e. he didn’t make the baseball team his freshman and sophomore years); this was enough to make him consider quitting baseball forever. He couldn’t stay away, however, and was good enough in the two years he did play that he got accepted to glamorous Jefferson College, where he had a successful two years. One of those years was prior to the draft, when he was picked by the White Sox; the other was after, when the DAF rule was used (he did threaten to re-enter the draft in 1999, so the White Sox had to make a pretty large offer). Never a top prospect due to a mediocre repertoire, Buehrle slipped under most everyone’s radar. It’s safe to say that wasn’t how things should’ve played out.
Overall, it’s safe to say that all of these players outperformed their expectations significantly. It’s men like this–the hard workers, the perseverers, the ne’er-quitters–that make baseball so great. Oh, and also this guy.
————————————————————————————–
*Apparently, “undrafted” isn’t a word, or so the red squiggly would have me believe. Huh. So “squiggly” is a word, but “undrafted” isn’t? ‘Tis a strange, strange world. Also, “tis” isn’t a word either? WHEN WILL IT END?!?!?
**Am I the only one who’s annoyed by some of the columnists on this site using a plus sign before every WAR value? Call me crazy, but I’d say the positivity is implied by the lack of any preceding symbol.
***I’m so funny, aren’t I?
****Might’ve crossed a line here. Also, FanGraphs should really start doing footnotes, à la Grantland.
*****I swear to God, I’ll make this work.
******Yes, I get that this was done sarcastically.
*******Another unproven prospect traded in that Giles deal? Oliver Perez, whose career has been eerily similar to that of Bay.


 (overthemonster)
 (GIF from SBNation)
 (GIF from SBNation)