After losing David Price to a trade with the Tigers and Alex Cobb to injury, The Rays needed Chris Archer to step up this season. Chris Archer then proceeded to step up this season. He’s carrying a 36 ERA-, 80 FIP-, and 69 xFIP-. His K-BB% is 23.6, better than his career mark by 10%. Obviously his numbers have improved. But it’s April, and the question everyone asks in April is are the improvements sustainable. Real improvements are the results of real changes, so let’s look for real changes.
One of the reasons for Archer’s success this year has been due to his ability to limit walks, which before had been a bit of a problem for him. Coming into the season he had a Zone% of 43.1 which is a tad below the league average. This year, that figure has increased to 54.4%. If you throw the ball in the zone more, you’re gonna get more strikes… more strikes means fewer times behind in the count… etc. You get the idea; good Zone% is good. But it’s not just that he’s throwing more pitches in the zone; Archer is allowing less contact on the pitches he throws there. Archer’s Z-contact rate has dropped by 4% from last year. So, to sum it up, Archer is throwing more pitches in the strike zone and hitters are making less contact when he does. This explains why Archer is getting more strikeouts and conceding fewer walks. What it doesn’t tell us is how he’s doing it. To figure that out, we have to look at his pitch selection.
According to the PITCH F/X data on FanGraphs, Archer was a two-seam-first pitcher last year – throwing the pitch nearly 47% of the time and his four-seamer only about 20%. The year, Archer’s increased the usage of his four-seamer by over 23%, dropping his two-seam rate to only 12%. This change is important because, thanks to work done by Jeff Zimmerman, we know that four-seam fastballs tend get strikeouts more often than their two-seamer cousins do. The four-seam isn’t the only pitch he’s increased usage for either: Archer’s slider rate has gone up to about 39% after sitting a little below 29% last year. Once again, this is good for strikeouts. Because, not only do sliders have the highest SwgStr% among pitch types after splitters, but the increase indicates Archer is more confident in his slider, which could imply that the slider has improved. You can say the same thing about the four-seam.
If you were looking for indicators that Chris Archer’s improved numbers have a level of sustainability, there they are. Those are real changes, from a real pitcher, playing real baseball. The Rays are gonna need an ace-level performance in their rotation this year to help alleviate the loss of David Price and the temporary one of Alex Cobb. It’s beginning to look like Chris Archer is the man for the job.
On July 30, 2014, the Seattle Mariners found themselves in the interesting position of being in playoff contention. The Mariners sported a 32-23 record, only 2.5 games back of the AL West-leading Los Angeles Angels, and owned the third-best Pythagorean record in the American League. Seattle’s newfound position as postseason hopefuls meant that they were suddenly buyers at the trade deadline – not drastically so, but in the sense that the Mariners were only a couple of upgrades away from assembling themselves a nicely well-rounded playoffs roster. Chief among these desired upgrades was a serviceable everyday center fielder, one who could replace a revolving door of below-average outfielders that included Abraham Almonte, James Jones, Stefen Romero, and Endy Chavez.
Jack Zduriencik sought to remedy the Mariners’ outfield issues with a pair of trade deadline deals. The first involved packaging Almonte and minor-league pitcher Stephen Kohlscheen to the Padres in return for Chris Denorfia, a rather unsexy deal to be sure, but one that was a success at the time in that the acquired player was not Almonte. The second deal, a three-way transaction between the Rays, Tigers, and Mariners, was collectively more sexy, but a large share of the sexy went to the Tigers, who landed Rays ace David Price. The other major components of the deal were the Rays’ acquisition of young Mariners middle infielder Nick Franklin and Tigers pitcher Drew Smyly, as well as Seattle’s prospective answer to its outfield problem: Detroit center fielder Austin Jackson.
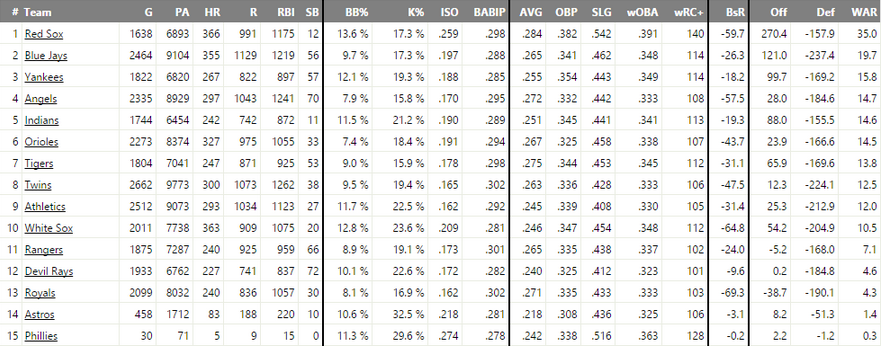
Since his move to the Mariners, Jackson has racked up 277 plate appearances for Seattle, and the results have been fantastically underwhelming. Of the center fielders who amassed more than 100 plate appearances for the Mariners in 2014 – an uninspiring triumvirate of Jackson, Abraham Almonte, and James Jones – Jackson produced the worst offensive performance by wRC+. Jackson’s 2014 performance also disappointed even by more conventional measures:
Jackson totaled 34 extra-base hits in 416 plate appearances for the Tigers in 2014. For the rest of the year, in 240 plate appearances for the Mariners, Jackson managed 6.
Jackson’s ISO dropped from .127 to a paltry .031 with the move from Detroit to Seattle.
Jackson’s 2014 OBP/SLG/wOBA with Detroit: .330/.397/.321. With Seattle: .271/.264/.243.
Not great for a player only two seasons removed from a 5-win campaign.
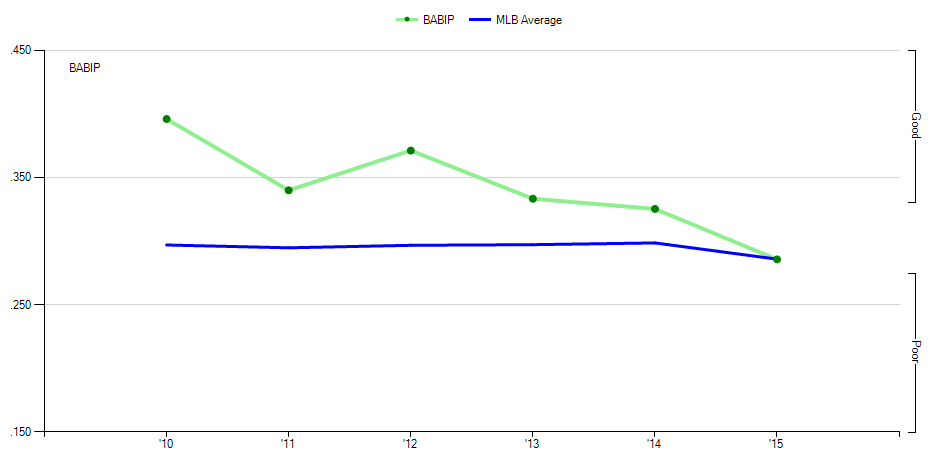
Ostensibly, something was fundamentally different with Jackson in 2014, something that can hopefully be determined by closely examining his recent performance. Looking first to Jackson’s approach, it seems that there hasn’t been too much change over the course of his career. His K/BB ratio has generally hovered around league average and his contact rates haven’t fluctuated all that much from year-to-year. If anything, Jackson’s approach metrics look like they’re trending positively – he actually posted career bests in Z-contact% and SwStr% in 2014. If we examine Jackson’s batted ball data, however, we begin to get a little closer to the root of Jackson’s troubles of late. The most easily identifiable aspect of Jackson’s game can be somewhat distilled in the following graphic:
Over the course of his career, Jackson’s BABIP has been way above league average. He managed an absolutely ridiculous .396 BABIP in his 2010 rookie season over 675 PA, and his career-best 2012 season, in which he posted a 134 wRC+, was bolstered by a BABIP of .371. That figure would predictably fall after 2012, but between 2013 & 2014, Jackson’s BABIP only declined by .008, whereas in the same period, his wOBA fell from a very good .332 to a mediocre .292. This might suggest that in 2014 specifically, it may not have been the frequency with which Jackson was able to put balls in play so much as the quality of those batted balls that limited Jackson’s production.
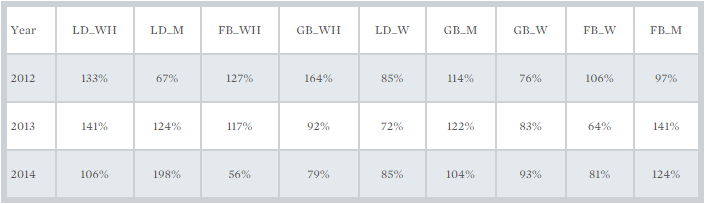
To quickly explain – this table charts batted-ball rates expressed as a percentage of league average. Batted balls are separated into three categories (line drive, groundball, fly ball) which are then further divided into subcategories of contact quality (Well-Hit, Medium, and Weakly-hit). These categories are ordered left-to-right from highest to lowest based on xBABIP.
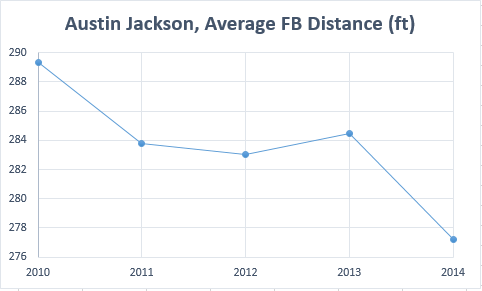
Mailhot astutely notes an alarming drop in well-hit groundball rate – from 64% above league average in 2012 to 11% below league average in 2014. This is accompanied by a commensurate rise in weakly-hit groundballs. Jackson’s well-hit line-drive rate also drops by a sizable amount, hovering around league average in 2014, while his rate of medium-hit line drives balloons to 198% of league average in 2014. Mailhot also points out possibly the most substantial shift: an immense drop-off in well-hit fly-ball rate in 2014 to 56% of league average, a trend corroborated by data pulled from Baseball Heat Maps on Jackson’s average fly ball distance over his career:
Jackson’s high rate of well-hit line drives and ground balls prior to 2014 puts into perspective the aspects of his game that brought him success earlier on in his career, and his sharp decline in those metrics in 2014 even more so. To put it in exceedingly simple terms, Austin Jackson just didn’t really hit balls hard in 2014, something he was quite good at doing before that season. Judging by the splits, most of the not-hitting-balls-hard occurred after the move to Seattle.
Jackson’s 2013 was much better than his 2014, but it is the beginning of a short trend of BABIP decline. From examining batted-ball data, we can infer that quality of contact has a significant bearing on BABIP, and this makes sense using conventional logic as well. Hard-hit line ground balls are more likely to find gaps between defenders, hard-hit line drives are more likely to drop in for hits, and hard-hit fly balls are more likely to turn into extra-base hits (although BABIP ignores home runs). The easy explanation is that Jackson lost some power in 2014. I don’t have enough film on Jackson to know for sure if there’s a visually concrete reason for this (if, for example, there’s something off in his swing mechanics), but data from 2014 indicates that Jackson just hasn’t been making good contact.
Jackson’s issues are probably best explained by his batted-ball troubles, but park factors likely play some part as well, with Comerica Park being relatively more hitter-friendly than Safeco Field. Safeco’s pitcher-friendly park factor and the ‘dead ball effect’ of Seattle’s marine air probably have something to do with Jackson’s decline in fly-ball distance, although Jackson is himself contributing to that same decline in some measure.
At the time of his acquisition, a merely average performance from Jackson would have been a significant upgrade over the convoluted mishmash that had previously taken the field for the Mariners. Unfortunately, he was unable to even provide replacement-value production after coming to Seattle, totaling -0.4 wins above replacement in 2014. The Mariners traded for an above-average player and received the production level of a player who theoretically wouldn’t cut it in the big leagues altogether.
The prospect of 2015 being a bounceback year for Jackson has not gone over too well in these first few weeks. ZiPS (R) and Steamer (R) still think Jackson could manage 1.7-2.1 WAR on the season, which is a bit below his peak, but I think the Mariners would take that statline in a heartbeat. I’ve gone this far without mentioning Jackson’s other tools, but as a 28-year-old without a concerning injury history, there’s not as much reason to worry about his defense and baserunning as there is to worry about his offensive output. Jackson was a below-average defender by UZR in 2013/2014 and has been worth approximately 4 baserunning runs above replacement in each of the past couple of years, neither of which have dictated his value nearly as much as his offense, or lack thereof. Using those numbers as a serious predictive measure from year-to-year is simply not very useful at this point.
Lloyd McClendon was Jackson’s hitting coach back in Detroit, and suffice it to say he probably has a better grasp on Jackson’s habits as a batter than most. If anyone’s able to get Jackson back on track this season, it’s probably McClendon. At time of writing (the 18th of April), Jackson managed a slightly encouraging 2-hit, 1-walk performance against the Rangers. It’s early yet in the season, and there’s time for Jackson to hopefully figure things out. Alternatively, if Jackson can’t find some of his pre-2014 form this season, the Mariners might once again find themselves in the same trade deadline predicament from last year – only this time, there’s not an obvious trade chip à la Nick Franklin. Then again, 2015 is Jackson’s last year under team control, so the Mariners may simply choose to let him walk after the year is over if they’re not satisfied with his performance. If that’s the case, it’s hard to imagine looking back on the 2014 Jackson trade with anything but the same tinge of regret and frustration that has colored so many other Mariners transactions of the last decade.
In “Hardball Retrospective: Evaluating Scouting and Development Outcomes for the Modern-Era Franchises”, I placed every ballplayer in the modern era (from 1901-present) on their original team. Therefore, Frank Robinson is listed on the Reds roster for the duration of his career while the Rangers claim Ivan Rodriguez and the Red Sox declare Jeff Bagwell. I calculated revised standings for every season based entirely on the performance of each team’s “original” players. I discuss every team’s “original” players and seasons at length along with organizational performance with respect to the Amateur Draft (or First-Year Player Draft), amateur free agent signings and other methods of player acquisition. Season standings, WAR and Win Shares totals for the “original” teams are compared against the “actual” team results to assess each franchise’s scouting, development and general management skills.
Expanding on my research for the book, the following series of articles will reveal the finest single-season rosters for every Major League organization based on overall rankings in OWAR and OWS along with the general managers and scouting directors that constructed the teams. “Hardball Retrospective” is available in digital format on Amazon, Barnes and Noble, GooglePlay, iTunes and KoboBooks. The print edition is coming soon. Additional information and a discussion forum are available at TuataraSoftware.com.
Terminology
OWAR – Wins Above Replacement for players on “original” teams
OWS – Win Shares for players on “original” teams
OPW% – Pythagorean Won-Loss record for the “original” teams
Assessment
The 1924 Washington Senators OWAR: 43.1 OWS: 287 OPW%: .615
Based on the revised standings the “Original” 1924 Senators obliterated the competition with the Tigers finishing a distant 13 games in arrears. Walter “Big Train” Johnson, approaching the final stop in his 21-year career, continued to blow smoke past American League batsmen. He whiffed the most batters in the Junior Circuit for the twelfth time and furnished a 23-7 mark with the best ERA (2.72) and WHIP (1.116) in the League. Johnson received the MVP Award for his efforts in ’24 and the future Hall-of-Famer retired three years later with 417 victories, a 2.17 ERA and a 1.061 WHIP along with 3,509 strikeouts and the most shutouts in Major League history (110). Johnson ranks first among pitchers in “The New Bill James Historical Baseball Abstract”.
Jack Bentley bolstered the Washington pitching corps, delivering 16 victories against 5 losses. Firpo Marberry split time between the rotation and bullpen, notching 11 wins and saving 15 contests (although saves were not officially tabulated until 1969).
ROTATION
POS
WAR
WS
Walter Johnson
SP
7.02
28.65
Jack Bentley
SP
1.96
11.78
Firpo Marberry
SP
1.48
17.72
Joe Martina
SP
0.35
5.74
BULLPEN
POS
WAR
WS
Ted Wingfield
RP
0.67
2.54
By Speece
RP
-0.25
3.52
Slim McGrew
SP
-0.27
0.32
Paul Zahniser
SP
-0.28
3.72
Goose Goslin (.344/12/129) topped the American League leader boards in RBI while recording 199 hits and 100 runs. The future Hall of Famer surpassed the century mark in ribbies 11 times and recorded a .316 lifetime batting average. Sam Rice batted .334 with 106 runs scored and 39 two-baggers while producing a League-best 216 base hits. A .322 career hitter, Rice concluded his career only 13 hits shy of 3,000.
Charlie Jamieson rapped 213 safeties and posted a personal-best .359 BA after leading the Junior Circuit in the previous campaign with 222 knocks. First-sacker Joe Judge clubbed 38 two-base hits and delivered a .324 BA. Goslin rated 16th among left fielders in the “NBJHBA”. Rice (33rd-RF), Judge (44th-1B) and Bucky Harris (70th-2B) also placed in the top 100 at their respective positions.
LINEUP
POS
WAR
WS
Charlie Jamieson
CF/LF
3.09
19.11
Sam Rice
RF
3.65
23.99
Goose Goslin
LF
5.69
28.91
Joe Judge
1B
2.12
19.08
Ossie Bluege
3B
0.72
10.42
Bucky Harris
2B
0.32
13.31
Eddie Ainsmith
C
0.11
0.45
Howie Shanks
SS
-0.02
5.21
BENCH
POS
WAR
WS
Frank Brower
1B
1.05
5.27
Irish Meusel
LF
0.98
16.78
Doc Prothro
3B
0.9
5.89
Bing Miller
RF
0.83
13.65
Earl McNeely
CF
0.3
5.84
Carl East
RF
0.09
0.36
Ike Davis
SS
0.02
0.35
Bennie Tate
C
-0.02
0.64
Carr Smith
RF
-0.13
0.04
Tommy Taylor
3B
-0.13
0.85
Showboat Fisher
RF
-0.14
0.4
Pinky Hargrave
C
-0.35
0.21
Mule Shirley
1B
-0.5
0.34
Frank Ellerbe
3B
-0.9
2.19
The “Original” 1924 Washington Senators roster
NAME
POS
WAR
WS
General Manager
Walter Johnson
SP
7.02
28.65
Thomas Noyes
Goose Goslin
LF
5.69
28.91
Clark Griffith
Sam Rice
RF
3.65
23.99
Clark Griffith
Charlie Jamieson
LF
3.09
19.11
Clark Griffith
Joe Judge
1B
2.12
19.08
Clark Griffith
Jack Bentley
SP
1.96
11.78
Clark Griffith
Firpo Marberry
SP
1.48
17.72
Clark Griffith
Frank Brower
1B
1.05
5.27
Clark Griffith
Irish Meusel
LF
0.98
16.78
Clark Griffith
Doc Prothro
3B
0.9
5.89
Clark Griffith
Bing Miller
RF
0.83
13.65
Clark Griffith
Ossie Bluege
3B
0.72
10.42
Clark Griffith
Ted Wingfield
RP
0.67
2.54
Clark Griffith
Joe Martina
SP
0.35
5.74
Clark Griffith
Bucky Harris
2B
0.32
13.31
Clark Griffith
Earl McNeely
CF
0.3
5.84
Clark Griffith
Eddie Ainsmith
C
0.11
0.45
Thomas Noyes
Carl East
RF
0.09
0.36
Clark Griffith
Ike Davis
SS
0.02
0.35
Clark Griffith
Howie Shanks
SS
-0.02
5.21
Thomas Noyes
Bennie Tate
C
-0.02
0.64
Clark Griffith
Carr Smith
RF
-0.13
0.04
Clark Griffith
Tommy Taylor
3B
-0.13
0.85
Clark Griffith
Showboat Fisher
RF
-0.14
0.4
Clark Griffith
By Speece
RP
-0.25
3.52
Clark Griffith
Slim McGrew
SP
-0.27
0.32
Clark Griffith
Paul Zahniser
SP
-0.28
3.72
Clark Griffith
Pinky Hargrave
C
-0.35
0.21
Clark Griffith
Mule Shirley
1B
-0.5
0.34
Clark Griffith
Frank Ellerbe
3B
-0.9
2.19
Clark Griffith
Honorable Mention
The “Original” 1915 Senators OWAR: 49.1 OWS: 272 OPW%: .565
“Big Train” Johnson (27-13, 1.55) completed 35 of 39 starts while leading the American League in wins, WHIP (0.933), innings pitched, shutouts and strikeouts. The rotation was supplemented by Doc Ayers (14-9, 2.21) and Bert Gallia (17-11, 2.29). Clyde “Deerfoot” Milan swiped 40 bags and Tom Long legged out 25 triples at the top of the lineup.
The “Original” 1965 Twins OWAR: 46.0 OWS: 280 OPW%: .644
Zoilo Versalles topped the leader boards with 126 tallies, 45 doubles, 12 triples and 308 total bases to capture the 1965 A.L. MVP Award. Teammate Tony Oliva (.321/16/98) finished runner-up in the MVP race and collected his second batting title. Bob Allison, Jimmie Hall and Harmon Killebrew slammed at least 20 circuit clouts apiece. Jim Kaat (18-11, 2.83) anchored the starting staff and Ted Abernathy led the League with 31 saves and 84 relief appearances.
Advanced metrics in baseball have by and large proven useful for the evaluation of players and teams in the American pyramid of professional baseball, generally comprised of Major League Baseball franchises and their minor-league affiliates. This means that at least in the mainstream sabermetrics community, the vast majority of work in advanced analytics has taken place within the borders of the United States. It’s no secret, however, that MLB franchises have vast scouting networks all across the globe – baseball has always been a sport with tons of growth potential, and especially over the last half-century, MLB has imported talent from an incredible geographic range. Teams have long-running infrastructure for scouting, acquiring, and developing young players from other nations – a trend which is almost certainly guaranteed to continue in the future.
Major League teams with their own analytics departments no doubt have a wealth of resources for the evaluation of foreign talent, but for the average sabermetrician who does not have access to baseball academies in Latin and Central America or who can’t regularly view other professional leagues in countries like Korea, Japan or Taiwan, the requisite data are hard to come by. Baseball-Reference has a wealth of information on other leagues such as Nippon Professional Baseball, but only relatively traditional statistics are available, limiting the extent to which those who aren’t involved with professional organizations can observe and interpret those figures.
It’s easy to look up anyone’s batting average with RISP in NPB, but we’ve not yet arrived at a point where we (we being a fan of modest statistical background with access to free data on the internet) have been able to easily produce, say, a run expectancy table, or calculate a replacement level, for a non-MLB league without much more effort than should be necessary. At the very least, we can derive the most basic of metrics – here I’ve compiled a list of last year’s Nippon Professional Baseball leaders and calculated FIP (min. 48 IP), which thankfully wasn’t at all difficult to do because the statistics necessary to calculate FIP are simple and easily available. It’s not as if it’s impossible to achieve the level of analytical proficiency with NPB that we have with MLB, it just hasn’t happened yet.
There’s logical explanations for this, but given the data available to us, it should only be a matter of time before sabermetrics begin to thrive outside of the United States for amateur statisticians and professional sports organizations alike. I would venture that there’s definitely a growing interest in international baseball from the American fan community; personally, I’m all for a sweeping movement in statistical analysis for international baseball leagues – not just to find the next Masahiro Tanaka or José Abreu, but with a real vested interest in other incarnations of America’s national pastime. We’re a long way from it, but it’s not out of the question to imagine an international baseball dynamic where fans follow the NPB with the the same fervor of an American soccer fan who might support a club in the English Premier League or the German Bundesliga. In that hypothetical scenario, sabermetric analysis is thriving, and most importantly, it’s thriving just as much outside the MLB as in it.
In part 1, I found that, counter to my expectations, range correlated most strongly with FSR data of all the UZR components (UZR itself had a stronger correlation with FSR). I expected the strongest-correlated component to be errors, which was actually one of the least-correlated components. However, I wanted to go a little bit farther and look at the difference between correlations between the UZR components and FSR and the correlations between the UZR components and UZR itself to get a sense of what the fans weight more than UZR does. As a reminder, here is the data set I compiled for this analysis:
“I pulled the defensive stats of every player who qualified (minimum of 900 innings) at a position from 2009-2014 (FSR data is only available for those six seasons on FanGraphs). I then disregarded catchers, as UZR does not cover the position. Likewise, pitchers are left out because they are not covered by UZR or FSR. That left me with 761 player seasons across the other seven positions.”
Without further ado, here are the correlations between UZR and its components:
I always had a suspicion that range was the most important component of UZR but these results are insane. It turns out range is far and away the most important component of UZR. Interestingly, the weakest correlation for range is at SS, perhaps because shortstops without proper range are moved to another position. ARM, although only calculated for outfielders (a real shame as Andrelton Simmons deserves credit for being able to make this throw), has the second-strongest correlation but lags range by a large amount. Like the FSR correlation, it is surprising that LF has a stronger ARM correlation than CF or RF. DPR narrowly edges out errors, although the correlation for errors is far stronger when you only consider infielders. Now, to get a sense of the difference, here’s the two sets of correlation subtracted from each other (positive numbers mean the correlation with UZR is higher and negative numbers mean the correlation with FSR is higher):
There are two different ways to look at this: one is that FSR has nearly the same correlation as UZR in most categories. That’s good! It lends a lot of credibility to FSR to know that you can predict FSR nearly as well as UZR with ErrR or DPR. On the other hand, look at the huge difference in the range column. It appears that the fans are severely underestimating the importance of having great range (or have different ideas of how to evaluate range). That’s a problem! As we just saw, range is the most important component of UZR for every position. It is also not terribly surprising as I hypothesized at the beginning of this series that the fans are underestimating the importance of range in favor of flashier tools. This also explains a lot of the discussion about Derek Jeter’s defensive ability (or lack thereof).
This sums up the research portion of this series. I think all of this does lend a lot of credence to FSR: it does reflect that range is the most important component of defense and it does a good job of properly ranking the importance of the other components. In addition, the correlation between FSR and UZR is fairly strong but not so strong that the two systems are interchangeable. However, when considering FSR, be sure to mentally adjust when a player has particularly good (or bad) range.
In part 3, I will examine some of the player seasons that produced the most disparity in the two rankings.
Edgar Martínez is kind of a demigod in Seattle. If you drive west past Safeco Field, parallel to the first-base line, you’re doing so on Edgar Martínez Drive (hang a right at home plate and you’re on Dave Niehaus Way).
He’s the only one of the franchise’s most celebrated players, besides hopefully Felix, to have spent his entire career with the Mariners organization, something Ken Griffey Jr. and Ichiro can’t lay claim to. His game-winning double in the 1995 ALDS is the Seattle Sports Moment to many, and it was just a quarterfinal, Super Bowl/’79 NBA Finals/1917 Stanley Cup be damned.
He’s also the greatest designated hitter of all time, and if not the greatest (which he is, in a completely objective manner of speaking untainted by my personal preferences) the player who perfectly typifies the designated hitter position. For years he has been the barometer of the DH, the mark by which all who came before and all who shall come after will be evaluated – Frank Thomas and Jim Thome weren’t purebred designated hitters the way Edgar was. Although Edgar won his first batting title playing third base, a hamstring injury relegated him to the DH role, so he was the only one of the three to primarily play designated hitter for most of his career, unlike Thomas and Thome, who spent much more time in the field. Also, Frank Thomas was an absolutely filthy pitcher in Backyard Baseball 2003, as well as complete garbage as a hitter in that very same game, so don’t you tell me that designated “hitter” is his primary position.
seriously this makes no sense
But whatever Edgar Martínez meant to the DH position went tenfold for the Mariners. For me Edgar’s retirement was in a way the turning of a page for the franchise, but his loss as a Mariners icon could ostensibly be counteracted somewhat by roster stalwarts Ichiro, Dan Wilson, Bret Boone, and Jamie Moyer (duh), among others.
What would change almost irreparably was the Seattle Mariners’ designated hitter slot that Martínez vacated when he retired.
2015 marks the Mariners’ eleventh season since Martínez’s retirement, meaning that a full decade has passed in the majors without Edgar on the Mariners. The first step in our journey into an Edgar-less world begins with a ranking of cumulative fWAR at the DH position by team from 2005 (the Mariners’ first season without Martínez) to 2014.
The first thing you’ll notice seems pretty intuitive, which is that the top 15 teams are all American League teams – this obviously makes sense because the DH rule is only applicable in the American League, so it would logically follow that the fifteen American League teams would have accrued the most Wins Above Replacement in the major leag-
wait, hold up – philadelphia????????
where are the mariners
um
ok
lemme just scroll down to find them, one sec
..
…
….
…………
uhhhhhhhhhhhh
So Mariners designated hitters rank 27th, which means that between the Mariners and the Astros, twelve – TWELVE National League teams, who only employ a designated hitter for a handful of games per season (interleague away games to be exact), have produced more fWAR at that position over the last decade than the Mariners, who use a designated hitter on pretty much a daily basis.
In fairness, the explanation for this seems logical: the defensive fWAR penalty for the designated hitter position (the highest of any defensive position) is cumulative – it increases with the amount of innings played at any given position. The Mariners have accrued ungodly of amounts value above below replacement by trotting out consistently bad DH production, whereas the magnitude of damage a National League DH can do to his team’s aggregate replacement value is limited by sample size. Something that I don’t completely understand is that FanGraphs’ data on National League players DHing seems to be incomplete, but maybe it just has something to do with eligibility not lining up with FanGraphs data or the fact the sample size of National League DHs is inadequte. Perhaps having all National League DHs accounted for just wouldn’t be worth the effort or be statistically significant.
Even if we remove the National League from the equation, the Mariners are still dead last in their own league by quite a bit. The next-worst team, Houston, has been in the American League for all of two full seasons and has managed to comfortably outpace Seattle (upon further examination this is made more impressive by the fact that one of those seasons, Chris Carter’s 37-dinger campaign in 2014, doubles Seattle’s cumulative fWAR over the entire decade in magnitude). But then again as stated before, Seattle have incurred a penalty for having adhered to the DH rule since its inception, whereas Houston have only had two seasons to let the DH penalty pile up.
In order to ascertain exactly what shenanigans could have gone down with the M’s DH position such that all Seattle DHs from 2005-2014 collectively managed to produce fewer wins than Edgar’s farewell 2004 season (his worst by fWAR, totaling -0.5), here’s a fond look back at some of the Mariners’ highlights at DH over the past decade (min. 100 PA), ordered by total fWAR produced for the Mariners.
FanGraphs lists Branyan first in highest total accumulated fWAR post-Martínez for any Seattle DH, which makes sense, because his 2009 116-game stint with the Mariners was quite good-until you realize that he played all of those games for the Mariners at first base, meaning that 2.7 wins of these 3.4 weren’t even put up from the designated hitter slot. Fun fact: Branyan’s 2009 season, in which he swatted 31 homers and posted 126 wRC+, is the only season since 2006 in which a Mariners player has hit 30 homers (2013 Ibañez missed this mark by just one home run).
On the bright side, Branyan returned to the Mariners via trade in June of 2010, and this time he actually put in some time at DH. He managed to do quite well for himself, with 121 wRC+ in 238 plate appearances, and 25 of his 44 hits went for extra bases. After a couple 2011 stints with Arizona and Los Angeles, he then decided that playing for Seattle had ruined the major leagues for him and went on to play only in minor-league and Mexican league games for the rest of his career.
Jasoshared catching and DH duties with Jesus Montero in 2012, and in only 108 games became the second-most valuable position player on the team by fWAR behind Kyle Seager. Jaso also had the third-highest walk of rate of any position player in baseball (min. 350 PA) in 2012 and was Felix Hérnandez’s batterymate for his perfect game against the Tampa Bay Rays.
The Mariners then infamously dealt Jaso to division rival Oakland in a three-team deal that yielded a return of Michael Morse, former Mariner just coming off a career year with Washington in 2011. Morse played half of the 2013 season before injury caught up to him and he was shipped off to Baltimore.
Jack Z could lead the Mariners to 4 consecutive titles and be the executive of the year each of those years and Mariners fans (myself included) would probably still find time to complain about the Jaso-Morse Trade for some reason. Jaso is currently back with Tampa Bay and is currently injured, but his 2013 and 2014 seasons were still much better collectively than what the Mariners fielded during that same time period.
At the same time Russell Branyan was busy dirtying himself in the field and hitting big hits, the Mariners extended 2 non-roster invites in 2 consecutive years to great Royals player, great hitter, and great all-around guy Mike Sweeney (who doesn’t have a picture on his Wikipedia profile, but Yuniesky Betancourt does….?). Making the team both times, Sweeney was a productive hitter for the Mariners in 2009 and 2010 and was traded to the Phillies, they of the 15th-ranked DH fWAR, in time for the NLDS, where he was able to collect a hit in his first and only postseason at-bat (against Aroldis Chapman, no less). He then signed a one-day contract to retire a Royal. It’s nice to feel good about something tangentially Mariners-related every once in a while, especially because after we move past Sweeney on this list things start to get a little dicey.
Morales was one of the better hitters on a largely uninspiring 2013 Mariners team, boasting a .342 wOBA and a 119+ wRC, both of which would have led the team if not for an incredibly strange Raul Ibañez season. The Twins signed Morales as a free agent the following offseason for $7.6 million, which was kind of strange but made sense if they could turn that value into something. It turns out that something was the Mariners’ Stephen Pryor, and Morales ended up back in Seattle, where he had effectively iced his chances of cashing in on a qualifying offer from the Mariners a year ago. In 2014, Morales put up -0.8 fWAR for Minnesota and -1.0 fWAR for Seattle, by far the worst year of his career.
A profile of Jack Cust came up on the Jumbotron at Safeco Field once while I was in attendance at a Mariners home game, in which he stated that his favorite quote was “play hard”, a nugget of wisdom Cust attributed to himself. The combination of that Jumbotron quote and Cust’s .116 ISO for the Mariners in 2011 continues to be one of the more perplexing relationships I’ve observed to date, as is the 97 wRC+ (Cust’s wRC on the season was 20).
Vidro, who leads the players on this list in plate appearances with 955, spent almost two seasons with the Mariners (2007 & 2008). His 2007 season with Seattle wasn’t bad – his .775 OPS was just above league average, his 10.1 BB% was just above league average, and his .345 wOBA was just above league average. Vidro decided to use 2008 to erase most of the solid work he had done in the previous year, cutting his walks in half, getting on base 70% as often, and found himself designated for assignment and later released that summer.
Dobbs didn’t really play enough to be remembered as outright terrible, usually taking backup duty at third base and then being relegated to a pinch-hitting/DH role in 2005/2006. Before we move on, there’s a couple interesting notes about Dobbs.
First, Greg Dobbs hit a home run in his first at-bat with the Mariners (and his first major league at-bat), which would turn out to be the only home run he would hit in 2004. This isn’t particularly notable except for the fact that it always reminds me that Miguel Olivo also homered in his first major league at-bat, which I will never forget for some incredibly frustrating reason. “Miguel Olivo homered in his first major league at-bat. He was with the Chicago White Sox and the home run was off Andy Pettitte”. This useless piece of information has been wasting my neural capacity ever since I read it on some Mariners gameday program, which I think had Richie Sexson on the cover, so I’m jointly blaming Sexson and Olivo both for forcing me to remember that information and also for being pretty underwhelming with the Mariners.
The second thing is Dobbs’ 2006 season, in which he was only around for 28 PA in 23 games, 18 of which he came in as a pinch-hitter. In those games he managed 150 wRC+ on a cool .435 BABIP. He also walked 0 times. Ultimately it was only 28 PA, an absurdly silly sample size, and clearly the Mariners felt similarly, because they waived out of him in 2007, whereupon Pat Gillick, now with the Phillies, decided to take a second chance on Dobbs long enough for him to earn a World Series ring in 2008.
Carl Everett was a two-time All-Star in Boston, put up a six-win season with the Astros, and found himself signed by the Mariners for the 2006 season, where he had his worst offensive season by far. Everett was league-average in B% and K% and that was about it. Everett was released in July of 2006 at the age of 35, having posted -0.8 fWAR in 92 games. You could say he was getting to be a bit of a dinosaur, but don’t tell Carl Everett anyone said that about him.
Broussard was acquired by the Mariners from Cleveland in the second half of the 2006 season, filling in mostly at DH after Carl Everett’s dismissal; in that time-frame Broussard’s figure of 78 wRC+ is not particularly inspiring, and only slightly bests Everett’s. Broussard then spent most of his first and only full season (2007) for the Mariners switching between first base and the corner outfield spots, His overall 88 wRC+ was a slight improvement but still not great, especially while the man Bill Bavasi gave up to acquire Broussard, Shin-Soo Choo, has produced 24.3 fWAR since the 2007 season.
Jesus Montero is now somewhat of a tragic figure among Marinerds. In the 2012-2013 offseason, Montero claimed that he had a coach who had helped him ‘learn to run’, which I guess if you haven’t yet is probably a good idea. He then cut his 2013 season short by getting suspended for his involvement in the Biogenesis snafu. Last August, he got into a bizarre altercation. Montero’s role in the organization has strayed far from the top hitting prospect the Mariners traded Michael Pineda(who’s now the #3 in New York) for. Montero continues to toil away in the Mariners’ farm system (reports out of Tacoma yesterday were that he legged out an infield single), in the hopes he can top 2013’s terrible 64 wRC+. Montero is still only 25, so it’s not as if all hope is lost, but the fact remains that his on-field production at the major league level has been nothing short of disappointing.
14. Ken Griffey, Jr. [1989-99(omitted), 2009-10], 84 wRC+, -0.9 fWAR
Nobody was expecting 90s Griffey Jr. the ballplayer, which was convenient because he didn’t show up. Griffey was only mediocre in 2009, with a wRC+ of 97 and a wOBA of .324, rendering him merely replacement-level (0.0 fWAR). 2010 was a different story. Griffey Jr. posted a depressingly bad 32 wRC+ in 108 plate appearances. Amid issues with Don Wakamatsu restricting his playing time and the bizarre rumor of Griffey napping during a potential pinch-hit opportunity, things came to a head in June of 2010, when Griffey abruptly left the club, drove home, and announced his retirement before the next days game. The Kid’s return to Seattle was a welcome dip into the nostalgia-drenched coffers of yesteryear for a struggling ballclub, and before anyone had time to process it, the sweetest swing in baseball was silenced in a flash.
Hart has the lowest single-season WAR of any player on this list. The Mariners paid $6 million with $7 million in undisclosed incentives for a year of Hart coming off a knee surgery that caused him to miss all of 2013, which at the time seemed to be a reasonable gamble for a high-risk commodity that could potentially have paid great dividends. Unfortunately, Hart struggled to stay healthy and perform. playing only 68 games in the season; the midseason acquisition of Kendrys Morales certainly didn’t help. Ultimately the Mariners’ front office decided to take a gamble with Hart and lost.
BONUS ROUND (fun with small sample sizes): Scott Spiezio in 2005
Scott Spiezio in 2004 was simply a bad infielder and player, posting a miserable .288 OBP, 67 wRC+, among other poor statistics on his way to putting up a below replacement-level season of -0.1 fWAR.
Big deal though – it’s one bad season. Besides, if you look up on that same list, Carl Everett put up -0.8 fWAR in 92 games. Eduardo Perez did it in 43!
This is nothing to Scott Spiezio.
Again, the sample size here is ridiculously small, but the absurdity of the numbers he managed to log in 29 games is honestly kind of impressive. The Mariners released him from here and he then went on to win the World Series with St. Louis, even hitting a game-tying triple in Game 2 of the 2006 NLCS, so fortunately he was of some use to a team after that 2005 season.
In fairness, the designated hitter is not an incredibly stable position in today’s game. It doesn’t make sense to pay a premium for a skill that can be replicated by other hitters who can also play competent defense. There are only a handful of “conventional” designated hitters in the league, and even Victor Martinez and his -31.1 UZR/150 in 2014 are called upon to play defense every once in a while. For whatever reason – be it sentimentality with Griffey or having the odds stacked against them with Hart or just because Bavasi (Clement, Broussard), the Mariners have gotten an extraordinarily poor level of performance out of their designated hitters in an Edgar-less world, with some bright spots (Jaso, Branyan, 1 season of Kendrys Morales).
This season, Seattle will call on 2014 home-run king Nelson Cruz to fill in most nights at DH (at least as long as Seth Smith and Justin Ruggiano are healthy enough to man right so Cruz doesn’t have to). In 10 years of trying to fill Edgar’s place, the Mariners haven’t quite succeeded and probably won’t ever do so, but wouldn’t it be something to see them come close?
At the end of spring training, Buck Showalter banished Kevin Gausman from the rotation in favor of Ubaldo Jimenez, a pitcher with a much higher salary and much less talent. Many assumed that Jimenez’ salary largely dictated the move. Yes, he outpitched Gausman in spring training (4.44 ERA to 7.04), but it’s hard to believe that Showalter invests very much in spring training stats, and in any case if you put “4.44” into Google Translator, “success” is unlikely to be one of the resulting character strings.
One Orioles fan of my acquaintance heard that Showalter’s decision had more forethought: Buck’s intent may be to use Gausman much as the fireman reliever of old, and bring him in to critical situations in ballgames regardless of today’s ossified reliever usage patterns. Bill James long ago established that this is the most effective way to use a top-flight reliever, but it is less clear that this is the best way to use a potential #1 starter. Gausman is the only pitcher on the Orioles 25-man roster who has even a prayer of turning into an ace, and it seems unlikely he’ll do it from the pen.
Gausman’s had a somewhat unusual start to his career. In his first two years as a major leaguer, he started 25 games and made 15 relief appearances. There are a total of 15 active pitchers who had at least 25 starts and 15 relief appearances in their first two years:
It’s certainly an eclectic mix. Only Buehrle established himself as an ace, though Arroyo has had a good career as a mid-rotation workhorse, and Masterson and (to a lesser extent) I-Can’t-Believe-It’s-Not-Fausto-Carmona have made useful contributions. For other starters on this list (Wood, Kelly) it’s too soon to tell. Affeldt and Stammen wisely gave up starting and have become bullpen mainstays. More sobering, many of the names on this list have had their careers derailed by injuries. It’s hard to know whether the mixed usage contributed to injury problems for guys like Ogando, Billingsley, and Holland; it is equally possible that conserving these young arms early may have averted even more serious or earlier arm trouble.
Gausman sits uneasily here; he is by far the highest drafted pitcher on this list (fourth overall in 2012). It is unsurprising to see a club experiment with a 38th-round pick who struggles to break a pane of glass, like Buehrle. Such tinkering is less common with a player drafted to be a rotation anchor. Indeed, there are only two other first-rounders on this list, Billingsley and Lynn.
In his first season (2006), Billingsley started 16 games and came in from the bullpen twice. He put up a respectable 3.80 ERA, but with atrocious peripherals (5.8 BB/9, 5,9 K/9). The Dodgers understandably exiled him to the bullpen to start the 2007 season, but Dresden-like pyrotechnics from Proven Veterans Mark Hendrickson, Brett Tomko, and Jason Schmidt forced the Dodgers to put Billingsley back in the rotation in June, and he acquitted himself reasonably the well the rest of the way. He would go on to have uneven success over the next four seasons until diagnosed with a torn UCL in September 2012. He has pitched in two major league games since.
Lance Lynn offers a happier comp for Gausman. He appeared largely in relief (2 starts in 18 games) in 2011. Despite Kyle McClellan’s runtastic performance as the Cardinals’ fifth starter, LaRussa elected not to insert Lynn into the rotation; the Cardinals instead traded for Edwin Jackson, who stabilized the fifth spot. This seems similar to Showalter’s choice: go with the established if not necessarily dominant veteran in lieu of the risky young flamethrower. Lynn had put good numbers in 2011 at AAA, but not in 2010. The Cards’ reluctance to turn over a rotation spot to him in the midst of a playoff run was understandable. Lynn has been in the rotation since 2012, and has consistently produced very close to his career marks of 3.32 FIP and 2.71 K/BB, despite some jumpiness in his ERA.
Both these examples tend to suggest Showalter is making a mistake. The Dodgers finally ran out of Jason Schmidts, while the Cards went with the good-enough E-Jax (and, to be fair, won the World Series). But in each case the young replacement would quickly prove himself superior to the older and supposedly safer option when finally given the chance. There are very few who would predict that, over the course of 30 starts, Jimenez will outperform Gausman in any significant statistical category.
But Showalter has other things on his mind. Specifically, this:
Yep, this is the FanGraphs Depth Chart projection for the Orioles starting rotation, with the O’s ranked 27th out of 30. Not a single starter checks in with a FIP under 4.00. This is a shaky rotation, and the Orioles have no quick way of making it better. Eventually, perhaps as early as next year Gausman, Bundy, and Hunter Harvey will form an enviable top 3, but there’s another problem on Buck’s plate. Next year, much of the current roster may be lost to free agency, including Chris Davis, Matt Wieters, Chen, and Norris. The Orioles are under enormous pressure to win now.
And Gausman can help! Because at this stage of his career, he is a much better reliever than starter. The big difference is in strikeouts:
AL average starter K/9: 7.1
AL average reliever K/9: 8.3
Gausman as starter K/9: 7.0
Gausman as reliever K/9: 11.7
That there is some major whiffage for a staff in dire need of it. Put Gausman together with Zach Britton, Darren O’Day, and Tommy “Big Game” Hunter, and the Orioles have a fully weaponized bullpen. Buck’s plan is to hold on for the first five or six innings, and them shut down the opponent’s offense while the Orioles bats bludgeon their way to victory. And with Gausman acting as a mobile reserve, Showalter can shrink the innings for which the starters are responsible, but do so on a game-to-game basis. On those days when the starters happen to be effective they can go longer, and on those days (more often than not, one suspects) that they get into trouble, Showalter will be able to address some of that trouble with the best arm on the roster.
This isn’t the way I would ordinarily do it, but then again, this isn’t the roster I would have assembled. Showalter has repeatedly shown an ability to work with the tools he has rather than impose some prefabricated tactical rule set that disregards the strengths and weaknesses of his players. Baltimore’s road to the playoffs is neither straight nor sure, but at least it’s Showalter behind the wheel.
There are a lot of people who like baseball. Almost 74 million people attended an MLB game last year, and a 2006 Gallup poll estimated that 47% of Americans identify as a baseball fan. Almost every one of those fans can be more precisely described as a fan of a team rather than the sport itself. FanGraphs readers certainly lie on the less casual end of the spectrum, and that seems to lead to a broader appreciation of baseball in general, but that’s not the case for the vast majority of the baseball-loving populace. Even those who have grown into sport-wide interest didn’t start that way, and probably maintain a preference for one team over all others.
The fan-team relationship, in many ways, is at the heart of baseball. There are easier ways to generate numbers at random, but preference for one outcome over another is what provides a narrative. To be sure, there are lots of ways to enjoy the sport. There is significant pleasure to be had from detailed analysis, or moments of physical grace and power, and everyone is free to enjoy baseball in whatever way they see fit. Rooting, however, is what turns baseball from a hobby into a sport.
What are fans rooting for when they root for a team? Teams today are thoroughly modern organizations, exceedingly large and multifaceted and difficult to grasp entirely. Fans are like the proverbial blind people around an elephant, who comprehend only what they immediately perceive. For most, that’s the laundry, as Jerry Seinfeld famously described it. Everything about a team changes but their name, and sometimes even that changes, but fans remain loyal to the concept of the team, to the history and experiences and hopes they share with other fans. But the second-most enduring aspect of most teams is the owner, far surpassing almost every player, despite being virtually ignored by most fans. Owners are also the ones that benefit most when a team succeeds, and so rooting for a team is in many ways closer to rooting for its owner than rooting for its players.
There have been a few events in the news recently that have prompted thoughts on this topic from several people. The two major ones were Kris Bryant’s demotion by the Cubs, for reasons connected to his arbitration clock rather than his performance, and the comments made by Angels owner Arte Moreno about Josh Hamilton’s drug problem. These are both conflicts between people who are part of the same team, and from a team-oriented viewpoint, should have the same goals but clearly don’t. The question becomes who is “right”, from the viewpoint of the fan. Lots of people have written some excellent things about these conflicts, but my favorite is by Jason Wojciechowski, found here, writing about the paradigm we view these sorts of disagreements from. The whole piece is well worth a read, but the relevant part for this discussion is in the last paragraph:
“A notion of ethics or even morals is something I think we ought to promote in business rather than celebrating the pure concept of moneymaking… We’ve created a political-legal-social scheme that allows firms to exist (thrive!) because we’ve judged the firm a useful construct. Where we go from that starting point… is up to us…. I would like us not to say ‘baseball teams are businesses and so they should be applauded for demoting Kris Bryant’ as our starting point. That’s not our starting point. That’s a moral/ethical choice that has been made from an earlier starting point. Recognition that there are other choices is the first step to reform.”
I don’t think there can be much disagreement with Jason’s point, and I think it’s critical to this discussion. In every aspect of baseball, the viewpoint and goals are decisively pro-team, but that is a starting point. I think it’s time for fans to take a different, pro-player, view as our starting point.
This can be traced back to analytics and the rise of sabermetrics, which have blurred the line between fans and observers of baseball from the outside and professionals from the inside. Anyone who demonstrates their ability to find useful information for a team has the potential to be richly rewarded, and as a result, analytics has one motivating goal in almost every case: to make teams more money. Usually, this takes the form of identifying or measuring undervalued skills and assets, and capitalizing on those market inefficiencies. Under the prevailing framework of baseball analysis, a researcher who identified (for example) the key to Tommy John surgery would be entirely justified in keeping that information private and selling it to a team and making untold sums of money, rather than releasing it to the public and keeping the other 97% healthy as well.
Now, I am not suggesting that someone who made such a major breakthrough should not be rewarded for their work, medical or analytical. Modern baseball analysis is increasingly a business rather than a hobby, and the researcher who identifies the perfect defense-independent pitching metric should be rewarded for the likely massive amounts of work that went into that discovery. But teams are trying to save money for one reason only: to make their owners more money. Every team, from the Red Sox and Yankees to the A’s and Rays, has the ability to spend more and chooses not to. The only “spending limits” they encounter are owner-imposed, and exist for the purposes of profit.
We, meaning fans and hobbyists, are not professional baseball researchers or owners of teams, and as such, are not restricted or motivated by the profit motive. We should feel no such compulsion to orient our passion solely toward teams and their profits.
Despite that, the perspective of the fan tends to always be pro-team, and in many cases, that means it is anti-player. Mike Trout’s contract is “good” because the Angels don’t pay him a lot despite being very good, and Josh Hamilton’s contract is “bad” because the Angels do pay him a lot despite not being very good. Really, therefore, what we mean when we say a contract is good or bad is that it makes or loses an owner money. When the topic of contracts comes up, fans often view them solely as a question of what the team “should” do. This is an example (no offense, T-Sky, you were just the first I saw), where the author writes that “if I were a general manager… I would hand out a lot more contracts like the one the Cleveland Indians just gave Carlos Carrasco.” To be fair, the author also discusses why he feels these deals are good for the player later in the article, so the focus is not just on the team (owner) saving money, but the wording suggests that the player has no agency or control over his own future. While people might not consciously think this, the language used is important, and shows the subconscious assumptions of most fans: contracts are bequeathed by teams to deserving players, as determined by that same team. Now, this obviously isn’t the case in contract negotiations in reality, but it illustrates the viewpoint fans bring – team first, and frequently, team only.
Contract negotiations are not the only aspect of baseball in which this fan viewpoint reigns supreme – on the contrary, this is baked into everything we as fans do. It colors every aspect of the game. As another example, when each year’s Hall of Fame discussions are happening, players are often given accolades for spending their entire career with a single team. There might be valid and legitimate reasons for this – a rapport developed with the fans of that team really is cool, and worth giving someone a bump for – but truly, what is being rewarded is the decision not to test the free-agent market and take the highest contract possible, and instead to reward a team (and an owner) with performance at below-market rates.
Dustin Pedroia, for example, has played with the Red Sox for his entire career, and is currently signed through the 2021 season, after which he will be 38 and either finished or very close to finished playing baseball. He signed his current contract in 2013, but was already extended through 2014 and 2015. The net extension was for 2016 through 2021 (six years) and $89 million dollars, or about $15 million per year. In 2013, Dustin Pedroia had over 5 WAR. At that point in his career, he had averaged 4.7 WAR per 600 PAs. Two years prior, in 2011, he had almost 8 WAR. Had he made his services available to the highest bidder, he would have signed for so, so, so much more than $15 million per year. Instead, he signed with the Red Sox, saving them that large amount of money. Maybe that meant more money was spent on other players, but the Red Sox are one of baseball’s richest teams, and the limits to their spending have always been self-imposed. What that definitely meant was that more money went to the team and its owners.
The standard is to consider Pedroia’s career in a slightly better light because of that. (I don’t mean to point fingers, either – I absolutely am guilty of this.) He sold his services for less than they were worth to a team that could absolutely afford to pay full price, and he’s more likely to make the Hall of Fame because of it. That also means that, implicitly, we’re punishing players that choose to go to the market, and make as much money as they can, which is the last thing I want to do! But when it’s portrayed as rewarding “loyalty”, or whatever other word is used to describe giving money back to team owners, it’s hard not to. This is but one example of the subtle but pervasive pro-team culture that’s endemic in all of baseball fandom.
If this resonates at all with you, I’d encourage you to try to shift your focus as a fan, away from the team and toward the players. There are some trends in baseball that make this more of a legitimate option. Fantasy baseball allows fans to have “their” guys, regardless of what team they’re on. The drive to recognize prospects as early as possible allows fans to keep track of players long before they do anything that impacts a major league team, and hopefully root for them no matter what team they debut with. National media coverage and MLB.tv means you aren’t restricted by geography to what players you follow. Those are steps in the right direction.
If we as fans take a more individual focus, perhaps the conversation will change. Perhaps it will no longer be considered automatically “good” that Bryant has to wait an extra year to sign his first free agent contract, and is more likely to see his career ended by an injury before he ever gets paid, or “bad” that Josh Hamilton capitalized on his excellent performance through age 31. The good/bad labels come from the perspective of the people paying those players, but we as fans are not those people, and we should feel no obligation to take that as our starting point. Root for the players, not the teams.
There were a number of great moments for some of baseball’s biggest stars during the first week of the MLB season. Albert Pujols hit his 521st career home run, which tied him for 18th place on the career list with Hall of Famers Ted Williams, Willie McCovey, and Frank Thomas. Mark Buehrle won his 200th career game and is now tied for 113th on the all-time list with Chuck Finley, George Uhle, and Tim Wakefield (wow, Tim Wakefield won 200 games). Alex Rodriguez hit home run #655 and is just five away from the legendary Willie Mays.
But this isn’t about those guys. Those guys get plenty of notice. This is about the lesser-knowns, the guys you’ve never heard of or had forgotten about. These are my guys. They are the scrubs, the journeymen, the players who refuse to hang up their spikes . . . the grinders.
San Francisco Giants pitcher Matt Cain’s arm injury opened the door for Chris Heston to get the second start of his major league career. Heston is 27 and debuted with the Giants just last season, so he’s not really a prospect, if he ever was one. He played college baseball at Seminole Community College in Florida and was drafted in the 47th round of the 2007 Major League Draft. He did not sign. When you’re drafted in the 47th round, it’s like the team is telling you, “Hey, we need someone to carry the bats from the clubhouse to the dugout for one of our minor league teams and you look like you might be able to handle that job.” Heston went back to school for another year, then was drafted in the 29th round by the Washington Nationals the following year. When you’re drafted in the 29th round, it’s like the team is telling you, “Hey, we need someone to take up space on one of our minor league rosters so the real prospects can have someone to play against.” Heston chose to go back to school, this time to East Carolina University, and ended up being drafted again, this time in the 12th round. He signed with the Giants and pitched in their minor league system for five years before getting into three games during last year’s Championship run. He pitched a grand total of 5 1/3 innings as part of the team that won the World Series so he has a ring on his finger. No matter what he does for the rest of his major league career, Chris Heston has a World Series ring. In his start on Wednesday, Heston pitched six scoreless innings for his first major league victory.
A guy I hadn’t thought of in a few years, and didn’t know was still playing baseball, had a big hit on Wednesday. This player got off to a great start to his major league career, hitting .300/.336/.549 in 70 games in his rookie year of 2005 and was featured on the cover of Sports Illustrated with the caption: “The Natural”. “The Natural” tanked the following year (.260/.293/.449) but rebounded for a 3.3 WAR season in 2007 (.293/.338/.444). Since 2008, he’s had one above average season, two seasons close to replacement level, and four seasons below replacement level. If you haven’t guessed by now, this player is Jeff Francoeur. Jeff Francoeur is a survivor. Just when you think you’ll never hear another thing about Jeff Francoeur, he shows up once again. After hitting .235/.287/.378 in 2012, you might have thought his career would be over. Then when he hit .204/.238/.298 in 2013, it wouldn’t have been a stretch to say a fork was sticking out of his back because surely he was done. And certainly after he had 2 hits in 24 at-bats last year, you would think it was time for him to ride off into the sunset. But he didn’t ride off into the sunset. He signed with baseball’s most pathetic team, the Philadelphia Phillies. On Wednesday, he came to the dish in a scoreless game in the bottom of the sixth and hit a 3-run jack to help the Phillies beat the Red Sox. The only possible conclusion is that Jeff Francoeur is a zombie.
In Cincinnati, the Pittsburgh Pirates and Cincinnati Reds played a closely fought ballgame that went to extra innings. The Pirates brought in Radhames Liz to pitch the bottom of the 11th. Liz had been signed as an amateur free agent by the Orioles in 2003 and played three seasons with the O’s from 2007 to 2009 but had major control problems as he walked 6.2 batters per nine innings. He spent the 2009 season in the Padres’ minor league system then pitched in Korea for three years before returning to the states and signed a minor league contract with the Blue Jays before the 2014 season. He pitched at two levels in 2014, then signed a one-year deal with the Pirates. His appearance in the bottom of the 11th inning on Wednesday was his first major league action since 2009. Unfortunately, it did not go well. He started off the inning by getting Brandon Phillips to pop out. He then plunked Zack Cozart. In 2014, Zack Cozart was the worst hitter in all of baseball who had enough plate appearances to qualify for the batting title when he hit .221/.268/.300 (56 wRC+). The last person you’d ever want to hit with a pitch is Zack Cozart, but that’s just what Radhames Liz did. He regained his composure to strike out Matt Dominguez. Of course, Matt Dominguez was the second-worst hitter in all of baseball last year (63 wRC+). It’s kind of amazing that the two worst hitters in baseball last year were batting back-to-back in this situation, but life has those little amazing things happen every now and then. Still, there were two outs and a runner on first and Billy Hamilton was coming to the plate. Billy Hamilton, by the way, was the 13th-worst hitter in all of baseball last year out of the 146 hitters who qualified for the batting title (79 wRC+). Surely, Radhames Liz could get Billy Hamilton out and send this game to the 12th inning, right? No, not right. Not right at all. Radhames Liz walked Billy Hamilton. This is not a particularly easy thing to do because Billy Hamilton does not walk very often (5.7% of the time in his career). Walking Billy Hamilton meant there were now runners on first-and-second and Radhames Liz would have to face Joey Votto, the best hitter on the Reds. Joey Votto singled to right, Zack Cozart scored, and Radhames Liz had single-armedly lost the game for the Pittsburgh Pirates in his first major league action in six years.
On Friday, Jerome Williams started for the Philadelphia Phillies against the Washington Nationals. Williams is on the seventh major league team of his career, including three just last season. His best year was his rookie year back in 2003 with the San Francisco Giants when he was worth 2.0 WAR. He hasn’t come close to that performance since. In 2008, he played for the Long Beach Armada of the independent Golden Baseball League (other GBL alums include Mark Prior, Jose Canseco, and Rickey Henderson). In 2010, he played for the Uni-President Lions of Taiwan in the Chinese Professional Baseball League. He was with the Los Angeles Angels from 2011 to 2013 and spent the 2014 season with the Astros, Rangers, and Phillies. In his nine major league seasons, he’s had an ERA under 4.00 just two times. He’s still kicking around, though, and pitched 6 innings while allowing just a single run on five hits in his first start this year.
The Tampa Bay Rays are without three-fifths of their projected starting rotation, so they got creative on Friday and started Steven Geltz. Geltz signed with the Los Angeles Angels as an undrafted free agent in 2008 out of the University of Buffalo. It’s highly unlikely for an undrafted free agent to ever making the major leagues. In addition, Geltz is listed as 5’10”, 170 pounds and he’s a right-handed pitcher. Short, right-handed pitchers are a rare breed in major league baseball. Scouts are generally looking for size and projectability when scouting pitchers and this is even more true for right-handed pitchers. It’s easier to be short and slight if you’re a left-handed pitcher slinging breaking balls than if you’re a righty. Geltz doesn’t have a great fastball (averages around 92 mph) but he’s been quite good in 7 seasons in the minor leagues, with a career 3.38 ERA and 1.10 WHIP in 362 minor league innings, while striking out 12 batters per nine innings. He got a cup of coffee with the Angels in 2012 and a Mocha Grande with the Rays last year and has pitched in 15 major league games with a 2.84 ERA, 1.34 WHIP, and 13.5 K/9. All of his previous professional appearances have been as a reliever and he has never faced more than 10 batters in an outing before. So, there he was on the mound to start Friday night’s game against the Marlins. He went two innings, throwing 35 pitches, 25 for strikes, and allowed one run. Not bad. There’s a pretty good chance that this will be the only start of his major league career.
Finally, we have the journiest-journeyman of all the journeymen, Buddy Carlyle:
New York Mets’ reliever Buddy Carlyle was originally drafted by the Cincinnati Reds out of a Nebraska high school in the second round of the 1996 MLB Draft. Then this happened:
1996: Pitched for the Princeton Reds in the Appalachian League
1997: Pitched for the Charleston AlleyCats in the South Atlantic League
April 8, 1998: Traded to the San Diego Padres for Marc Kroon.
1998: Pitched for the Chattanooga Lookouts and the Mobile BayBears in the Southern League
1999: Pitched for the Las Vegas Stars in the Pacific Coast League
Made his major league debut on August 29, 1999 with the San Diego Padres.
2000: Pitched for the Las Vegas Stars and the San Diego Padres
November 3, 2000: Contract was sold to the Hanshin Tigers of Japan’s Nippon Professional Baseball League.
2001 and 2002: Pitched for the Hanshin Tigers
December 18, 2002: Signed as a free agent by the Kansas City Royals
2003: Pitched for the Wichita Wranglers of the Texas League and the Omaha Royals of the Pacific Coast League
October 15, 2003: Granted free agency
December 23, 2003: Signed as a free agent with the New York Yankees
2004: Pitched for the Trenton Thunder of the Eastern League and the Columbus Clippers of the International League
October 14, 2004: Granted free agency
November 18, 2004: Signed as a free agent by the Los Angeles Dodgers.
2005: Pitched for the Los Angeles Dodgers and the Las Vegas 51s of the Pacific Coast League.
December 15, 2005: Signed by the Florida Marlins.
2006: Pitched for the Albuquerque Isotopes of the Pacific Coast League
May 18, 2006: Sold to the LG Twins of the Korean Baseball Association
December 4, 2006: Invited to spring training by the Atlanta Braves
2007: Pitched for the Richmond Braves of the International League and the Atlanta Braves
2008: Pitched for the Richmond Braves and Atlanta Braves
2009: Pitched for the Atlanta Braves, the Rome Braves of the South Atlantic League, and Gwinnett Braves of the International League
October 9, 2009: Granted free agency
2010: Returned to Japan to pitch for the Hokkaido Nippon-Ham Fighters of the Nippon Professional Baseball League.
December 2, 2010: Signed a minor league contract with an invitation to spring training with the New York Yankees.
2011: Pitched for the New York Yankees, the Scranton/Wilkes-Barre Yankees of the International League, and the Toros del Este of the Dominican Winter League
January 30, 2012: Signed a minor league contract with the Atlanta Braves
2012: Pitched for the Gwinnett Braves of the International League
November 3, 2012: Granted free agency
December 11, 2012: Signed a minor league contract with the Toronto Blue Jays.
2013: Pitched for the Buffalo Bison of the International League
November 5, 2013: Granted free agency
February 18, 2014: Signed a minor league contract with the New York Mets
2014: Pitched for the Las Vegas 51s of the Pacific Coast League and the New York Mets
November 4, 2014: Granted free agency
January 5, 2015: Signed as a free agent with the New York Mets
By my count, this is Buddy Carlyle’s 20th year in professional baseball but only the eighth year in which he pitched in the major leagues. He’s played on 26 teams for 14 different organizations in four different countries. He’s been a Red, an AlleyCat, a Lookout, a BayBear, a Star, a Padre, a Tiger, a Wrangler, a Royal, a Thunder, a Clipper, a Dodger, a 51, an Isotope, a Twin, a Brave, a Ham Fighter, a Yankee, a Toro, a Bison, and a Met.
Before last season, Carlyle had pitched 284.3 major league innings with a 5.13 ERA and 1.39 WHIP, while striking out 7.2 batters per nine and walking 3.4. Last year, at the age of 36, Carlyle found major league success by posting a 1.45 ERA, 0.90 WHIP, 8.1 K/9, and 1.5 BB/9.
On Opening Day this year, the Mets were holding a 3-1 lead heading into the ninth but their closer, Jenrry Mejia, was injured with a sore elbow. Jerry Blevins got the first out of the inning, then Buddy Carlyle came in to get Ryan Zimmerman and Wilson Ramos for his first major league save. He was immediately added to nearly 2,000 fantasy baseball teams on Yahoo by ever-watchful saves scavengers. More importantly, it was a great moment for a guy who just kept plugging away at it all these years. Hat tip, Buddy Carlyle.
Being a sports fan is hard. On average, a major league team’s chance to win the World Series in a given year is 3.3 percent. I promise the math works out. Some teams, particularly larger-market teams, may have a greater chance, but for fans of any team you are more likely to end the season sad than happy. However, in April there is hope for every team. This is an old baseball cliché, but it is also generally true!
If you look at FanGraphs’ playoff odds, every team has a chance to make it at least to the wild-card game. Even the Phillies! So the cliché is grounded in a bit of reality, as clichés usually are. On the other hand, two teams are listed as having 0.0 percent chance of winning the World Series. Those darn Phillies and the Atlanta Braves.
Let’s talk about those Braves and their chances at fortune. For purposes of this exercise, we are going to assume that the playoff odds are correct up until the playoffs actually occur. Maybe you think the Braves 3.2 percent chance of making the playoffs is pessimistic. After starting 3-0, it has jumped from 3.1 percent, so that’s something! Maybe you think that is too low (or too high), but that doesn’t matter, this exercise could be done using many bad teams. The Braves have a 3.2 percent chance of making the playoffs but a 0.0 percent chance of winning the World Series. This is very unlikely to be true.
I don’t have the statistical skills to delve into the projection models, but I believe there is a fundamental flaw that essentially double dips on poorly projected teams. The playoff odds beyond simply making the playoffs are calculated assuming each team is as good or as bad as projected. The problem with this method is that it doesn’t comport with reality. If the Braves (or the Phillies, Diamondbacks, Rockies, Brewers, Twins or Rangers) make the playoffs, it will be at least partially due to them being a much better team than the projections thought they were. Of course, the projections know that this is possible, hence the slim odds instead of no odds of making the playoffs.
For purposes of this chart, I’m going to make generous assumptions on the decimal points that we cannot see. These assumptions work against my conclusion and I believe my conclusion still holds. For percentages that are listed as 0.0, I’m going to assume 0.05. * For 0.1, I’m going to assume 0.15. And so on. These odds all come from FanGraphs projections as of Friday, April 10, 2015.
Below is a list of teams with less than a 10-percent chance of making the playoffs. Assuming they make the playoffs, based on these conservative assumptions, the odds of these teams winning the World Series are:
Team1 in…
Phillies 24
Rangers 16
Twins 16
Diamondbacks 19
Braves 64
White Sox 18
Reds 30
Brewers 36
Rockies 39
The three teams in the AL actually don’t look that bad. I’d say they are perhaps a little too pessimistic, but not drastically so. In the NL, the Braves are the worst example, but the Reds, Brewers, and Rockies are all clearly unrealistic considering what we know about the playoffs (that it is something, perhaps a big something, of a crapshoot). My guess is that this could be fixed by regressing the odds of each team heavily towards a typical playoff team to account for the fact that poorly projected teams that make the playoffs are likely way towards the top end of their possible outcomes. If the Braves make the playoffs, it will be largely because they are good, and probably also because they got a decent amount of luck. I’m not saying they’d be 8-1 (as a division winner) or 16-1 (as a wild card team), which is what their odds would be based on coin flips. But there is no way the Imaginary Good Braves would go into the playoffs as 64-1 longshots to win the World Series. You don’t need a calculator or anything other than common sense to know this. And remember, I used very conservative assumptions. It is likely that if I had access to more significant digits, some of these numbers would look much worse.
*The Phillies listed odds of making the NLCS are 0.0 percent. Based on this, I halved the odds for winning the NLCS and then halved them again for winning the World Series. Thus, I conservatively estimated that the FanGraphs odds for the Phillies winning the World Series are 0.0125 percent. Thanks again, Phillies, for making things harder.


