Kevin Gausman and the Elevated Fastball
Orioles fans have been pining for Kevin Gausman ever since 2015 Opening Day at Camden Yards when Bud Norris got shelled by the Blue Jays. The now-24-year-old started in 20 games last season as he was yanked back and forth between the majors and minors and posted a 107 ERA+ in 2014. A good number — not excellent, but good. He stabilized the rotation after Ubaldo Jimenez struggled mightily in his first year as an Oriole. In 2015, he will be asked to do the same as Norris has scuffled in the rotation so far. Two starts in, the results are promising, even better than 2014. One key change so far for Gausman is his willingness and ability to elevate his plus fastball.
The community’s own Jeff Sullivan has written about this as well. Both, before the season and after Gausman’s first couple of relief appearances in 2015. The idea being that some teams have emphasized throwing high fastballs and that not every pitcher is equipped to do so. But, Gausman has a heavy fastball that could stand to work more up in the zone; in fact in 2014 he was at the bottom of the league only throwing that pitch in the upper half 33% of the time. Jeff Sullivan also noted astutely that Gausman and the Orioles have talked about him throwing up more and that he had been doing so coming out of the bullpen.
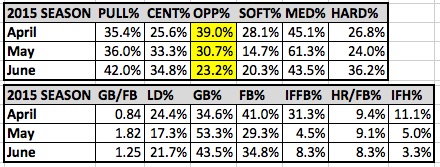
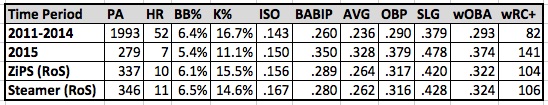
Well, after two starts, Gausman continues to work up in the zone with the fastball and he is getting some great results. In 2015 his strikeout rate is up from 18.5 percent to 21.7 percent while his walk rate is around the same. His hard contact rate is down from 28.7 percent to 26.9 percent and his soft contact rate is up from 17.2 percent to 25.4 percent. Meanwhile, his fly-ball and groundball rates are up as well while his line-drive rate is at only 10.4 percent. This helps to explain how he has only given up eight hits in his last 11.1 innings pitched.
First, below is a graph of the average vertical location of Gausman’s fastballs over the past three seasons. 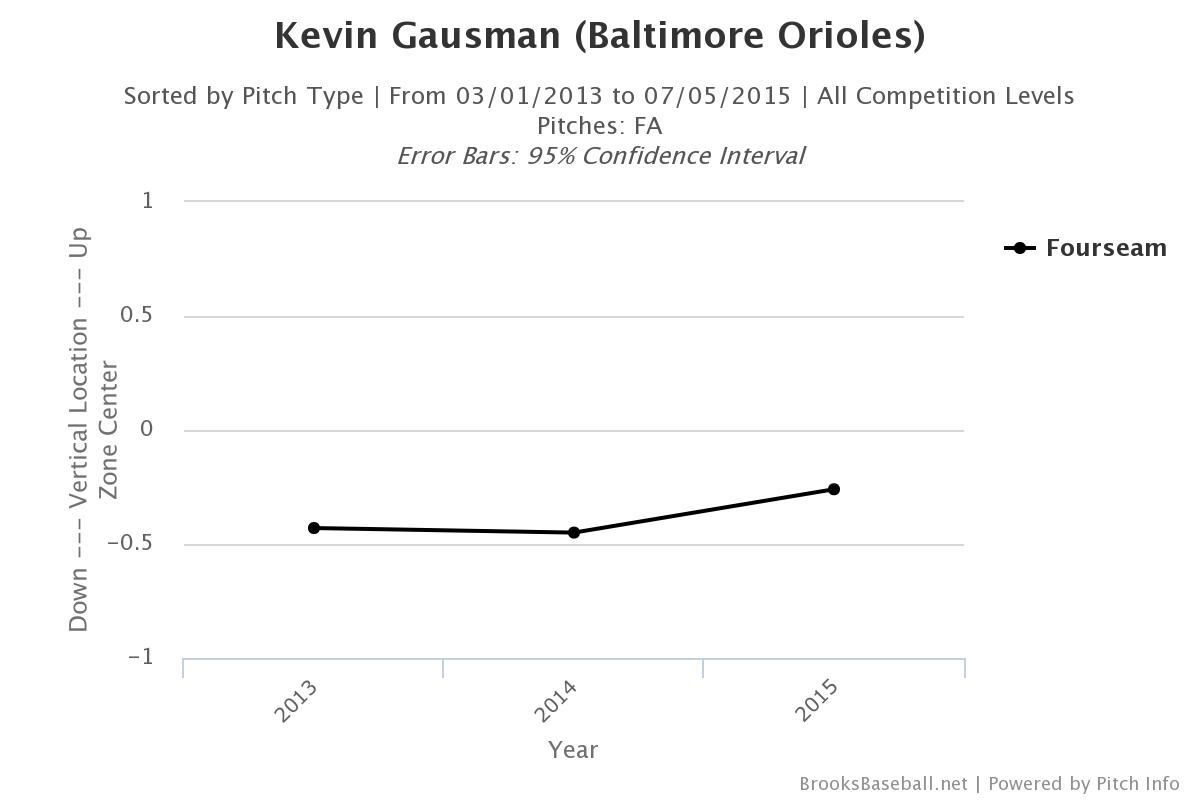
As you can see, Gausman has worked more up in the zone. Not by a lot, but enough to call it a trend so far this year. Working mostly down is always going to be more friendly for a pitcher, but the ability to throw high strikes and for the batter to know that you can, is a very effective weapon. For instance, below is a chart of the whiffs Gausman has gotten from batters so far in 2015.
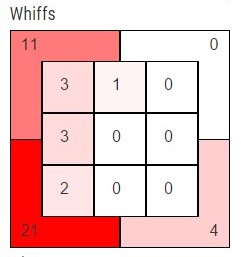
Notice the upper left portion of the zone. Gausman so far has gotten 11 swings and misses in this area in 2015; he had 29 whiffs all of last year in the same area. Every one of those 11 whiffs in 2015 has come on a four-seam fastball. Again, the bread and butter for Gausman will be dotting his fastball on the outside corner and working his splitter away, but the added weapon of a high fastball has produced some great in game results thus far in 2015.
I paid close attention to the game against the Rangers on July 2nd, in which Gausman pitched 6.1 innings striking out 7 walking 2 and allowing only 4 hits. Gausman utilized his fastball in this upper area of the zone to great effect during this start. Below is the strike-zone plot for Gausman from this game. 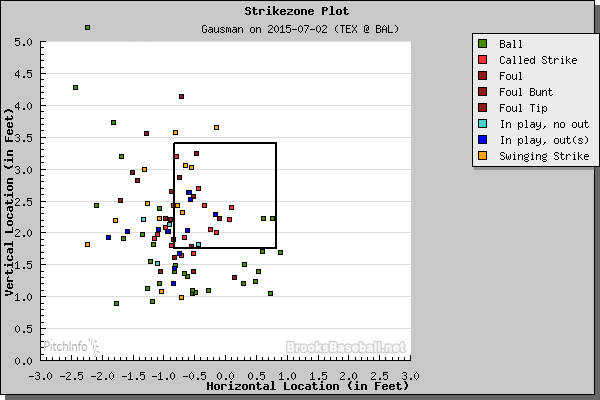
Here you can see Gausman was able to work mostly arm-side low, but he also worked up in the zone and got five swinging strikes on balls at or above three feet off the ground. I also wanted to point out some specific at bats from that game. Below is the strike-zone plot against Robinson Chirinos in the third inning. 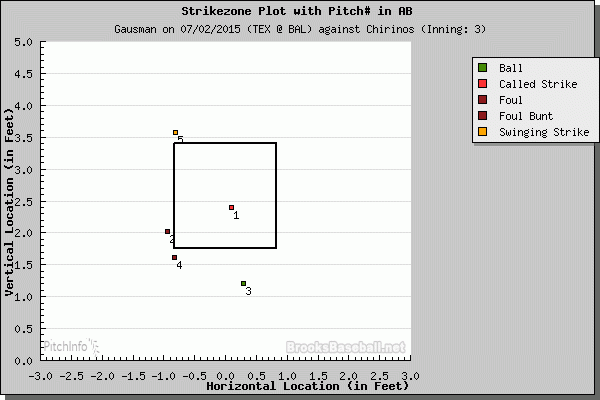
Gausman starts him out with a pretty bad fastball that Chirinos simply swings through, although to be fair it was 97 mph. He then throws two more low fastballs and get Chirinos to foul off the second one. Now with the count 2-1 Gausman throws his splitter which Chirinos is again able to foul off. Now, the key pitch in the at bat, Gausman climbs the ladder for the fifth and final pitch with another 97 mph fastball to get the swinging strikeout. Here is another at-bat where Gausman used the elevated fastball, this one is to Adrian Beltre in the fourth inning. 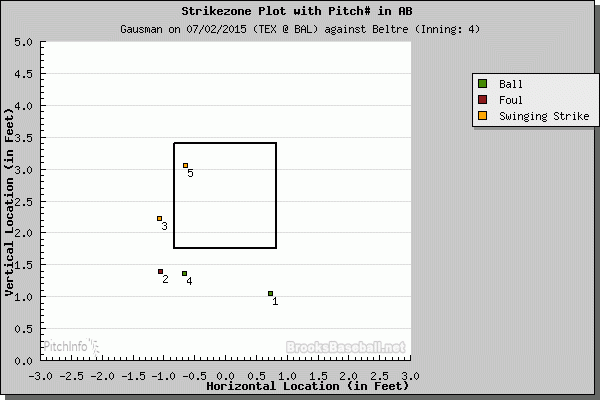
This at-bat is again five pitches. Gausman first throws a fastball low and away for a ball. Then, Beltre fouls off an inside and low fastball. Gausman then throws the splitter inside for a swinging strike and follows that up with a low and inside fastball for a ball. Now with the count 2-2 and every pitch in the lower half or below the strike zone so far in the at bat, Gausman elevates a 97 mph fastball high and tight to Beltre who swings through to get another strikeout for Gausman. All right, last one, I swear.
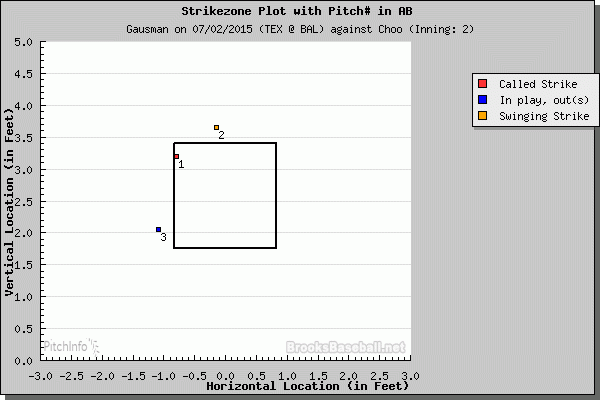
This at-bat is against Shin-Soo Choo in the second inning. Gausman starts him off with one called strike fastball up and away at 96 mph and follows that up with another elevated fastball at 97 mph that Choo swings and misses on. So now Choo has seen two high 90s fastballs three feet off the ground. Next, Gausman drops an 88 mph splitter a foot lower and Choo rolled over on it to second base. Not only can the elevated fastball get strikeouts, it can also setup his other pitches.
Here are the video highlights for that Rangers game where you can see the end of the two strikeouts above. Also, here are the video highlights of his start in Toronto wherein he gets two infield flies and a strikeout on elevated fastballs. Watch both for some more context.
The Orioles are now looking for Gausman to become a rotation stabilizer. Gausman has struggled somewhat in his career thus far because of a lack of true third pitch; he has gone back to his curveball this year which has shown some early promise. However, he has also struggled because for the most part he worked everything down in the zone. With the added focus of throwing elevated fastballs in 2015 it changes the hitter’s eye level and lets them know that Gausman can throw to all parts of the zone, so all parts of the zone are in play. So far, in 2015 that pitch has achieved great results. Now, we’ll have to see if Kevin Gausman can keep replicating those results.
The original version of this article was posted on www.camdenchat.com on 7/6/2015


