Dominant Players (a la XKCD)
With apologies to Randall Munroe:
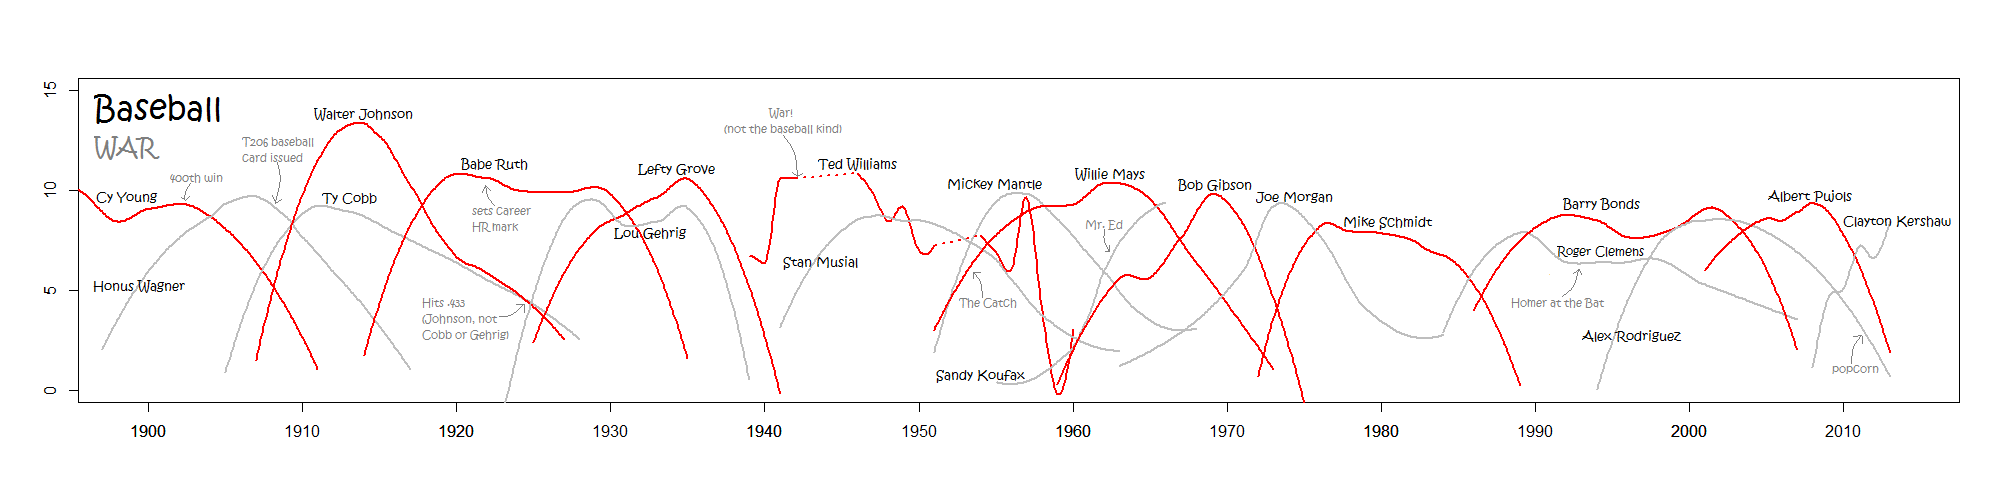
Click to embiggen
If you’d like to make your own graph like this one, I’ve pasted the R code I used here.
With apologies to Randall Munroe:
Click to embiggen
If you’d like to make your own graph like this one, I’ve pasted the R code I used here.
In the 2013 offseason, the Cubs did something smart. They signed RHP Scott Feldman. Feldman had a rough 2012 season in Texas, posting an ERA of 5.09. However, his peripherals indicated that he was fairly unlucky during that season, leading him to be vastly undervalued. FanGraphs’ own Dave Cameron opined that Scott Feldman was the poor man’s Brandon McCarthy. Feldman was a nice, cheap addition for one year, $6 million.
The Cubs’ strategy of betting on FIP and xFIP seemed to pay off as Feldman quickly became an asset by the time the trade deadline rolled around. In a move that flew under the radar, the Cubs traded Feldman for Steve Clevenger, Pedro Stroop, international bonus slots, and a struggling Jake Arrieta.
It hasn’t taken the Cubs long to see the fruits of their return as Jake Arrieta has become a bright spot on an otherwise struggling Cubs team. In 64 innings, he has compiled a 2.4 WAR and an ERA/FIP/xFIP line of 1.81/1.97/2.50.
Arrieta has been downright filthy for the Cubs in the 64 innings that he has pitched this season. While this is a small sample, it’s indicative that there has been a change in Arrieta’s approach to pitching that is proving to be successful.
While the acquisition of Arrieta didn’t make headlines last year, the Cubs have definitely made headlines over when they completed potentially the largest blockbuster trade of the season, sending pitcher Jeff Samardzija and Jason Hammel to the Oakland Athletics in return for Addison Russell, Billy McKinney, Dan Straily and a PTBNL.
While Russell and Samardzija are the main components of the trade, there is something interesting about the other acquisitions. If you break the trade into two parts, there’s McKinney and Russell for Samardzija, and then there’s Straily and a PTBNL for Hammel.
It looks as though the Cubs are hoping that history can repeat itself.
The Cubs signed Hammel — for not a lot of money — hoping that he would perform well, and that he could be used as ‘trade bait’ midway through the season. Hammel exceeded expectations during his time with the Cubs, and now he is netting another reclamation project for the Cubs. Sounds an awful lot like the Feldman trade the Cubs made a year ago.
Straily has struggled this year, posting an ERA/FIP/xFIP line of 4.93/5.64/4.43. This is a small sample size of only seven starts, however the projection systems don’t rate him too favorably for the rest of the year. ZiPs projects Straily to have an ERA of 4.44 and FIP of 4.80 by the end of this year. Steamer projects Straily to have an ERA of 4.45 and FIP of 4.93.
Straily has been getting a decent number of strikeouts, however the root of his struggles have been keeping the ball in the park (16.4% HR/FB), and keeping his walks down. It’s reasonable to think that Straily’s HR/FB will come down given that this is a small sample size, and he’s not nearly this bad at keeping the ball in the park; regression to the mean is expected.
Unlike Arrieta, Straily doesn’t necessarily have the blazing raw stuff. Arrieta flashed a 94 MPH fastball even through his struggles with the Orioles. You could definitely see some raw talent. Straily is in the midst of a velocity decline in which his fastball has declined from 90 MPH in 2013 to 88 MPH this year, and he has lost at least a mile and a half on each of his other pitches. However, Straily does appear to have a good slider and decent changeup which — combined with regression back to the mean — is a good enough reason for the Cubs to think that there is some talent that can be unlocked.
It’s unlikely that the Cubs will be able to turn Straily into a potential ace, however it’s hard to bet against their track record. They have managed to turn Feldman, Hammel, and Arrieta into something. The have proved that they are good at scouting as they boast arguably the best farm system in the league. Maybe they see something in Straily with which they think that they can work, and realize that he might be good to buy low and hope that he turns into an asset. The Cubs trust their ability to turn pitchers that are nothing into something. While Russell, Samardzija, and Hammel may be grabbing all the headlines, it might just be Straily that surprises us in a year or two.
This article originally appeared on my blog “Biotech, Baseball, Big Data, Business, Biology…”
It’s Fourth of July weekend in Seattle as I write this. Which means it’s overcast. This was predictable, just as it’s predictable that for the two months after July 4th the Pacific Northwest will be beautiful, sunny and warm. Mostly.
Too bad forecasting so many other things–baseball, earthquakes, health outcomes–isn’t nearly as easy. But that doesn’t mean people have given up. There’s a lot to be gained from better forecasting, even if the improvement is just by a little bit.
And so I was eager to see the results from a recent research competition in health forecasting. The challenge, which was organized as a crowdsourcing competition, was to find a classifier for whether and how rheumatoid arthritis (RA) patients will respond to a specific drug treatment. The winning methods are able to predict drug response to a degree significantly better than chance, which is a nice advance over previous research.
And imagine my surprise when I saw that the winning entries also have an algorithmic relationship to tools that have been used for forecasting baseball performance for years.
The best predictor was a first cousin of PECOTA. Read the rest of this entry »
I found Jeff’s recent post on Jake Arrieta fascinating, because he goes into a game and pulls out Arrieta’s eight worst pitches from that game. This is something I’d never really thought deeply about before. We all know what bad pitches look like, right? An 0-2 fastball down the heart of the plate, a hanging slider, a pitch in the dirt on a full count, sure. But can we quantify this? Is there a way to say mathematically (in a way that makes some sort of sense) whether one pitch was better than another? Follow me beyond the jump and I’ll share some thoughts about how we might do this.
Read the rest of this entry »
In early May I introduced Ottoneu players to the Advanced Standings Dashboard, a tool that allows team owners to decipher the early season standings in an effort to better gauge where their team might be headed as the 2014 season comes together. You can download that tool here (http://goo.gl/pbXI5), but now that we’ve just entered July, the traditional halfway point of the baseball season, it’s time to take a deeper look at a few ways this tool can be used to effectively to manage your team into contention in the second half.
Since the tool can be updated easily with just a couple of copy/paste actions, I use this tool almost daily in my own FGPoints Ottoneu league. But for fun, let’s walk through a few features as they apply to the FanGraphs Staff League, with a special focus on Eno Sarris’ team, “It’s A Perm“.
Eno enters July as a 3rd place team, nearly 400 points out of 1st place, and 150 out of 2nd. In general, with at least seven teams over the 8,000 point mark, this league looks competitive at a glance. But with the recent pickup of Ryan Braun, Eno clearly has his sights set on a title (https://twitter.com/enosarris/status/483016142831644672), so let’s break down the standings using the tool to see if Eno has the momentum to win it all in the 2nd half.
The first tab of the tool is simply the statistical breakdown of the Ottoneu standings into some common sabermetric calculations. While we can easily see Eno leads the league offensively at 5.44 P/G, the underlying statistics also support it, showing he maintains an (slight) advantage in OPS, OPS+, wOBA, Runs Created, and Total Bases. What may be more interesting is that Eno has more points scored from his offense than any other team in the league. In fact, just over 58% of his points have come from his hitters (tab 3, ‘Projected Finish”). With roughly 55% of league scoring in Ottoneu coming from offense, Eno is clearly banking on this approach of shoring up the side of the ledger that carries the most weight. The acquisition of Braun will only help.
So It’s A Perm is built on bats, but what about the pitching? Unfortunately, this is a weak spot, as Eno’s FIP, WHIP, and BB/9 are all higher than the two teams he’s chasing. I’m sure he knows this instinctively as his 5.03 P/IP is below the league average of 5.13 P/IP (and further below the top 7 teams of 5.19 P/IP), but the dashboard makes it quicker and easier to point out these pitching deficiencies. One possible area of improvement: the bullpen. Without looking at his roster, I can tell you pretty quickly he’s probably pretty frustrated with his bullpen, which has been almost 42% less effective (“PEN” = Saves + Holds/IP) than the league leader, A Little Out of Context. Shoring up a bullpen is often easier and cheaper than finding an ace SP mid season, so does Eno speculate on the eventual Sergio Romo replacement? Does he approach John Heyman’s Last Sirloin about shedding some of his bullpen pieces in a plea to “deal from strength”?
Once you’ve taken the time to digest some of the traditional sabermetric outputs in the Dashboard, your eyes will naturally gravitate toward the end of the first tab into the “League Projections” section, which is where the real power of the tool comes alive. The key takeaways here are the “Otto” score and the “Pace” columns. The Otto score can be better explained here by Chad Young (http://goo.gl/KK4Xy), while the “Pace” attempts to project the season-ending point totals for each team based up a range of factors, including current P/G and P/IP values, remaining IP and GP, and league averages in these areas. In many leagues these are the columns that can better identify contenders from pretenders, but for the FanGraphs Staff league we see more evidence that the actual standings are, for the most part, very accurate, as Eno is also projected to end the season with the 3rd most points (18,042, or about 400 points out of 1st place).
There are a few interesting things to note here, however. First, John Heyman’s Last Sirloin actually has the third highest Otto score (13.66), but is still projected for 4th place, most likely due to his slower pace in IP (1,416 projected). If this team can pick up the IP pace in the 2nd half with similar quality IP (5.54 P/IP), this team could make up ground quickly. This team is clearly riding a league-best bullpen and trying to maximize its RP innings as much as possible.
Second, Ground Rule Double Helmet, despite sitting in 4th place with a strong 9,000 points, has had to overtax a very week pitching staff (4.74 P/IP) just to get there (1,577 IP projected). The tool sees as much and projects this team to end the season in 5th place, but unless the pitching staff sees a significant improvement in the 2nd half, I’d expect this team to possibly fall even further as the season shakes out.
And that’s just the first tab…Once you get familiar with the tool, you’ll actually find the third tab, “Projected Finish” to be the most useful summary of some of these features described above, as it will give you a daily update of the projected champion for the league. With Eno just 400 points out of both the actual and projected season-ending standings, this league is just too close to call on July 1st, but there are at least four clear contenders here, and It’s A Perm is one of them. Will Ryan Braun help the cause? Just for fun, let’s say Braun increases Eno’s offense by just 2.00% (from 5.44 to 5.55). Well, that could be all it takes, as that small increase moves the needle for It’s A Perm enough to overtake Johan Santa Claus by 100 points in the projected season-ending standings, and less than 200 points out from 1st place. Of course, that’s if everything else stays the same, and, as in life, the only thing constant in baseball is change. This will be a fun league to watch as the summer heats up, so enjoy the tool and use it where possible to get that 2% edge.
Anytime a sports piece starts making claims that so and so is the best player ever, it’s best to check assumptions being made. And the sooner those assumptions are made, the better. So let’s get the big assumption out of the way early.
Felix now has a legitimate claim to being the best Mariner pitcher ever. Considering that he has 8 full seasons under his belt and 2 half seasons, all the while sitting atop the Mariner rotation, this claim hardly seems surprising, but for one thing…
Randy Johnson pitched 8 full seasons and 2 half seasons for the Mariners, too.
And for anyone following baseball during the 1990’s, it’s hard to believe any pitcher could usurp the title of best ever from the Big Unit, whose left arm terrified hitters, as a Mariner, from 1989 to 1998. Nevertheless, here we are:
| Seasons | IP | FIP | K/9 | BB/9 | HR/9 | WAR | |
| Randy Johnson | 1989-1998 | 1838 | 3.34 | 10.6 | 4.3 | 0.8 | 45 |
| Felix Hernandez | 2005-2014 | 1931 | 3.16 | 8.5 | 2.5 | 0.7 | 45 |
Johnson has very few peers, through history, in his ability to strike out hitters. But it’s clear that Felix is proportionally better than the Unit in his ability to limit base on balls. Felix’s superior FIP is mostly a function of playing his home games at Safeco while Johnson had to pitch in the hitter friendly Kingdome. As WAR is park-adjusted, we can see that Felix has come to match Johnson’s 45 WAR accumulation, as of this date. From this point on in Felix’s career, his WAR total will likely increase beyond Randy’s static Mariner total of 45, and probably rapidly so.
One could take the position that Randy’s playoff totals in 1995 and 1997 still keep him ahead of Felix. But that would be crediting Randy’s better supporting cast for having gotten him to that position in the first place. Hardly an individual achievement.
The amazing thing about Felix is he’s putting up performances that are the best of his career. Felix came into his own by winning the Cy Young Award in 2010. He followed up that season in 2011 by essentially matching those award winning stats. His encore has been to better the stats in each successive year, to where he’s matching his best K-rate and beating his best BB-rate, ever, in 2014.
| Years | IP | FIP | K/9 | BB/9 | HR/9 | |
| Felix Hernandez | 2010 | 249.2 | 3.04 | 8.36 | 2.52 | 0.61 |
| 2011 | 233.2 | 3.13 | 8.55 | 2.58 | 0.73 | |
| 2012 | 232 | 2.84 | 8.65 | 2.17 | 0.54 | |
| 2013 | 204.1 | 2.61 | 9.51 | 2.03 | 0.66 | |
| 2014 | 106.1 | 1.96 | 9.48 | 1.61 | 0.25 |
And in case you were wondering, here’s where Felix ranks for pitchers between the ages of 16 and 28, over the last 50 years:
| Player | FIP | WAR |
| Bert Blyleven | 2.80 | 63.3 |
| Roger Clemens | 2.68 | 56.0 |
| Pedro Martinez | 2.81 | 50.6 |
| Dwight Gooden | 2.73 | 50.6 |
| Tom Seaver | 2.58 | 48.6 |
| Felix Hernandez | 3.16 | 45.1 |
| Fergie Jenkins | 2.77 | 44.1 |
| Greg Maddux | 3.13 | 42.8 |
| CC Sabathia | 3.59 | 42.7 |
| Sam McDowell | 2.89 | 42.3 |
And by the way, if you’re curious who Felix will need to measure up to for the rest of his career, from his age 29 season onward; well, there’s really only one name: Randy Johnson, who accumulated 101.2 WAR, from the age of 29 to 45.
As a long-time Mariners fan, I never thought I’d see the likes of Randy Johnson, ever again.
Then came the King.
This title is slightly misleading, and may be best put as “What is Not Quite Right with Trevor Rosenthal?” His ERA is below 4.00 and his FIP is much better than his ERA, thanks in large part to his high strikeout rate and low home run rate. Yet, Rosenthal is not dominating in the same way that he did last year when he struck out 108 batters in 75 1/3 innings and compiled a miniscule 1.91 FIP. So, what is different about Rosenthal that has led to a 1.36 increase in ERA and .83 spike in FIP? As I said, Rosenthal is in the midst of a very respectable season, by many metrics, but he is not supposed to be “just” respectable. Rosenthal should be able to dominate the league, just as he did last year when he ranked 5th among relievers in FIP and WAR. Naturally, I turned to the numbers to determine what is holding Rosenthal back from being one of the best closers in the league.
With such a significant jump in his ERA, I expected to see that Rosenthal was being hit much harder, but that is not what I found. Not only is his opponents’ SLG% down, but so is his opponents’ AVG. So, Rosenthal is allowing fewer hits compared to last year and also fewer extra base hits, which certainly seems like a great formula for success. However, based on the type of contact Rosenthal is letting up this year, I would expect to see the opposite trend. For the second straight season, Rosenthal’s GB% has decreased, and this year, his Line Drive % (LD%) ballooned 10% up to 30%. Despite allowing more hard contact, Rosenthal has decreased his BABIP, which suggests he has actually been lucky to this point in the season. Rosenthal has also done a nice job limiting home runs, even while allowing more balls to be put in the air. His GB/FB ratio has dropped all the way to .85 from 1.23 just a year ago. Fortunately, he has still managed to drop his HR/9 to 0.3 thanks to a miniscule HR/FB ratio of .037.
In an attempt to understand why he was letting up more solid contact, I looked at his fastball velocity, but it was right where it was last year. Rosenthal has not lost any velocity from where he was last year, which means it his stuff is not to blame for his increased FB and LD rates this year. Yet, even with his upper-90s heat, Rosenthal has struggled to get ahead in the count. He has thrown the first pitch of the at-bat for a strike just 57.1% of the time this year, which is a 6% drop from last season. Anytime you fall behind a hitter, you give them a much better chance to make solid contact, even when you can touch triple digits. As a pitcher with as much stuff as he has, Rosenthal must be aggressive and work ahead in the count in order to maximize his lights out repertoire.
More concerning than the fact that he is falling behind more hitters than last year, is where Rosenthal is missing. Of all the pitches Rosenthal has thrown outside the strike zone, 44% have missed up above the zone, compared to just 28% below the zone. This is compared to last year when he missed above the zone just 34% of the time and below the zone with 35% of his pitches outside the zone. While this may not seem significant since these balls are outside the zone, so they are unlikely to be hit, it is always concerning to see a pitcher consistently throwing up in the zone. Rosenthal’s propensity to miss with pitches up has certainly contributed to his increased LD% and FB%, as it is easier to elevate a pitch that is already up. This could be a strategy for Rosenthal, as it is harder to catch up to fastballs up in the zone, but it has yet to materialize into positive results, as his performance is worse than in 2013.
Also, based off the times I have seen him throw, this does not seem to be a strategy, as he has also missed up in the zone with his changeup, which is never intended by any pitcher. Despite some issues keeping it down in the zone, Rosenthal’s changeup has been his best pitch by far this season. This is particularly surprising for a pitcher that throws as hard as he does, but his changeup has compiled an astounding 5.71 runs above average per every 100 pitches, which has likely contributed to his increased use of the pitch (up to 15% from 6% in 2013). On a more concerning note though, his fastball is registering a career low .21 runs above average per every 100 pitches, down .77 runs from last year. It isn’t surprising the fastball is not worth as much as the changeup on average because the changeup is often used in higher leverage situations and also with less frequency. However, with Rosenthal’s struggles to get ahead in the count, it is not shocking that his fastball is less effective this year.
While Rosenthal has allowed harder contact this year, it has yet to materialize into better statistics for his opponents, in terms of batting average and slugging percentage. Where Rosenthal has been hurt this season is with his walks, which is among the few things he can fully control. He has already walked 17 batters this season, after walking just 20 all of last season in 45 more innings. Rosenthal’s BB/9 has actually more than doubled from it 2.39 mark in 2013, as it sits at 4.99 thus far in 2014. As a result of his lost control, Rosenthal’s opponent’s OBP has shot up from .289 last year to .321 this season, despite a lower opponent’s batting average. Rosenthal also tends to lose his control at the wrong times, as he has walked 10 of his 17 batters in high leverage situations, while pitching just 2/3 of an inning more in those situations than low and medium leverage situations.
Even more concerning, he has walked 11 batters with men on base, leading to an opponent’s OBP of .409 with men already on base. Rosenthal’s struggles from the stretch seem to be related to his rushing to the plate. Based purely on the times I have seen him throw, he has a propensity to rush to the plate when pitching from the stretch, which does not give his throwing arm time to get up into position. This tendency for his arm to lag leaves him susceptible to throw the ball up, which is where most of his pitches are missing. With his struggles from the stretch, it is no wonder Rosenthal’s Left on Base% has dropped 5.3% from last season.
This is not an article to criticize Rosenthal and call for his removal from the closer role, but rather to point out where Rosenthal needs to improve. His ERA is certainly high for a closer, but because he is not allowing many hits, he can easily improve his season by being more aggressive in the strike zone. A pitcher with as much stuff as Rosenthal should not be afraid to pitch within the zone. Working ahead in the count will also work to prevent the solid contact that has increased this year. Rosenthal shows the importance of throwing strikes, as he has gone from one of the premier late-inning arms in the game to a pitcher with the 114th best ERA of qualified relievers. Even in terms of FIP, Rosenthal ranks 51st among qualified relievers. While these are certainly discouraging trends, if he can return to throwing strikes the way he did in his previous two opportunities in the Majors, he will be able to reverse these trends.
Right now Eric Hosmer is the worst base runner of 2014 by a decent margin over Adam Dunn. This makes very little sense, well not the Adam Dunn part, but Eric Hosmer is an athletic player and not your traditional base clogging oaf. For his career, Hosmer’s Spd rating is 4.4, which says he is right at average for speed overall. Last year he was 11 of 15 on stolen base attempts and the year before he stole 16 bags in 17 tries. You expect that the best base runners are fast and the worst are slow, and generally that seems to be true. When it is not true though, there is an interesting difference in the groups.
I went out to look for two groups. The first was a group of really fast players who had bad years on the base paths. The cut-offs for them were an Spd rating of 7 or higher, considered excellent speed, and a negative Bsr and were therefore a liability on the bases despite their speed. For Spd below average is 4.0, so for the second group I looked for players below that who managed to have great base running years, anything above 5 Bsr.
The total sample went back through the 1980 season for batting title qualified players, which included 5049 player years. The group of fast players who had bad base running looks like this:
| Year | Player |
| 1993 | Al Martin |
| 2003 | Alex Sanchez |
| 1984 | Bill Doran |
| 1983 | Brett Butler |
| 1991 | Dan Gladden |
| 1996 | Fernando Vina |
| 1982 | Garry Templeton |
| 1990 | Lance Johnson |
| 2001 | Luis Castillo |
| 1994 | Luis Polonia |
| 1984 | Rudy Law |
| 1990 | Sammy Sosa |
| 1991 | Steve Finley |
There are a lot of good players in there, and one legitimate superstar in Sammy Sosa. You will notice that none of them repeated the feat either. Only once in their careers did they manage to have the combo of excellent speed with negative base running value. Most of them were just not very good base runners consistently and happened to have an especially bad year to get on the list. Luis Castillo and Lance Johnson were decent on the base paths most years and had a few really good seasons. Rudy Law had a Bsr of 10.6 the year before, by far the best season of any of these players, so I don’t know what happened in 1984.
Now to the group of over achieving base runners. It is a small and accomplished list:
| Season | Name |
| 2003 | Albert Pujols |
| 2008 | Joe Mauer |
| 2009 | Ryan Zimmerman |
| 2009 | Scott Rolen |
Again, no players repeated the feat, but this time the caliber of player jumps up. Albert Pujols is an all time great. Scott Rolen is a likely Hall of Famer, and Joe Mauer will probably get there. The only one that isn’t likely to get to Cooperstown is Ryan Zimmerman, but it isn’t inconceivable that he could get there if he can get healthy and put some good seasons up through his 30s. Even when they were young, none of these guys were particularly fast though Rolen managed to get a Spd of 6.1 once. For all of these guys you can Google and quickly find things about their great work ethic and/or leadership qualities, so maybe only the truly diligent can make up for their lack of speed by being hard working students of the game.
Madison Bumgarner has pitched like a top tier starter since he appeared on a big league mound in 2009. While his strikeout rate—8.46 career K/9—has always been above average, something has clicked with the big lefty this season, launching him into legitimate No. 1 starter territory. Through 13 starts this season, Bumgarner has a K/9 of 10.04, ranking third in the NL behind only Stephen Strasburg and Zack Greinke.
What’s most fascinating about Bumgarner is that he’s dominating hitters basically with two pitches, both of which—the fourseamer and the cutter—are high velocity pitches. PITCHf/x has Bumgarner throwing a fourseamer 41.19% of the time and a cutter—which FanGraphs lists as a slider—37.22% of the time. For the sake of simplicity, I will refer to the latter pitch as a cutter.
This season, the fourseamer has been especially effective for Bumgarner. Batters are swinging at the pitch at a higher rate (45%) than any previous season, and they are making contact with less frequency, as the 29.50% whiffs per swing shows. In 2013 batters whiffed at the pitch 26.69% of the time when swinging; between 2009-2012, the rate was never higher than 19.81%.
The cutter, of which the usage rate has dropped almost 2% since 2012, has seen similar results as the fourseamer. Hitters swing at the cutter 57.25% of the time and whiff with 24.33% of those swings.
A big reason for the diminished contact rate is the fact that Bumgarner is throwing his pitches in strike zone less often than in years past. His in-zone rate is just 39.63%, the only time in his career that it’s been under 40%. When hitters swing at pitches out of the strike zone—which they do 36.01% of the time, a career high—they whiff 37.7% of the time. When swinging at pitches in the zone, the whiff rate is 16.75—a rate that surpasses those in any of his previous seasons.
When Bumgarner gets hitters into two-strike counts, his approach stays the same for the most part. In those counts, he throws his fourseamer 41.41% of the time and his cutter 37.5% of the time, both numbers just slightly above the overall usage in any count. The one aspect that changes in two-strike counts is Bumgarner’s usage of his curveball. Overall, he throws the pitch 11.93% of the time. In two-strike counts, the usage rate jumps up to 17.5% and batters swing at it 55.84% of the time. The result is a 20.78% whiff rate, highest of all Bumgarners pitches in two-strike counts (16.23% fourseamer, 14.55% cutter).
Another aspect of Bumgarner’s dominance this year has been his ability to fight back and limit damage when behind in the count. His fourseamer and cutter have been the main reason for this. When behind in the count 1-0, Bumgarner has thrown the cutter 43.57% of the time and the fourseamer 35.71%. Here’s what happens with those pitches in 1-0 counts:
| Pitch Type | Whiff/Swing | Foul/Swing | Swing% |
| Fourseamer | 33.33 | 50.00 | 36.00 |
| Cutter | 16.67 | 53.33 | 49.18 |
Between the two pitches, over half of the swings result in a foul ball. Add in the whiff rates and Bumgarner finds himself back in the drivers seat more often than not after falling behind.
What about the 1-0 counts that get to 2-0? More often than not—62.22% of the time—he throws the cutter while throwing the fourseamer 31.11% of the time. Here are the results:
| Pitch Type | Whiff/Swing | Foul/Swing | Swing% |
| Fourseamer | 33.33 | 50.0 | 50.0 |
| Cutter | 16.67 | 53.33 | 67.86 |
Again, more often than not, Bumgarner is able to fight through being in an unfavorable count. Once he gets to 2-1, he continues to attack hitters with the fourseamer (35.71%) and the cutter (54.29%). Here’s what happens:
| Pitch Type | Whiff/Swing | Foul/Swing | Swing% |
| Fourseamer | 33.33 | 50.0 | 84.0 |
| Cutter | 16.67 | 53.33 | 73.68 |
In addition to these numbers, Bumgarner’s current walk rate of 2.01 BB/9 further shows that he doesn’t often lose hitters when falling behind. Rather, he uses his fourseamer and cutter to get himself back into a favorable count and is thus putting hitters away at a career-high rate.
The MLB draft is coming up and with any luck I’ll get this posted by Thursday and take advantage of web traffic. I can hope! (ed. note: nope) Anyway, Tuesday on FanGraphs I read a fascinating portrayal of the draft process, laying out the nuts and bolts of how organizations scout for the draft. The piece, written by Tony Blengino (whose essays are rapidly becoming one of my favorite parts of this overall terrific baseball site), describes all the behind the scenes work that happens to prepare a major league organization for the Rule 4 draft. Blengino described the dedication scouts show in following up on all kinds of prospects at the college and high school levels, what they do, how much they need to travel, and especially how much ground they often need to cover to try and lay eyes on every kid in their area.
One neat insight for me was Blengino’s one-word description of most scouts as entrepreneurs. You could think of them almost as founders of a startup, with the kids they scout as the product the scouts are trying to sell to upper layers of management in the organization. As such, everything they can do to get a better handle on a kid’s potential can feed into the pitch to the scouting director.
I respect and envy scouts’ drive to keep looking for the next big thing, the next Jason Heyward or Mike Trout. As Blengino puts it, scouts play “one of the most vital, underrated, and underpaid roles in the game.” While one might make the argument that in MLB, unlike the NFL or NBA, draft picks typically are years away from making a contribution and therefore how important can draft picks be?, numerous studies have shown that the draft presents an incredible opportunity for teams in building and sustaining success. In fact, given that so much of an organization’s success hinges on figuring out which raw kids will be able to translate tools and potential into talent, one could (and others have) made the argument that scouting is a huge potential market inefficiency for teams to exploit. Although I’ll have a caveat later. But in any case, for a minor league system every team wants to optimize their incoming quality because, like we say in genomic data analysis, “garbage in, garbage out.”
As I was reading this piece, I started thinking about ways to try and create more efficiencies. And I started thinking about Big Data. Read the rest of this entry »