Archive for Uncategorized

Carrasco’s New Deal, and Why the Yankees Should Do the Same with Pineda

I’m about to drop a cold, hard truth-bomb…

I’m not a professional general manager.

BOOM!

I know your mind just exploded, but it’s true.

Anyway, what I’m saying is that if I were a general manager (again I’m really not), I would hand out a lot more contracts like the one the Cleveland Indians just gave Carlos Carrasco, 28. For those of you not familiar, they agreed on a 4 year- $22 million contract. That shakes out to $5.5 million per year.

Now Carrasco is far from a sure thing as a top of the rotation guy, but he did have an encouraging season last year. He had 9.4 K/9 and an impressive 4.83 K/BB. Also, his FIP was just 2.44, suggesting that it wasn’t a fluky season, but a sign of things to come.

While we should expect some regression to the mean with Carrasco and can’t expect him to post a 2.55 ERA over the next four seasons, all the metrics suggest that Carrasco has what it takes to be a very good starting pitcher.

This isn’t an (article? blog post? stupid collection of words?) about Carrasco, though, it’s more about the type of contract he was given. We’ve seen it before, a player in his twenties being locked up to a long-term, rather low-per-year deal. Andrew Friedman was notorious for doing this with the Rays. For example, he locked up Chris Archer to a 6 year/$25 million deal when Archer was 25. Matt Moore got a 5 year/$14 million extension at just 22. Most notably, he gave Evan Longoria a 6 year/$17.5 million extension with an upside of $44.5 million over 9. These are good deals. Andrew Friedman is smart, so Andrew Friedman made these deals. (Logic!)

Why are they smart? Well, for a small-market team like Tampa, the deals allow them to maintain their homegrown stars for a longer time and at a relatively low average salary. For a big market team like the Yankees, these deals also make sense because if the player fails, it’s not a big deal to just eat the money they owe him. For example, if the Yankees decided to give Michael Pineda an extension in the range of 4 year/$30 million (give or take x million, I can not stress enough how bad I am at projecting contracts), to kick in starting in the 2016 season, I think that would be a really smart move, for both the Yankees and Pineda.

Pineda, when not injured or poorly concealing pine tar, has been a really good pitcher. I don’t want to bore you with numbers, just kidding I do. He has a lifetime FIP of 3.16 and a 3.78 K/BB ratio in 253.1 innings. Last year, he was filthy, posting a 2.61 SIERA, 2.71 FIP, and 8.43 (!) K/BB ratio. So, yeah, when he’s not a bonehead or hurt, he’s pretty freaking good. I recognize the inherent risk he carries, but (please don’t yell at me) he has shown flashes of a pitcher who can command $100 million when he hits free agency. Having a guy with that much upside and skill through his age-30 season at just 7 to 8 million dollars per year is really a bargain. If it doesn’t work out, they’re the Yankees and can afford to eat the money. It’s not like its a huge, burdensome contract.

The deals also make sense for the players, however. Look at Carrasco, first. Last season was the first in which he did not spend any time in the minors. Sure, the way he pitched suggested that if he continued like that and hit free agency eventually, he could be taking home a big contract, but when you have had just one, albeit good, season in the majors and you are offered $22 million, you probably take it.

Same goes for Pineda. He started 28 games in 2011, then missed two full season with injuries, and only started 13 last year. Sure, he’s looked awesome, but if you were a guy with his background of injuries and uncertainty, and you were offered $30 million, I imagine you take it. The deal also allows him to hit free agency when he’s 30/31 and, if he pitches well enough, get that huge contract.

So what have we learned:
1) I’m not a general manager
2) Long term/low AAV extensions can benefit both the teams and players
3) More contracts like this should happen

FIN

Sources:
fangraphs.com
mlbtraderumors.com
http://sports.espn.go.com/mlb/news/story?id=3353025


This Post is Not About Kris Bryant

No, really. It isn’t. More ink has been spilled on Bryant than on every other just-sent-to-AAA layer combined. So you won’t get any more of that here.

Ok, this is actually a little about Bryant, in the sense that he is a future Cubs third baseman, and this is about the recent Cubs’ third basemen that have gone before him. It is, by and large, an uninspiring lot, but the list reveals something about how the Cubs used to assemble rosters, and how that now appears to have changed.

Here’s a list of WAR that each major-league team has accumulated at third from the beginning of the division era (1969) to the present. If you scroll waaaay down to the bottom you see the Cubs, down there at 25 out of 30. The only teams worse are all expansion teams. Here’s the same list resorted by wRC+. The Cubs inch up to 24, and a couple of storied (or at least old) franchises now appear below them, but the message is essentially the same: a message of dismal underachievement. This message is not confined to third – those of you who are either Cubs haters or masochists can play with those tables and look at the other positions. It’s the same tale of woe except in the few cases where the Cubs have had Hall-of-Fame-caliber players at a position for some length of time (e.g., Sandberg and Sosa*).

What accounts for this prolonged failure? Could it be The Curse? FanGraphs Community sought comment from the Major League Baseball Ruminants Association, and here’s what their spokesgoat had to say: “The Chicago Cubs’ multiple decades of ineptitude have nothing to do with supernatural forces or the actions or inactions of our members. Rather, the Cubs’ continual suboptimal performance is due to that franchise’s historic inability to integrate such concepts as advanced statistics and an even rudimentary understanding of aging curves into their roster assembly thought processes.”

Pretty strong words there from the MLBRA; let’s see if evidence backs them up.  What follows is a review of the top 10 Cubs third basemen by WAR since 1969. I’m leaving out guys like Mark Bellhorn and Jose Hernandez who played quite a bit at third, but whose primary position was elsewhere. The fact that I even have to say “I’m leaving out guys like Mark Bellhorn and Jose Hernandez” should be sending visible shivers down your spine.

10. Kevin Orie  684 PA, 79 wRC+, 1.9 WAR, Age 24-29

The only player on this list to come up with the Cubs during the divisional era, Orie got off to a promising start in 1997, with a 101 wRC+ in 415 plate appearances, as well as superior defense. He plunged into the abyss in 1998, and after putting up a 39 wRC+ through July, the disgusted Cubs offloaded him to the Marlins for Felix Heredia, whose left-handed arsenal of kerosene would reward opposing hitters for years to come. If you think baseball players get paid too much, take a look at Kevin Orie’s transaction list on Baseball Reference.  This is what life is like for the vast majority of players who aren’t good enough to hold down a steady major-league job.

9. Vance Law  1075 PA, 103 wRC+, 2.3 WAR, Age 31-32

Signed as a free agent in 1988, Law had a BABIP-fueled year in which he also swatted 29 doubles and 11 homers. The alien inhabiting Vance Law’s body returned to its distant galactic home in 1989, and Law reverted to his good-glove, small-stick self. He did get to play in two postseason games in Wrigley, which is two more than the vast majority of living humans can claim.

8. Steve Buechele  1290 PA, 94 wRC+, 3.6 WAR, Age 30-33

Danny Jackson’s disastrous arson spree in Chicago ended in July 1992, when the Cubs traded him to Pittsburgh for Buechele. His main contribution came in 1993, when the BABIP alien returned to Chicago, jacking Buechele’s BABIP up from his career .275 mark up to .305. Buechele produced a respectable 108 wRC+ that year, together with good defense. The rest of his time in Chicago he was essentially a slightly better version of Vance Law.

7. Bill Mueller  670 PA, 112 wRC+, 4.0 WAR, Age 30-31

Acquired after the 2000 season from the Giants for an aging Tim Worrell, who would give them three excellent seasons in relief, Mueller represented a rare venture by the Cubs into the land of sabermetrics. His problem wasn’t sabermetrics; it was injuries. Mueller was an excellent two-way advanced stat contributor when healthy, but in an 11 year career, Mueller exceeded 500 plate appearances just four times, none of them with the Cubs.

6. Steve Ontiveros  1633 PA, 96 wRC+, 4.1 WAR, Age 25-28

The good news: the Cubs got him young. The bad news: they traded Bill Madlock to get him. Ok, the Cubs also got Bobby Murcer in that deal. Meh. Ontiveros had outstanding plate discipline (career K rate: 11.4%; career BB rate: 12.2%), but no power whatsoever (career ISO: .093). Released in 1980, he took his keen batting eye to Japan.

5. Ron Cey  2108 PA, 110 wRC+, 5.6 WAR, Age 35-38

The Penguin waddled into Chicago in 1983 on a salary-dump trade from the Dodgers. He put up good offense for the Cubbies, but by this point in his career had a range not far exceeding that of the third base bag itself. The Cubs probably figured that putting Cey next to an aging Larry Bowa would hide the problem, but Bowa’s range had eroded as well. In 1984, Cey became the first Cubs third baseman to reach the postseason since Stan Hack. I’m sure that’s something he brings up with the grandkids a lot.

4. Luis Valbuena  1241 PA, 100 wRC+, 6.1 WAR, Age 26-28

A waiver acquistion from the Blue Jays in April 2012, Valbuena initially looked like a glove-first utility guy, but his offense gradually improved, until breaking out last year with a 116 wRC+.  The BABIP alien is being sought for questioning: Valbuena’s was .294 last year, compared to a career rate of .269. Although he has a reputation as a platoon bat, his career splits are just about even, so he may have a future as a starter, but it won’t be with the Cubs. Kris Bryant’s long shadow led the Cubs to trade Valbuena to the Astros, where he should have an easier time fending off Matt Dominguez.

3. Bill Madlock  1632 PA, 137 wRC+, 11.1 WAR, Age 23-25

This is the kind of trade the Cubs have all too often failed to make: After a disappointing 1973 season, the Cubs correctly recognized that they needed to retool, and thus dealt Ferguson Jenkins to the Rangers for Bill Madlock.  In his three seasons in Chicago Madlock supplied excellent offense that outweighed his spotty defense. Then in February 1977 the Cubs sent Madlock to San Francisco in exchange for Ontiveros and an aging, declining Bobby Murcer. This is the kind of trade the Cubs have all to often made. Yes, Madlock had issues, but the Pirates would eventually find a way to make use of him after the Giants also gave up on him. If the Cubs had recognized the value of his talent, they might have tried harder to do the same.

2. Ron Santo, 3135 PA, 122 wRC+, 19.9 WAR, Age 29-33

We now know why Ronnie didn’t age particularly well, but he still put up two outstanding seasons (in 1969 and 1972) and three good ones in his remaining time with the Cubs. His later years seem disappointing only in comparison to his four-year reign of terror over NL pitchers from 1964-67 (with respective OPS of .962, .888., .950, and .906). His lowest ISO during that period was .212 in 1967.  The mounds may have been higher back then, but they were never high enough to silence his bat.

1. Aramis Ramirez, 4705 PA, 126 wRC+, 28.5 WAR, Age 25-33

In backhanded revenge for Bill Madlock, in July 2003 the Cubs obtained Ramirez from the Pirates along with Kenny Lofton in exchange for Jose Hernandez and a PTBNL, who turned out to be second round bust Bobby Hill.  A particularly fiery pit in GM Hell awaits Dave Littlefield for this awful deal, but one man’s Hell is another man’s Ramirez, and this trade enabled the Cubs to enjoy the only stability they’ve known at third since Santo’s retirement. Ramirez hit 34 homers for the Bucs in 2001, but in 2002 the homers turned into strikeouts. Ramirez made some progress in 2003, but not enough to kill Littlefeld’s sick fascination with Herrnandez, and so the deal was done. Ramirez immediately blossomed with the Cubs, raking at a .233 ISO rate for the remainder of that season, and continuing his excellent output for many years thereafter. He is the fourth best Cubs third baseman of all time, behind only Santo, Hack, and Heinie Zimmerman.

So yes, this list bears out the ruminant’s ruminations, at least to some extent. Ramirez is the only good third baseman since 1969 that the Cubs had control of during his mid-career years. The Cubs often resorted to trading for or signing aging third basemen with declining performance and expanding paychecks, because their farm system had failed to produce anything better. The few young players they did obtain they either failed to develop (Orie, Ontiveros) or gave up on too soon (Madlock). Valbuena is an exception here, but even he is likely to top out as a second division starter at best. And remember, these are the good guys.

So you can see why Cubs fans are so obsessed with Bryant. For many of the last 45 years, the hot corner in Wrigley has been ice cold.


The Fans Projections: Pitchers

Previously, I looked at the difference between the Fans projections and the Depth Charts projections for hitters. Now let’s look at the pitchers.

As with the hitters, the Fans projections are much more optimistic than the Depth Charts. Using the raw projections, the following table shows how much more optimistic the Fans are for pitchers. One note: because of the big difference in playing time and role for Tanner Roark, I eliminated him from consideration. The Depth Charts have Roark primarily pitching in relief (61 G, 6 GS, 95 IP), while the Fans have him as a starter (34 G, 29 GS, 184 IP).

For the average starting pitcher, the Fans are projecting eight more innings pitched, a much better ERA and WHIP, slightly more strikeouts, and 0.5 more WAR. Relievers have closer projections from the Fans and the Depth Charts, with the Fans projecting just 0.1 more WAR for the average reliever. For the entire set of pitchers, the Fans are projecting a 3.47 ERA and 1.21 WHIP, while the Depth Charts check in at 3.71 and 1.25.

The overall totals are useful to get a big-picture view, but the distribution of WAR can also be interesting. The graph below shows the difference between the Fans projected WAR and the Depth Charts projected WAR for starting pitchers in increments of WAR from -0.8 to 1.9. The players on the left are projected by the Fans for less WAR than the Depth Charts are projecting. The players on the right are projected for more WAR by the Fans. The black line is at a difference of 0.0 WAR.

The Fans projected more WAR for 80% of the hitters (previous article). It’s even more extreme for the pitchers: 83% of the pitchers are projected by the Fans for more WAR than the Depth Charts are projecting. The pie chart below shows this breakdown.

Again, that’s the big picture for starting pitchers. The individual pitchers at the extremes might be interesting to look at, so we’ll start with the nine pitchers with the biggest NEGATIVE difference between their Fans projection and their Depth Charts projection.

There are some good pitchers on this list. Given that the Fans project 83% of pitchers to have a higher WAR than the Depth Charts are projecting, it’s surprising to see Max Scherzer, Jose Fernandez, Hisashi Iwakuma, and Francisco Liriano on this list of starting pitchers the Fans like the least. In most cases, the Fans are projecting a better ERA than FIP and, because FanGraphs WAR is FIP-based, this explains some of the difference in WAR. Also, the Fans are projecting significantly fewer innings than the Depth Charts for some of these pitchers, which reduces their WAR.

Notes:

  • The Fans like Masahiro Tanaka to perform well when he’s on the mound (3.14 FIP versus 3.37 FIP projected by the Depth Charts) but project him for 46 fewer innings than the Depth Charts are projecting, which accounts for his lower projected WAR.
  • Max Scherzer is projected by the Fans for five more innings than the Depth Charts, but with a higher FIP, at 2.96 to 2.78, and a higher BABIP that results in a higher WHIP (1.12 to 1.07). He’s still the eighth-best starting pitcher per the Fans, while the Depth Charts have him at #5 among starters in WAR.
  • Francisco Liriano is similar to Scherzer in that the Fans are in agreement on the number of innings pitched but project Liriano for a higher FIP (3.54 to 3.29) than the Depth Charts.
  • Jose Fernandez and CC Sabathia are projected for fewer innings by the Fans than the Depth Charts. In the case of Sabathia, the deficit is 53 innings. As for production, the Fans and Depth Charts projections are quite similar for CC: 4.18 ERA, 3.93 FIP, 1.26 WHIP for the Fans, 4.12 ERA, 3.96 FIP, 1.26 WHP for the Depth Charts.
  • After dropping his BB/9 to a microscopic 0.7 in 2014, the Fans and the Depth Charts both see regression in this area for Phil Hughes. The Fans expect Hughes’ BB/9 to more than double, from 0.7 to 1.6, while the Depth Charts expect Hughes to hold on to some of those gains, projecting a 1.2 BB/9. Hughes is projected for a very similar number of innings, but his higher FIP projection by the Fans results in a -0.6 WAR difference between the two sources.
  • For John Lackey, the main difference in his Fans projection and his Depth Chart projection is a higher BB/9 (2.3 to 2.0). His career mark is 2.6, but he’s been better than that in each of the last two years (1.9 BB/9 in 2013, 2.1 BB/9 in 2014).
  • Finally, the Fans are most pessimistic about James Shields, despite his move to Petco Park, also known as Pitchers Paradise (by me, I just made that name up, you’re welcome.). The Depth Charts project Shields for a higher strikeout rate (8.1 K/9 to 7.6 K/9) and to have fewer fly balls leave the yard (0.7 HR/9 to 0.9 HR/9). The result is a difference in FIP in favor of the Depth Charts (3.23 FIP to 3.47) and a 0.8 difference in WAR. Among starting pitchers, Shields is ranked 16th in WAR by the Depth Charts but 56th by the Fans.


On the other end of the spectrum, there are 21 starting pitchers for whom the Fans project a WAR that is at least 1.0 greater than the Depth Charts are projecting, with Jesse Hahn leading the way with a difference of 1.9 WAR. Here are the top 10 starting pitchers based on the greatest difference in their Fans projection and their Depth Charts projection.

All ten of these pitchers are projected for more innings and a better FIP by the Fans than by the Depth Charts. Many of these pitchers are younger pitchers or pitchers with only a year or two of major league experience.

Notes:

  • The leader in the clubhouse is Jesse Hahn, projected for 1.9 more WAR by the Fans than the Depth Charts. Their innings projections are close, just a difference of 10, but the Fans expect Hahn to post a 3.27 FIP compared to the 4.25 mark projected by the Depth Charts. The Fans project a better strikeout rate, better walk rate, and lower home run rate. In 163 1/3 minor league innings, Jesse Hahn struck out 8.8 batters per nine innings. His K/9 was 8.6 in 73 1/3 major league innings last year. The fans are projecting more of the same, with a K/9 of 8.5. The Depth Charts see major regression, pegging Hahn for a 6.7 K/9.
  • Cliff Lee is projected for 180 innings by the Fans and 106 by the Depth Charts. It looks like there’s a good chance he won’t achieve either mark in 2015.
  • Drew Smyly is projected for significantly more innings by the Fans, along with a better FIP (3.41 to 3.63).
  • The Mookie Betts of starting pitchers? That would be Carlos Carrasco. Carrasco’s projection for 4.2 WAR by the Fans ranks him 9th among all SPs, while the Depth Charts have him 28th. The Fans project Carrasco for a much higher K/9 (9.3 to 8.5) and a lower walk rate (2.2 BB/9 versus 2.6 BB/9), along with 29 more innings pitched.
  • If you compare the strikeout and walk rate projections by the Fans for Nathan Eovaldi to his career strikeout and walk rates, it’s easy to see that they are quite optimistic for Eovaldi in 2015. The Fans project Eovaldi for a 7.0 K/9 versus a 6.3 career K/9 and a 2.3 BB/9 versus a career 2.9 mark. That gives him a forecasted 3.58 FIP. The Depth Charts have him with a 4.25 FIP and less than half as much WAR.
  • Jake Odorizzi had a strong 2014 season and the Fans are optimistic that he can do it again in 2015.
  • Jacob deGrom had a big jump in his strikeout rate after moving up to the big leagues last year. In 323 1/3 minor league innings, deGrom has a career 7.4 K/9, and his best single-season mark in the minor was 7.8 K/9 in 2012. Then he came up to the major leagues last year and struck out 9.2 batters per nine in 140 1/3 innings. The Fans are projecting deGrom for a K/9 of 8.8, while the Depth Charts have him down at 8.2. The difference in FIP is 3.03 for the Fans and 3.40 for the Depth Charts, which produces an overall WAR difference of 1.3. deGrom is ranked 58th among starting pitchers in WAR based on his Depth Chart projection but is 32nd based on the Fans projections.
  • Both the Fans and the Depth Charts like Jordan Zimmermann quite a bit. The Depth Charts projection has Zimmermann with 3.4 WAR, which ranks him 12th among starting pitchers. The Fans projected WAR of 4.7 moves Zimmerman up to 6th.

Well wrap this up with a look at the individual relief pitchers at the extremes. First are the relief pitchers who are projected for much less WAR by the Fans than the Depth Charts.

The three relievers who might be the top three closers in baseball are on this list, which is surprising (Aroldis Chapman, Craig Kimbrel, Greg Holland).

  • Aroldis Chapman is projected for a 2.15 FIP but even that can’t compare to the 1.84 FIP projected by the Depth Charts. The Fans also project Chapman to have a 13.4 K/9 versus a 15.9 K/9 projected by the Depth Charts. The end result is a difference of 1.1 WAR, with the Depth Charts placing Chapman 1st in WAR among relief pitchers and the Fans projecting him 9th.
  • When it comes to Greg Holland, Craig Kimbrel, and Koji Uehara, I’m not sure what is going on with their WAR projection from the Fans. Holland, Kimbrel, and Uehara are all projected for better FIPs by the Fans than the Depth Charts, and similar innings pitched, but less WAR.
  • Jake McGee’s lower WAR projection is in part due to eight fewer innings being projected by the Fans.

Finally, we’ll look at the relievers with the most favorable difference in WAR based on the Fans projections versus the Depth Charts projections.

  • Aaron Sanchez is very popular this spring. He was terrific in 33 innings out of the bullpen last year (1.09 ERA, 2.80 FIP). The Fans project him for a 3.36 FIP in 129 innings (43 games, 16 starts), while the Depth Charts are not so optimistic, with a 4.53 projected FIP in 111 innings (56 games, 11 starts). This combination of better pitching in more innings results in a difference of 1.9 WAR, tops among all relief pitchers.
  • Yusmeiro Petit is similar to Sanchez, projected to have a better FIP (3.07 to 3.30) and more innings pitched (131 to 92) by the Fans.
  • A couple of Seattle Mariners pitchers, Dominic Leone and Danny Farquhar, make this list based on their projection for many more innings by the Fans versus the Depth Charts. This is also true for Chase Whitley, Tony Watson, Jake Diekman, and Justin Wilson.
  • The Fans projection for Jeurys Familia is closer to the Depth Charts projection for innings pitched (61 to 55), but the Fans project Familia to have a 2.97 FIP versus a 3.50 FIP projected by the Depth Charts.


Making the Case Against Baseball in Montreal

Through a lot of backroom deals and schemes, which are beautifully illustrated in Jonah Keri’s Up, Up, and Away, mayor Jean Drapeau was finally able to get Montreal, and Canada, a professional baseball team. The Expos were the first baseball franchise to be situated outside of the US. They were part of Major League Baseball from 1969 to 2004; in 2004 they relocated to Washington and became the Washington Nationals.

Throughout most of its history, baseball in Montreal has been a struggle, not just on the field but also off it. In fact, just getting a suitable stadium for the team was a headache. The Expos had to play their first seven years in a Triple-A ballpark called Jarry Park, which could only seat 28, 500 people. The stadium was less than ideal, it wasn’t a dome, and due to Montreal’s cold weather, many games in April and September had to be played on the road.

In 1977, however, the Expos finally got a new Stadium, Olympic Stadium. The unfortunate part, however, for the Expos, was that the primary designs of the stadium were for the Olympics and not baseball. In fact the Stadium, while a dome, was a disaster, in not just its facility but it’s location. It was located completely out of the way, and far from downtown. Charles Bronfman, owner and majority shareholder, often tried to get a new stadium in downtown Montreal, but was never successful. This was probably one of the most significant impediments in the Expos success as a franchise.

The Expos were often poor on the field, but more importantly, they were poor as a business, creating very little revenue (as compared to other major league franchises). They were also, as it seemed, always rebuilding, never being able to sign valuable free agents, and never having a high payroll. There attendance also wasn’t exactly great.

What now follows is an evaluation, of the Expos historical value as a franchise. The problems? Well there are several, one and perhaps the most important to remember, is that teams are privately owned, and therefore are not obliged to disclose any of their financial information. This makes evaluating a team’s overall value very difficult, but not impossible.

Most of you are probably familiar with Forbes. The problem, however, is that I was only able to find Forbes data from 1990 to 2014. I also was only able to find data on payroll, from 1985, on-word, leaving me essentially only with attendance to look at from 1969 to 2004. Attendance, and let me make this clear, is not the best way of measuring a franchise’s value, but since it’s the only data source I could find before 1985, I thought I’d use it. So, below is a chart comparing the Expos attendance history to league average.

MTL A

For most of its history, the Expos attendance was below average. A couple of other important elements to note are that in 1981, it was a labor-shortened season. That’s why you see the league wide drop in attendance. In 1998 also, while the league attendance was starting to rise, the Expos dropped dramatically. Perhaps this had something to do with the trade of Pedro Martinez to the Red Sox, in the 1997 offseason. Perhaps it had something to do with the franchise rebuilding, yet again, or perhaps there was still some lingering frustration from the 1994 season. None of this is certain, what is however is after 1996, Expos fans stopped showing up.

The goal though is not to gain a sense of attendance, but rather to get a sense of the franchise’s value. Attendance, in that matter has a number of shortcomings. It doesn’t tell us anything about the overall expenses, revenues, ticket sales, TV deals, income, ect… Rather, what it does is give us a sense of the fan’s interest in the team (though not entirely as it doesn’t consider TV ratings). While there seems to have been a significant interest in the team in the mid to low 80’s, the overall interest in the team tends to have been very minimal.

As I’ve mentioned because teams are privately owned enterprises, I had to rely on Forbes value system, which is only available from 1990 on-wards. This will skew the data. For example, from 1979 to 1990 was the Expos most successful era. During that time they only had two losing seasons, which coincided with their first and only playoff berth in 1981.

That being said, a team’s success on the field does not always translate to value. We should therefore not assume that since the Expos had good teams from 1979 to 1990 that the team’s value had risen significantly, if at all. Just take a look at the Rays and the A’s, both teams have won a lot of games, the last few years, and yet Forbes still ranks them among the lowest teams in value.

Also many of you might be wondering what goes into Forbes’ valuation process? How accurate is it? These are valuable questions and concerns. While there isn’t a ton of information out there on these issues, John Beamer did write an article in 2007, for The Hardball Times, which takes a look at how accurate Forbes’ valuation is and what goes into it. If you’re too lazy to read it, than just understand this, “The variance between the purchase price and the Forbes’ valuation averaged 20%…” also “The primary axis of valuation is team revenue, which includes things such as ticket sales, TV money, sponsorship, revenue sharing, concessions, parking and a myriad of other schemes that franchises use to wheedle money from their fans”.

In determining the value, Beamer looked at “recent deals” which ranged from years 1992 to 2006 where only two team values were past 2004 (Brewers and Nationals). Considering most of the data we will be looking at will be from years 1990 to 2004, Beamer’s valuations should not be considered outdated.

So considering that Forbes’ main valuation process is through revenue, that’s where we’ll go next. Below is a chart that compares Montreal’s revenue from 1990 to 2004, compared to league average. An element to note, the 2002 data for revenue was not available, that’s why you will notice a break in the graph.

MTL R

As you can probably tell, Montreal was always, below average when it came to revenue, and the gap seemed to be getting wider and wider as the years went on. It is also very disappointing that the 2002 data point was not available. There seems to be some kind of break or shift that happened that year, which would have been interesting to look at.

Even though revenue is the major contributor to value, it also states in Beamer’s article that “Major League Baseball franchises are typically valued at somewhere between 2-3x revenues”. To see the evidence of this, again read John Beamer’s article.

So now lets get to the moment you’ve all been waiting for, the Expos franchise value, compared to league average. I also included the median in the chart below. Why? Well in order to avoid teams that are skewing the data too heavily one way or another, such as the Yankees, the median seemed like a useful tool to add, although as you will be able to tell, there wasn’t a significant difference between the median and average.

MTL V

A lot of you might notice the sudden increase in value for the Expos, in 2004. Well, the Forbes’ valuations for 2004 came after the 2004 season. Thus the franchise was going to officially be the Washington Nationals, which immediately increased the team’s overall value.

Some of you at this point might be wondering how can value increase so significantly? Well, in order to understand what this means, I recommend you read John Beamer’s The Value of Ball Clubs (Part 1) and go to the valuation 101 section. If you don’t want to do that, then I’ll just summarize the concept. Basically what one is trying to do, in valuing any type of business, is trying to work out the value of today, in conjunction with the amount of cash flow a business or team will provide it’s owners in the future.

Ok, now that you got that, let’s look at one final chart, I promise! Here we’ll look at the Expos overall franchise value beginning with 1990, but will also include the Nationals value until 2011, in order to see how the move to Washington has paid off.

Expos to Nats

Now look at that huge increase in team value. Basically what Major League Baseball did, was turn one of it’s least profitable teams into an above average team. In fact, from 2003 to 2004 the team’s value changed 114 %. This was by far the biggest change in one-year value of any franchise. The next highest one-year percentage change, for 2004, was the Phillies at 39%. In fact, since Forbes has made their data available I have never found a one-year value % change as high as this one.

This looks like pretty damming evidence of the Expos franchise, and it is. Montreal’s first crack at a Major League Franchise was not a successful one. This, however, does not mean that it wasn’t important. Montreal was the first Canadian franchise to ever get a baseball team and it opened the doors for a team to come to Toronto.

That being said,, the prospects of Montreal getting a new team does look bleak, even after Rob Manfred’s comments, “Montreal’s a great city. I think with the right set of circumstances and the right facility, it’s possible.” Manfred’s comments were positive, when addressing Montreal, however, they were relatively vague. The notion of the right set of circumstances, for example, could mean anything. Also, for Montreal to get a team another team needs to re-locate and when addressing a team’s relocation, a popular team has been the Tampa Bay Rays.

The problem is that the Rays aren’t moving anytime soon. As Eric Macramalla points out in his article, Dream Killer: Sorry Expos Fans, The Tampa Bay Rays Aren’t Moving To Montreal. Basically the Rays aren’t going anywhere because they signed a Use Agreement, which “prevents the team from moving out of Tropicana Field and calls for potentially catastrophic monetary damages should the Rays abandon the stadium before its deal is up in 2027”. As for baseball expanding, well I haven’t exactly herd or read that baseball expects to expand anytime soon, so it doesn’t look like that is going to happen.

Then there’s the right facility, well just about every owner of the Expos has tried unsuccessfully to get a new stadium, and one downtown. At this point (and this is my opinion and should be taken that way), Montreal would need to construct a stadium downtown in order for them to receive a team. Which, given its history of incompetence in that matter seems unlikely.

Finally, could Montreal someday get a baseball team? Yes, when that will be, I don’t know, probably not anytime soon. Therefore Expos fans should not be holding their breaths. At this point, as it concerns a Major League Baseball Franchise there really is no evidence that Montreal can sustain a successful team. That being said, if I were Major League Baseball, I’d start by installing a Minor League Team and see how it goes. If it’s successful and fans are showing up, then perhaps re-consider.

References:


  1. John Beamer Articles for The Hardball Times: Part 1 http://www.hardballtimes.com/measuring-managing-the-value-of-ballclubs-part-1/
  2. Part 2: http://www.hardballtimes.com/measuring-managing-the-value-of-ballclubs-part-2/
  1. SABR Business of Baseball Committee, which provided most of the Forbes data. Also a great source of economic data, for baseball research.
  2. Eric Macramalla’s article “Dream Killer: Sorry Expos Fans, The Tampa Bay Rays Aren’t Moving To Montreal”.
  3. The Biz of Baseball for providing additional Forbes data.
  4. Ben Nicholson-Smith article Manfred: Return to Montreal ‘Possible’ for MLB, for the Manfred quote.
  5. Jonah Keri’s Up, Up, and Away.
  6. Attendance data was found at Baseball Reference.

2014 Projection Review (Updated)

Update: The previous version of this post, published last week, contained a data error that has now been fixed. Steamer/Razzball and Pod projections have been added and the hitter sample has been corrected from the prior version of this article.

Welcome to my 5th annual forecast review.  Each year, every projection submitted to me at http://www.bbprojectionproject.com is tested for error (RMSE), overall predictive power (R^2), and is then ranked.  I present both RMSE and R^2 because both have their uses. RMSE is a standard measure of forecast error, but this metric penalizes general optimism/pessimism about the run environment, even if a forecast has low error after controlling for the bias. For instance, Marcel is very good at predicting the run environment and the FanGraphs Fans are pretty terrible, so Marcel will usually have a better RMSE than the Fans. On the other hand, R^2 serves as a better test of the relative performance of players by ignoring any general biases in the forecasts that are pervasive in the forecasting system. Marcel tends to be lower in this metric versus other systems due to its rigid formula, whereas more sophisticated methods like ZIPS or Steamer tend to do better.

Comparisons are based on the set of players that every system projected. This amounts to 70 pitchers and 141 hitters for 2014. This is certainly limiting, but there is an inherent tradeoff in the number of projection systems that can be analyzed vs. the number of players that are projected by all systems. My policy is to consider as many projection systems as possible, as long as the number of players doesn’t get too low.

Now, on to the contest!

This year certainly saw some interesting results.  By the R^2 metric, the best forecaster for hitters (Dan Rosenheck) only published forecasts for hitter categories–evidently there’s some benefit in specialization when it comes to projecting baseball players. The best pitcher forecasts came from Mike Podhorzer’s Pod forecasts.  The best composite score came from my own personal forecast brew, which is computed based on an algorithm that estimates weights of other main-line forecasts. In a sense, this is not an original forecast, so I now note forecasts that I know use other forecasts as inputs with an “*” (I realize that to some degree, most everyone calibrates their forecasts to what they see other people doing). The next two forecasts are also of this same type, the AggPro and the Steamer/Razzball forecasts. The top “structural” forecast was Pod, followed by ZIPS, Rotovalue, and CBS.

In terms of RMSE, Dan Rosenheck ran away with the hitters, and my weighted average did the best among pitchers.  The top overall performers across categories were MORPS, Marcel, Rotovalue, and AggPro.

Overall, there are a few interesting comparisons to be made between projection systems across different years. Among the open-source stats community, Steamer vs ZIPS is always interesting to watch. In prior years, Steamer has been better. This year, however, ZIPS made huge gains and beat Steamer.  Marcel, had a typical year—with a very favorable ranking on RMSE but not R^2. The FanGraphs Fans had a down year, finishing near the bottom in most metrics.  CBS Sportsline is the top forecast by a major media company, which in general, tend to do poorly. Finally, most every projection submitted beat the naïve previous-season benchmark, where the 2014 forecast is simply the actual performance in 2013.  At least we’re all doing something right.

Thank you again to all who submitted projections. I invite anyone who is interested to submit their top-line hitter and pitcher projections to me at larsonwd@gmail.com.  You projection will be put up on http://www.bbprojectionproject.com as soon as I receive it, unless you want me to embargo it until the end of the season, which some people choose to do because of fantasy baseball or other proprietary reason.  All the code (STATA) and data for these evaluations are available upon request. If I’m using the wrong versions of anyone’s projections (which can happen!), please let me know.


R^2 Rankings:

Place Forecast System Hitters Pitchers Average
N/A Dan Rosenheck* 1.60 1.60
N/A Beans 5.00 5.00
1st Will Larson* 6.60 5.25 5.93
2nd AggPro* 8.40 6.25 7.33
3rd Steamer/Razzball* 6.20 9.00 7.60
4th Pod 11.20 4.75 7.98
5th ZIPS 10.00 7.25 8.63
6th Rotovalue 9.00 8.25 8.63
7th CBS Sportsline 10.20 8.00 9.10
8th ESPN 9.40 10.50 9.95
9th Steamer 9.60 11.50 10.55
10th Fangraphs Fans 13.60 9.00 11.30
11th Rotochamp 7.60 15.25 11.43
12th Razzball 11.60 12.25 11.93
13th MORPS 13.20 11.00 12.10
14th Clay Davenport 14.60 11.50 13.05
15th Cairo 8.20 18.00 13.10
16th Marcel 16.60 10.00 13.30
17th Bayesball 9.80 20.50 15.15
18th Guru 16.80 14.00 15.40
19th Oliver 16.40 15.00 15.70
20th Prior Season 20.40 18.75 19.58


RMSE Rankings:

Place System Hitters Pitchers Average
N/A Dan Rosenheck* 1.40 1.40
1st MORPS 4.20 8.50 6.35
N/A Beans 6.50 6.50
2nd Marcel 8.00 7.00 7.50
3rd Rotovalue 8.60 7.00 7.80
4th AggPro* 7.60 8.25 7.93
5th ZIPS 9.60 7.75 8.68
6th Clay Davenport 6.60 10.75 8.68
7th Steamer 7.80 11.00 9.40
8th Cairo 4.80 14.00 9.40
9th Steamer/Razzball* 9.80 10.00 9.90
10th Will Larson* 15.60 4.75 10.18
11th Guru 7.80 13.00 10.40
12th Rotochamp 10.20 11.50 10.85
13th Bayesball 7.20 15.25 11.23
14th Pod 15.80 8.75 12.28
15th Razzball 16.20 13.00 14.60
16th Oliver 14.40 15.25 14.83
17th ESPN 18.40 11.50 14.95
18th CBS Sportsline 17.40 13.50 15.45
19th Fangraphs Fans 19.40 13.25 16.33
20th Prior Season 20.00 20.50 20.25


RMSE, Hitters:

system r rank hr rank rbi rank avg rank sb rank AVG
Dan Rosenheck* 19.22 1 7.07 1 20.91 1 0.024 2 6.24 2 1.40
MORPS 20.56 2 7.70 3 22.35 2 0.027 13 6.13 1 4.20
Cairo 21.55 3 7.87 6 22.53 3 0.025 9 6.30 3 4.80
Clay Davenport 21.91 6 7.92 7 23.74 8 0.025 8 6.33 4 6.60
Bayesball 22.47 9 8.24 10 24.03 10 0.022 1 6.39 6 7.20
AggPro* 22.64 12 8.23 9 23.34 6 0.024 3 6.42 8 7.60
Steamer 22.58 10 8.22 8 23.37 7 0.025 7 6.41 7 7.80
Guru 22.62 11 7.74 4 23.76 9 0.025 6 6.88 9 7.80
Marcel 21.67 4 7.62 2 22.76 4 0.027 16 7.04 14 8.00
Rotovalue 22.03 7 7.77 5 23.02 5 0.026 10 7.07 16 8.60
ZIPS 22.11 8 8.46 11 25.30 14 0.024 4 6.94 11 9.60
Steamer/Razzball* 23.87 13 8.73 13 24.75 13 0.024 5 6.35 5 9.80
Rotochamp 21.73 5 8.49 12 24.60 12 0.026 12 6.93 10 10.20
Oliver 24.67 16 9.26 18 26.86 16 0.026 11 6.94 11 14.40
Will Larson* 24.88 17 8.75 14 24.37 11 0.029 19 7.08 17 15.60
Pod 24.23 14 9.10 16 26.54 15 0.035 21 7.04 13 15.80
Razzball 24.57 15 8.90 15 27.45 19 0.027 14 7.14 18 16.20
CBS Sportsline 26.28 19 9.94 21 26.90 17 0.027 15 7.06 15 17.40
ESPN 25.88 18 9.88 20 27.25 18 0.028 17 7.32 19 18.40
Fangraphs Fans 27.20 21 9.24 17 28.98 21 0.029 18 7.62 20 19.40
Prior Season 26.56 20 9.39 19 28.77 20 0.033 20 7.84 21 20.00


R^2, Hitters:

system r rank hr rank rbi rank avg rank sb rank AVG
Dan Rosenheck* 0.267 1 0.329 1 0.181 1 0.373 2 0.679 3 1.60
Steamer/Razzball* 0.143 12 0.270 5 0.150 8 0.325 5 0.689 1 6.20
Will Larson* 0.162 10 0.263 8 0.165 5 0.320 6 0.676 4 6.60
Rotochamp 0.227 2 0.268 7 0.127 15 0.293 9 0.675 5 7.60
Cairo 0.166 7 0.259 10 0.165 4 0.288 12 0.659 8 8.20
AggPro* 0.129 15 0.269 6 0.141 11 0.352 3 0.660 7 8.40
Rotovalue 0.164 8 0.272 3 0.167 2 0.278 14 0.574 18 9.00
ESPN 0.166 6 0.253 12 0.166 3 0.273 16 0.656 10 9.40
Steamer 0.130 14 0.260 9 0.135 12 0.317 7 0.661 6 9.60
Bayesball 0.144 11 0.235 17 0.148 9 0.424 1 0.655 11 9.80
ZIPS 0.180 4 0.244 14 0.124 16 0.347 4 0.652 12 10.00
CBS Sportsline 0.162 9 0.243 15 0.151 7 0.266 18 0.682 2 10.20
Pod 0.183 3 0.271 4 0.128 14 0.111 21 0.641 14 11.20
Razzball 0.128 16 0.281 2 0.159 6 0.256 19 0.639 15 11.60
MORPS 0.174 5 0.217 19 0.132 13 0.288 13 0.636 16 13.20
Fangraphs Fans 0.103 19 0.255 11 0.116 18 0.289 11 0.657 9 13.60
Clay Davenport 0.134 13 0.237 16 0.143 10 0.271 17 0.622 17 14.60
Oliver 0.065 21 0.223 18 0.101 20 0.289 10 0.648 13 16.40
Marcel 0.119 17 0.250 13 0.122 17 0.275 15 0.515 21 16.60
Guru 0.118 18 0.210 20 0.109 19 0.311 8 0.555 19 16.80
Prior Season 0.094 20 0.206 21 0.093 21 0.197 20 0.525 20 20.40


RMSE, Pitchers:

system W rank ERA rank WHIP rank SO rank AVG
Will Larson* 4.77 2 0.992 6 0.148 10 56.62 1 4.75
Beans 4.82 4 0.983 3 0.148 11 58.88 8 6.50
Marcel 4.90 8 1.003 11 0.143 4 57.93 5 7.00
Rotovalue 4.83 6 0.978 2 0.151 17 57.26 3 7.00
ZIPS 5.06 15 0.965 1 0.139 1 60.06 14 7.75
AggPro* 4.94 9 0.992 7 0.144 7 59.18 10 8.25
MORPS 4.71 1 1.026 18 0.149 13 56.69 2 8.50
Pod 4.82 5 0.995 10 0.144 8 59.75 12 8.75
Steamer/Razzball* 4.89 7 1.004 12 0.150 15 58.20 6 10.00
Clay Davenport 4.78 3 1.015 15 0.148 12 59.80 13 10.75
Steamer 4.94 10 1.006 14 0.150 16 57.89 4 11.00
ESPN 5.40 18 0.994 8 0.141 3 63.31 17 11.50
Rotochamp 5.04 14 0.989 4 0.145 9 64.18 19 11.50
Razzball 5.25 17 0.990 5 0.149 14 62.89 16 13.00
Guru 4.96 12 1.055 19 0.144 6 61.96 15 13.00
Fangraphs Fans 5.56 20 1.005 13 0.141 2 64.09 18 13.25
CBS Sportsline 5.47 19 0.995 9 0.143 5 67.18 21 13.50
Cairo 4.96 11 1.022 17 0.170 21 58.76 7 14.00
Oliver 5.12 16 1.019 16 0.151 18 59.73 11 15.25
Bayesball 5.04 13 1.082 20 0.163 19 59.11 9 15.25
Prior Season 5.64 21 1.157 21 0.169 20 64.99 20 20.50


R^2 Pitchers:

system W rank ERA rank WHIP rank SO rank AVG
Pod 0.229 1 0.174 9 0.302 5 0.134 4 4.75
Beans 0.184 5 0.196 3 0.269 10 0.136 2 5.00
Will Larson* 0.194 3 0.199 2 0.269 11 0.133 5 5.25
AggPro* 0.190 4 0.190 6 0.287 7 0.121 8 6.25
ZIPS 0.137 12 0.207 1 0.331 2 0.102 14 7.25
CBS Sportsline 0.222 2 0.176 8 0.330 3 0.079 19 8.00
Rotovalue 0.158 9 0.183 7 0.242 16 0.179 1 8.25
Fangraphs Fans 0.122 16 0.161 13 0.372 1 0.125 6 9.00
Steamer/Razzball* 0.167 8 0.192 4 0.254 14 0.111 10 9.00
Marcel 0.137 13 0.146 14 0.302 6 0.122 7 10.00
ESPN 0.146 11 0.171 11 0.309 4 0.101 16 10.50
MORPS 0.181 6 0.112 18 0.236 17 0.134 3 11.00
Steamer 0.128 15 0.192 5 0.254 13 0.104 13 11.50
Clay Davenport 0.177 7 0.120 15 0.252 15 0.117 9 11.50
Razzball 0.154 10 0.174 10 0.257 12 0.097 17 12.25
Guru 0.115 17 0.106 19 0.281 9 0.109 11 14.00
Oliver 0.133 14 0.119 16 0.225 18 0.107 12 15.00
Rotochamp 0.079 20 0.170 12 0.283 8 0.037 21 15.25
Cairo 0.115 18 0.118 17 0.178 19 0.097 18 18.00
Prior Season 0.088 19 0.028 21 0.164 20 0.102 15 18.75
Bayesball 0.077 21 0.103 20 0.159 21 0.060 20 20.50


The Fans Versus the Depth Charts

By now it’s common knowledge that the projections created by the Fans here at FanGraphs are much more optimistic than Steamer or ZiPS or the combination of Steamer and ZiPS used in the Depth Charts. Of course, this isn’t totally fair because of the difference in projected playing time. The Fans project more playing time for most players so those players will generally be projected for more WAR. The Depth Charts can be altered at any time by the people behind the curtain to reflect current injuries or changes in playing time estimates, while the Fans projections have been coming in for the last couple months and don’t accurately reflect recent changes in expected playing time. Still, I thought it would be interesting to look at the Fans versus the Depth Charts to highlight the players with the largest difference in WAR when comparing the two. This information is from Friday the 13th, so the Depth Charts may have had some changes since then. There are 326 players with projections from the Fans and the Depth Charts.

To get this party started, consider the graph below. This graph shows the difference between the Fans projected WAR and the Depth Charts projected WAR for each player in increment of WAR from -1.0 to 2.6. The players on the far left, at -1.0 WAR, are projected for 1.0 less WAR by the Fans than the Depth Charts. The thick line above 0.0 is the dividing point between negative WAR and positive WAR. There were 19 players projected for the same WAR by the Fans and the Depth Charts.

This shows very clearly that the majority of players are projected by the Fans to have more WAR than the Depth Charts are projecting for that player. Can you guess the identity of the player on the far right, the guy who is projected for 2.6 more WAR by the Fans? He’s a FanGraphs’ favorite. It’s *Mookie Betts! A little to his left, at 2.2 more WAR, is Steven Souza. On the other end, the two hitters projected for 1.0 less WAR by the Fans are Mark Trumbo and Drew Stubbs.

*Mookie Betts is projected by the Depth Charts to have 371 PA with a .275/.343/.416 batting line. The Fans project him for 633 PA with a .294/.368/.435 line. The Fans also project him to have better fielding and base running numbers.

The pie chart below shows the breakdown of players projected for less WAR, the same WAR, and more WAR by the Fans. As you can see, 80% of the players are projected for more WAR by the Fans than the Depth Charts.

As mentioned above, the Fans project more playing time for most players than the Depth Charts project. The graph below shows the breakdown by plate appearances when comparing the Fans to the Depth Charts.

Again, not surprising. The Fans consistently project more playing time. The breakdown for plate appearances shows that 79% of the players were projected for more plate appearances by the Fans. This matches up well with the WAR projections, as 80% of the players were projected for more WAR by the Fans. Individually, the three players projected for the greatest difference in plate appearances by the Fans are Danny Espinosa (+296), Jon Singleton (+279), and Robbie Grossman (+277). The four players to the extreme in the other direction are Jake Marisnick (-151), Marcus Semien (-151), Maikel Franco (-145), and Brendan Ryan (-130). The Fans don’t expect these four players to get the kind of playing time the Depth Charts are projecting. Just for fun, the players who have the most similar projections for plate appearances are Marcell Ozuna (-2), Nick Franklin (+1), Justin Turner (+1), and J.D. Martinez (+2).

It’s not all about playing time, though. To find out how much of the higher projection of WAR by the Fans is due to playing time and how much is based on actual production on the field, I adjusted the Fans’ WAR projections to the same number of plate appearances being predicted by the Depth Charts and created the following graph and accompanying pie chart.

Even after adjusting to an equivalent number of plate appearances, the Fans are projecting 75% of the players to have more WAR than the Depth Charts are projecting. This shows that the Fans are consistently projecting hitters to perform better. They are also projecting these hitters to be better fielders and base runners than the Depth Charts are projecting. Consider the table below that shows the average line for these hitters based on the Depth Charts and based on the Fans.

The Fans are projecting these players for an average of 49 more plate appearances and a better hitting line across the board, along with better Fld and BsR and about 0.6 more WAR per hitter.

Let’s look at some individual players, starting with the true oddballs: the players the Fans like much LESS than the Depth Charts. These are the adjusted numbers, meaning that the WAR projected by the Fans is adjusted to the number of plate appearances projected by the Depth Charts. These are the players for whom, playing time being equal, the Fans like much less than the Depth Charts.

All nine of these players are projected by the Fans to hit worse than their Depth Charts projection would suggest and six of the nine players are projected to be worse fielders. I’d say the most surprising player on this list would have to be Mike Trout. As good as the Fans believe Trout will be, the Depth Charts like him even more. Based on raw numbers, Trout is projected for 8.6 WAR by the Depth Charts and 8.2 WAR by the Fans, but the raw numbers show Trout projected by the Fans for 686 plate appearances. In the chart above, Trout’s plate appearances are adjusted down to the 644 projected by the Depth Charts, which drops his WAR to 7.7 and creates a difference of -0.9 WAR. The WAR difference can be attributed to a worse projected wOBA (.401 to .411) and worse fielding.

Other notes on these players:


  • The Depth Charts project a .339 wOBA for Mark Trumbo, while the Fans have him at .321. Last year, Trumbo finished with a .308 wOBA. The year before, he was at .322. His career mark is .326 and he’s had a wOBA of .339 or more just once in his four years as a regular (or semi-regular) player. The Fans might end up being more accurate on Trumbo than the Depth Charts.
  • Drew Stubbs has a projected wOBA of .313 by the Fans and .327 by the Depth Charts. He had his best-hitting season last year with a .358 wOBA, all of it Coors Field inflated (.431 wOBA at home, .276 on the road).
  • Torii Hunter will be 85 years old this year (not really) and it looks like the Fans are pegging him for age-related decline, with a projected wOBA of .319 compared to the Depth Charts’ .327. Hunter hasn’t had a wOBA below .330 since 2003. The Fans are also projecting Hunter to be even worse in the field than the Depth Charts expect.


So, what players do the Fans REALLY like? Which players are projected for significantly more WAR by the Fans than the Depth Charts? Again, the following numbers are adjusted, meaning the players’ plate appearance totals are adjusted to their Depth Chart projections. With this adjustment, FanGraphs’ favorite Mookie Betts is not the most-liked player. Instead, Mr. Steven Souza rises to the top, with his former teammate, Michael Taylor, right there with him, and Joc Pederson rounding out this trio of young Fan favorites.

The Fans project all of these players to hit better, field better, and have better (or equal, in the case of Michael Cuddyer) base running numbers than the Depth Charts are projecting. In the case of Michael Taylor, the Fans are VERY optimistic, projecting a .336 wOBA compared to a .290 wOBA expected of the Depth Charts. The numbers for Taylor are based on just five fans, though, so take this with a giant grain of salt.

Eight of these nine players are young, have little major league experience, or both. Michael Cuddyer is the lone veteran. Cuddyer is coming off back-to-back years with wOBAs of .396 and .414. Of course, those seasons were in Colorado, where Cuddyer took full advantage of the park’s friendliness to hitters. Last year, Cuddyer had a .533 wOBA at home and .324 on the road. In 2013, it was a slightly more reasonable .427/.369 split. He will call Citi Field home this year and the Depth Charts are forecasting a .329 wOBA, while the optimistic Fans see Cuddyer posting a .352 mark.

Souza, Taylor, Pederson, Pompey, and Castillo have almost no major league track record to speak of yet the Fans are projecting them all to be above-average players. It’s very likely that these players will be drafted higher than they should be in the fantasy world. Everyone likes the shiny new toy, but young and inexperienced players generally take time to develop into fantasy assets.

Here is the next group of players liked much more by the Fans projections than the Depth Charts (again, adjusted to equal playing time based on the Depth Charts projections):

This group of players has a few with limited major league experience, such as Kevin Kiermaier, Joe Panik, Jose Ramirez, and Jorge Soler, but also includes a few players who have four or more big league seasons under their belts (Kyle Seager, Lorenzo Cain, Francisco Cervelli). Almost all of these players are projected by the Fans to hit, field, and run better the Depth Charts would suggest. One very notable number on this chart is the relative optimism of the Fans for Wil Myers on defense.

Going back to Kyle Seager, the Fans are projecting a career-high wOBA for Seager, at .354. His career mark is .333. He’s increased his wOBA in each year of his major league career, from .306 to .321 to .337 to .346. The Fans see another increase, while the Depth Charts are projecting regression back to his 2013 mark.

Other notes of interest:

  • The Fans project Kiermaier to equal his wOBA from last year’s 108 games with the Rays (.333 last year, projected for .332). The Depth Charts have him at .304.
  • The Fans like Josh Rutledge to be close to his career .312 wOBA (projected for .314), but the Depth Charts have him way down at .284.
  • In less than a half-season of playing time, Joe Panik had a .317 wOBA last year. The Fans have him projected for a .312 wOBA, while the Depth Charts see much more regression, down to a .291 mark.
  • In his two seasons in the bigs, Wil Myers has posted a .357 wOBA and a .275 mark. Of course, he dealt with injuries last year, which likely contributed to that disappointing performance. The Depth Charts are projecting a .329 wOBA for Myers this year, while the Fans have him with a .345 wOBA. Both projections are worse than what Myers did in his rookie year but much better than what he did last year.
  • Soler was crazy-good in 24 games last year (.386 wOBA). The Depth Charts have him regressed down to a .339 wOBA, while the Fans have him projected for a .364 mark.
  • In 785 career plate appearances, Francisco Cervelli has a career .327 wOBA. The Fans are projecting him for more of the same (.325), while the Depth Charts don’t think he’ll come close to that (.300).


Okay, last group. After adjusting to equalize the playing time, the following players are projected for 1.2 more WAR by the Fans than the Depth Charts:

Here we’re starting to see a few bigger names, like Joe Mauer, George Springer and Adam Jones.

  • Joe Mauer has a career .372 wOBA but is coming off a season that saw him with the second-lowest mark of his career, at .322. In the two previous seasons, Mauer had wOBAs of .376 and .383. The Fans are projecting a .357 wOBA, while the Depth Charts are not that optimistic, projecting a .338 mark.
  • George Springer’s career wOBA (.352) is between his 2015 Depth Charts projection (.346) and Fans projection (.366).
  • Adam Jones has reached his 2015 Fans projected wOBA of .355 just once in his career, back in 2012.
  • Jedd Gyorko hit .249/.301/.444 with a .325 wOBA in 2013, then followed that up with a .210/.280/.333 (.275 wOBA) season last year. The Fans see a return to his 2013 glory days (.328 wOBA), while the Depth Charts see improvement (.308 wOBA) but not to the level of two years ago.

The Fans projections are optimistic on most players, but the players listed on the three charts above are the players that the Fans like most of all. Many of them are young with limited major league playing time. It will be interesting to see how accurate the Fans are on these players at the end of the season.


Dodgers Bullpen: Waiting for Kenley

With the news that Kenley Jansen is going to miss 8-12 weeks with surgery on his landing foot, the Dodgers are going to need to find someone to close games for them possibly until mid-May. Over the past five seasons, Andrew Friedman has cobbled together bullpens in Tampa that ranked 11th in WAR in the majors. Not stellar, but definitely better than the 24th place the Dodgers have ranked over that same span. Has he given Don Mattingly the right mix to fill the hole left by Jansen, or is he going to go out and add a Rafael Soriano or Francisco Rodriguez through free agency, or will he reach out to the Phillies and try to make a deal for Jonathan Papelbon?

They have a number of holdovers in the mix in Pedro Baez, J.P. Howell, Brandon League and Paco Rodriguez. Friedman has added a plethora of relief arms in former Ray Joel Peralta, Chris Hatcher, Juan Nicasio, and Sergio Santos. After we look at Jansen, we’ll sift through this pile and see who might emerge as the early-season closer, and see if there are any cheap strikeouts or holds.

Kenley Jansen

Prior to undergoing surgery that will shelve him for 8-12 weeks, Kenley Jansen was considered a top closer. He still should be after he gets his boot off and gets back to unleashing his 94 mph cutter against the masses. He’s basically a one-pitch pitcher, as he throws the cutter 88.9% of the time, mixing in the odd slider and sinker.

He’s been one of the most consistent pitchers in baseball over the past three seasons, however, there is a troubling trend:

K% BB% FIP BABIP LD%
2012 39.3 8.7 2.40 .221 18.8
2013 38.0 6.2 1.99 .273 24.1
2014 37.7 7.1 1.91 .350 27.6

You’ll notice the K%, BB% and FIP are fairly consistent, but the BABIP and LD% have increased 58.4% and 46.8% over the past two seasons respectively. Not a good recipe for success. He’s going to need to get that LD% back to a more respectable level. If he can do that, then the BABIP should follow. He has no issues emasculating righties, as he held them to a .229 wOBA and struck out 47.5% of them, placing him second behind Aroldis Chapman in that category. If he can get the cutter inside to lefties instead of trying to backdoor it so often, maybe he can break a few more bats. He’s getting groundballs 45.1% of the time against lefties, but they touched him for a .378 BABIP.

vs Lefties Away/Off Middle In/Off
Usage 47% 27% 26%
BAA .393 .343 .253

If he can keep them from extending against it, he should have even more success.

Joel Peralta

One of the names being bandied about as a possible Jansen replacement is Joel Peralta. Andrew Friedman brought him over after seeing him up close in Tampa. Last year he had batters chase more than most pitchers did, with an O-Swing% of 35.5%. They also swung at less pitches in the zone, with a 64.2% Z-Swing%. How much of that was thanks to the framing skills of Jose Molina and Ryan Hanigan? When Yasmani Grandal is behind the plate, he’ll enjoy the same benefits, but when A.J. Ellis is back there, the zone is going to be smaller.

His 4.41 ERA in 2014 is not one you would expect to see from a guy who could be racking up a few early saves. A 3.11 xFIP and 2.54 SIERA are a little closer to what you’d expect to see from your ninth-inning guy. He’s got a three-pitch mix, with a four-seamer, curve, and splitter, with the splitter being the most effective of the three. If you’re looking for the saves that will be sopped up with Jansen out, I don’t think you’re going to find them here.

Brandon League

Brandon League used a 94 mph sinker and 86 mph splitter to generate an inordinate number of groundballs last year. Hitters didn’t have any problem making contact with the sinker, as they only had a 5.0% whiff rate on the pitch, but when they did put it in play, they smashed it into the ground 71.8% of the time. His overall 67.5% GB% was second amongst relievers last year.

League isn’t going to get many outs via the strikeout, as he only had a 13.9% K rate. Not what you want out of someone pitching the late innings for you. His walk rate of 9.9% isn’t that hot either, but he mitigated it by inducing the most double plays in the majors amongst relievers. Considering the group assembled here, you could do worse with League closing out April and early-May games.

J.P. Howell

Most bullpens would love to house a guy who posts a 1.33 ERA in 47.3 innings, especially a lefty who can retire both RHB and LHB. If you do what we all hate, and take out 1.7 innings against the Cubs in September where he surrendered six earned runs, that’s what you have. He boasts a sinker-curve combo that entices his foes to keep the ball on the ground 57.5% of the time.

One might look at his 49 innings in 68 appearances and see LOOGY. In fact, he was deployed against lefties 52.3% of the time and held them to a 167/284/227 line. Math would tell you he faced righties the other 47.7% of the time, and they only slashed 193/301/284 against him. He has shown he can handle both, and maybe this year you’ll see him get at least three outs in more than 28 of his 68 appearances.

If you’re in a league that likes holds, you could do worse than the 27 he posted in 2014. It will depend how he’s used, however. 2014 saw him come in to a pLI of 1.33, as opposed to 0.81 in 2013. Maybe that was Mattingly realizing what he had, or maybe it was him having to fill the size 14 spikes of Paco Rodriguez(spike size simply an estimate,) but it was a huge leap from the 11 holds he accrued in 2013 under the same regime.

Pedro Baez

Pedro Baez used his 96 mph four-seamer to his advantage in 20 innings in 2014. Using it three quarters of the time, he produced a tiny 0.88 WHIP. Don’t count on that again this season though, as it was fueled by a .197 BABIP. His 19.6% K% and 5.4% BB% aren’t shabby, but don’t expect him to be seeing to many high-leverage opportunities in the early going, if he even breaks camp with the Dodgers. Until he gets a secondary pitch that hitters fear, they’re going to be teeing off on his flaming arrow.

Chris Hatcher

You won’t find many short relievers who display a legit four-pitch mix, especially guys who were calling the pitches as recently as 2010. He throws a four-seamer and a sinker, both at 96 mph, and deviates with a couple of 88 mph offerings in his slider and splitter. The least-used pitch is the slider, at 17%, with the four-seamer topping out as at 42%.

In 56 innings with the Marlins after being recalled in late May, he posted a 25.9% K rate, coupled with a 5.2% BB rate. Not too shabby. His 3.38 ERA isn’t anything special, but his 2.56 FIP is almost a run better. If he can solve his homesickness (5.34 road ERA), and couple that with a stellar 1.32 home ERA, you may have a late-inning stud on your hands here. The difference could be as simple as dumb luck, with a 57.9% road LOB% and a 90.9% home LOB%, even with similar .337 and .313 BABIPs respectively.

With Jansen out, if the Dodgers stay in-house and let the dominoes start to fall, Hatcher could be one to get behind for 70+ innings and 80 or more whiffs. Keep an eye on him in the spring, if he goes west from Camelback Ranch, he could be a cheap source of goodness for you. If they bring in Chamberlain, Rodriguez, Papelbon or another name, however, he could find himself back in AAA. Which would not be smart.

Paco Rodriguez

Remember when Paco Rodriguez burst onto the scene with his Statue of Liberty motion, liberating his way to a 2.32 ERA and 20 holds in 2013? What happened last year? Well his ERA went up to 3.86, but both his FIP and xFIP went DOWN by 0.16 and 0.31 respectively. Maybe his LOB% going from 81.8% to 68.5%, combined with his BABIP exploding from .210 to .324 had something to do with it?

Sure he threw 40 innings less at the Major League level in 2014 and he lost 2 mph off his already pedestrian 89.6 mph fastball, but I’d expect something closer to 2013, if Mattingly hasn’t totally soured on him. He should get you more than a strikeout an inning, and if Howell falters or gets hurt, Rodriguez will be there to sop up those innings.

Sergio Santos

Remember when so many of us rushed to grab him last year because he was going to be closing in Toronto? Five April saves in the first two weeks of the season were pretty hot, but then his history of arm troubles bounced back to take him totally out of fantasy relevance. IF, he has a healthy spring and breaks camp with the Dodgers as an NRI, and IF, you’re in a crazy-deep mixed league, maybe you look to him for some holds. Promise yourself though, that if these unlikely events manage to come together, that you drop him like he’s hot at the first poor outing. Decreased velocity won’t be the first sign, because he actually ticked up one mph across the board through May, before taking two steps back. Nobody wants to see a guy hurt, but be on the lookout for warning signs if you’ve decided to roster him.

Juan Nicasio

The erstwhile Rockie starter seems to be primed for a shift to the pen. He ticked up a couple miles an hour after the Rockies gently placed him there in the second half of 2014, and was able to ditch his change. If he’s able to locate 95 and then subtract ten mph with a slider, that could be a dangerous weapon in the pen. He threw more than one inning a few times in Colorado, let’s see if Mattingly chooses to deploy him in the same way. With a 15.0 K%-BB% in relief, he’s not too bad of an option.


Crowdsourcing Bullpen Roles

With less than a month before Opening Day and fantasy baseball prep ramping up, I thought I’d take a look at bullpen roles for each major-league team. Most leagues still use saves as a category and it’s important to know who’s slated for the closer role, as well as the #2 and #3 guy in each pen if you’re in a large league or a league where every team is scrambling for the guy next-in-line to get those precious saves.

I used eight sources to determine how the fantasy experts are projecting each team’s bullpen. The sources are: FanGraphs Bullpen Report, CBS sports, Rotoworld, MLB.com, ESPN.com, Roster Resources, Fantasy Alarm, and Fox. For each team, I’ve listed their closer, setup guy #1, and setup guy #2, with the number of lists they are on out of the eight sources. I’ve also listed the projected saves for each pitcher based on the FanGraphs Depth Charts.

Locked In Their Roles


Kansas City Royals

Closer: Greg Holland (all 8 sources)

Setup #1: Wade Davis (all 8 sources)

Setup #2: Kelvin Herrera (all 8 sources)


Comment: There’s no question how the Royals’ bullpen is set up, which is not surprising considering how successful they were last season when they rode a tremendous bullpen all the way to the seventh game of the World Series.


FanGraphs Depth Charts: Holland—37, Davis—1, Herrera—1


Philadelphia Phillies

Closer: Jonathan Papelbon (all 8 sources)

Setup #1: Ken Giles (all 8 sources)

Setup #2: Jake Diekman (all 8 sources)


Comment: All eight sources have the Phillies’ pen lineup up as Papelbon, Giles, and Diekman. The one thing to watch for here is if the Phillies can find a taker for Papelbon’s contract. He’s owed $13 million this year and has a vesting option for another $13 million in 2016 if he finishes 55 games this year or 100 games over 2014-2015. If he goes, Giles is the guy to have.


FanGraphs Depth Charts: Papelbon—36, Giles—2, Diekman—2


Atlanta Braves

Closer: Craig Kimbrel (all 8 sources)

Setup #1: Jason Grilli (all 8 sources)

Setup #2: Jim Johnson (7), James Russell (1)


Comment: The Braves are opening a new ballpark in 2017 and Kimbrel is owed $9 million this year, $11 million next year and $13 million in 2017, with a $13 million club option for 2018. Does a team that doesn’t look ready to compete in the next two years really want to spend $20 million on a closer during that time? If Kimbrel gets traded, Grilli is next in line.


FanGraphs Depth Charts: Kimbrel—39, Grilli—2


Two Spots Set, What About That Third?


St. Louis Cardinals

Closer: Trevor Rosenthal (8)

Setup #1: Jordan Walden (8)

Setup #2: Seth Maness (5), Matt Belisle (3)


Comment: Rosenthal and Walden look to have the late-game roles locked in, but the #2 setup guy isn’t as certain. Maness is a ground-ball machine (career 61.5% GB%) with a low strikeout rate (15.9%) but a career 2.66 ERA. He picked up 3 saves last year. Belisle had a 4.87 ERA last year with the Rockies, but is projected to be much better this year (3.52 ERA—FanGraphs Depth Charts).


FanGraphs Depth Charts: Rosenthal—42


Cleveland Indians

Closer: Cody Allen (8)

Setup #1: Bryan Shaw (8)

Setup #2: Scott Atchison (5), Marc Rzepczynski (3)


Comment: It’s Allen and Shaw, with Atchison the most likely second setup guy. Rzepczynski shouldn’t be allowed to face a right-handed hitter with the game on the line. In his career, righties have hit .272/.366/.441 against him.


FanGraphs Depth Charts: Allen—38, Shaw—2, Atchison—2


New York Yankees

Closer: Dellin Betances (8)

Setup #1: Andrew Miller (8)

Setup #2: Adam Warren (5), David Carpenter (3)


Comment: Betances (3.2 WAR) and Miller (2.3 WAR) were two of the top six relievers by FanGraphs WAR last year. The consensus seems to be that Betances will be the closer with Miller the primary setup guy, but the FanGraphs Depth Charts show Betances with 30 saves to Miller’s 11, so he’s not being projected as the slam-dunk closer just yet. Both Warren and Carpenter are solid setup guys.


FanGraphs Depth Charts: Betances—30, Miller—11, Warren—2


Los Angeles Angels of Anaheim

Closer: Huston Street (8)

Setup #1: Joe Smith (8)

Setup #2: Fernando Salas (4), Mike Morin (2) Cesar Ramos (1), Vinnie Pestano (1)


Comment: If/when Huston Street misses a couple weeks with an injury in the middle of the season, Joe Smith will be the guy. After Smith, Fernando Salas has the most experience picking up saves, as he had 24 saves with the Cardinals back in 2011.


FanGraphs Depth Charts: Street—37, Smith—4


San Diego Padres

Closer: Joaquin Benoit (8)

Setup #1: Kevin Quackenbush (7), Dale Thayer (1)

Setup #2: Dale Thayer (5), Shawn Kelley (1), Alex Torres (1), Nick Vincent (1)


Comment: Benoit and Quackenbush both picked up saves after Huston Street was traded last year, but Benoit is clearly the closer going into this season. Thayer had 7 saves for the Padres in 2012. The FanGraphs Depth Charts have Brandon Maurer getting 4 saves and Shawn Kelley with 2, but Quackenbush with zero, which doesn’t seem quite right to me.


FanGraphs Depth Charts: Benoit—37, Maurer—4, Kelley—2


Pittsburgh Pirates

Closer: Mark Melancon (8)

Setup #1: Tony Watson (6), Jared Hughes (1), John Holdzkom (1)

Setup #2: Jared Hughes (3), Tony Watson (2), Antonio Bastardo (2), John Holdzkom (1)


Comment: Watson is considered the top setup guy for Melancon, with Hughes and Holdzkom falling in place behind him. Holdzkom has the sky-high strikeout rate, while Hughes is a ground ball machine (64.6% GB%).


FanGraphs Depth Charts: Melancon—40, Bastardo—2


Seattle Mariners

Closer: Fernando Rodney (8)

Setup #1: Danny Farquhar (6), Yoervis Medina (2)

Setup #2: Yoervis Medina (4), Danny Farquhar (2), Charlie Furbush (1), Tom Wilhelmsen (1)


Comment: After Rodney, it’s either Farquhar or Medina, with Farquhar the more popular choice among the eight sources used here and also the better pitcher statistically. After Rodney, Wilhelmsen has the most experience at closer.


FanGraphs Depth Charts: Rodney—40, Wilhelmsen—4


Detroit Tigers

Closer: Joe Nathan (8)

Setup #1: Joakim Soria (6), Al Alburquerque (1), Ian Krol (1)

Setup #2: Joakim Soria (2), Al Alburquerque (2), Joba Chamberlain (2), Bruce Rondon (2)


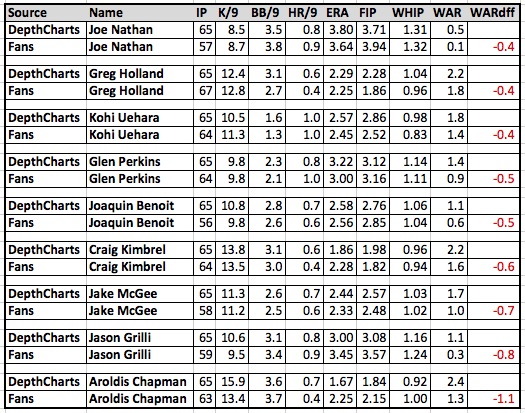
Comment: Joe Nathan started to show his age in 2014. His strikeout rate dropped; his walk rate rose, and he had the third-worst ERA of his 16-year career (4.81). His FIP (3.94) and xFIP (4.14) weren’t as bad as his ERA, but they weren’t great either. He’ll be 40 this year. In the long history of baseball, relievers 40 and older have a total of 13 seasons with 20 or more saves and eight seasons with 30 or more. The odds are against Joe Nathan. Joakim Soria is ready to take over should Nathan falter. Al Alburquerque looks to be the #3 guy in this pen. The FanGraphs Depth Charts expect Soria to get plenty of save opportunities this year.


FanGraphs Depth Charts: Nathan—24, Soria—14, Alburquerque—1, Chamberlain—1


Texas Rangers

Closer: Neftali Feliz (8)

Setup #1: Tanner Scheppers (7), Shawn Tolleson (1)

Setup #2: Kyuji Fujikawa (3), Shawn Tolleson (2), Tenner Scheppers (1), Alex Claudio (1), Mendez (1)


Comment: Feliz is the #1 guy going into the season, but his peripheral statistics were ugly last year. He had a 1.99 ERA, with a 4.90 FIP and 4.60 xFIP, thanks to a below-average 6.0 K/9, mediocre 3.1 BB/9, and ugly 1.4 HR/9. He had a BABIP of .176 and LOB% of 100%, neither of which are likely to be repeated. Scheppers was injured for much of the year, as was Fujikawa, but either pitcher could get some save chances if Feliz falters.


FanGraphs Depth Charts: Feliz—33, Tolleson—4


Arizona Diamondbacks

Closer: Addison Reed (8)

Setup #1: Brad Ziegler (7), Evan Marshall (1)

Setup #2: Oliver Perez (5), Evan Marshall (2), Brad Ziegler (1)


Comment: Reed is currently having shoulder problems, but the Diamondbacks’ team site reported that the team is optimistic he’ll be ready for Opening Day. Ziegler is most often named as the top setup guy, with Oliver Perez and Evan Marshall among the possibilities for late inning work. The FanGraphs Depth Charts are all over the place with this bullpen, with nine pitchers projected for at least one save.


FanGraphs Depth Charts: Reed—7, Ziegler—7, Marshall—7, Perez—6, Delgado—5, D. Hudson—4, M. Reynolds—2, Ch. Anderson—1, M. Stites—1, R. Ray—1


Who’s the 8th Inning Guy?


Boston Red Sox

Closer: Koji Uehara (8)

Setup #1: Junichi Tazawa (5), Edward Mujica (3)

Setup #2: Edward Mujica (4), Junichi Tazawa (3), Craig Breslow (1)


Comment: Since becoming a reliever in 2010, Uehara has been terrific. Still, he’ll be 40 years old this year and there’s not much history of 40-year-old relievers racking up high save totals. Tazawa is the favored option after Uehara by the eight sources used here, but Mujica is the guy with a history of getting saves (37 in 2013, 8 in 2014).


FanGraphs Depth Charts: Uehara—36, Tazawa—2, Mujica—2


Oakland Athletics

Closer: Tyler Clippard (8)—injury replacement for Sean Doolittle (DL)

Setup #1: Ryan Cook (5), Eric O’Flaherty (3)

Setup #2: Ryan Cook (3), Eric O’Flaherty (2), Fernando Abad (2), Evan Scribner (1)


Comment: While Doolittle is out the Oakland pen should go Clippard-Cook-O’Flaherty, although three sources have O’Flaherty ahead of Cook. Once Doolittle returns, everyone else gets bumped back a spot.


FanGraphs Depth Charts: Doolittle—28, Clippard—12


Chicago Cubs

Closer: Hector Rondon (8)

Setup #1: Pedro Strop (5), Neil Ramirez (2), Jason Motte (1)

Setup #2: Neil Ramirez (4), Pedro Strop (3), Zac Rosscup (1)


Comment: CBS is the only source that has Motte listed as the first setup guy so, despite his experience as a closer in 2012, it’s much more likely that Strop and Ramirez will be the primary setup guys to Hector Rondon.


FanGraphs Depth Charts: Rondon—40, Strop—3


Washington Nationals

Closer: Drew Storen (8)

Setup #1: Casey Janssen (4), Aaron Barrett (2), Craig Stammen (1), Matt Thornton (1)

Setup #2: Craig Stammen (3), Matt Thornton (2), Aaron Barrett (1), Blevins (1), Tanner Roark (1)


Comment: Janssen has earned 81 saves over the last three years and he’s the favorite to be the primary setup guy here, but his strikeout numbers last season were ugly (5.5 K/9). Barrett looks most likely to jump ahead of Janssen in this pen.


FanGraphs Depth Charts: Storen—43, Janssen—4


Chicago White Sox

Closer: David Robertson (8)

Setup #1: Zach Putnam (4), Jake Petricka (3), Zach Duke (1)

Setup #2: Jake Petricka (4), Zach Duke (3), Nate Jones (1)


Comment: There’s a difference of opinion on who will be the primary setup guy to Robertson in the White Sox’ bullpen. Putnam had 6 saves last year and a 1.98 ERA but a 3.08 FIP and 3.64 xFIP. Petricka had 14 saves last year and a 2.96 ERA but 3.60 FIP and 3.76 xFIP. Duke is projected to get more saves than both Putnam and Petricka by the FanGraphs Depth Charts. They also have Robertson with just 25 projected saves, which seems much too low.

FanGraphs Depth Charts: Robertson—25, Duke—8, Putnam—6


Cincinnati Reds

Closer: Aroldis Chapman (8)

Setup #1: Jumbo Diaz (4), Sam LeCure (3), Sean Marshall (1)

Setup #2: Sam LeCure (4), Burke Badenhop (2), Jumbo Diaz (1), Oscar Villarreal (1)


Comment: The primary setup job is still a question mark here, based on the eight sources. Jumbo Diaz is listed as setup guy #1 by four sources, but LeCure is listed more often as either the primary setup guy or the #2 guy.


FanGraphs Depth Charts: Chapman—39, LeCure—3


Baltimore Orioles

Closer: Zach Britton (8)

Setup #1: Tommy Hunter (4), Darren O’Day (4)

Setup #2: Tommy Hunter (3), Brian Matusz (3), Darren O’Day (2)


Comment: Hunter and O’Day are listed as the primary setup guy by four sources each. Hunter has more experience picking up saves (15 over the last two years), but O’day is the better pitcher.


FanGraphs Depth Charts: Britton—36, O’Day—3, Hunter—1


Miami Marlins

Closer: Steve Cishek (8)

Setup #1: A.J. Ramos (3), Mike Dunn (3), Bryan Morris (2)

Setup #2: A.J. Ramos (5), Mike Dunn (3)


Comment: There isn’t a strong consensus on the setup guy in this pen, but it’s most likely Ramos, then Dunn. Ramos, the right-hander, is most likely to step in if something happens to Cishek.


FanGraphs Depth Charts: Cishek—39, Ramos—1, Dunn—1


Minnesota Twins

Closer: Glen Perkins (8)

Setup #1: Casey Fien (3), Brian Duensing (3), Michael Tonkin (1), Caleb Thielbar (1)

Setup #2: Casey Fien (2), Brian Duensing (2), Ryan Pressly (2), Michael Tonkin (1), Stauffer (1)


Comment: Fien saw his dropout rate drop from 10.6 K/9 in 2013 to 7.3 K/9 in 2014, but he’s the top right-handed setup guy, so he would most likely be the guy to get saves if Perkins is unable to do so for some reason. Duensing is listed as the primary setup guy by three sources. His career 6.1 K/9 and 4.12 ERA suggests he’s not a guy you want to have on your fantasy roster.


FanGraphs Depth Charts: Perkins—34, Fien—1, Thielbar—1


Colorado Rockies

Closer: LaTroy Hawkins (8)

Setup #1: Rex Brothers (4), Adam Ottavino (3), Boone Logan (1)

Setup #2: Rex Brothers (3), Adam Ottavino (2), Boone Logan (2), Tommy Kahnle (1)


Comment: All eight sources have the 42-year-old LaTroy Hawkins listed as the Colorado closer. In the history of baseball, 42-year-old relievers have had more than 15 saves in a season just three times—1965 Hoyt Wilhelm (20), 1997 Dennis Eckersley (36), and 2013 Mariano Rivera (44). Still, Hawkins has been able to keep runs off the board over the last three seasons despite a low strikeout rate. Rex Brothers is listed most often as next in line, with Adam Ottavino also in the mix. The FanGraphs Depth Charts have eight pitchers projected for at least one save.


FanGraphs Depth Charts: Hawkins—6, Brothers—6, Ottavino—5, Axford—5, D. Hale—5, B. Logan—3, Bettis—2, J. Diaz—1


San Francisco Giants

Closer: Santiago Casilla (8)

Setup #1: Sergio Romo (4), Jeremy Affeldt (4)

Setup #2: Sergio Romo (4), Jeremy Affeldt (4)


Comment: The sources agree that the top three guys in the Giants’ pen will be Casilla, Romo, and Affeldt. They are not in agreement on whether it’s Romo or Affeldt as the primary setup guy. Romo has the closer experience, though, so he should be your handcuff with Casilla in leagues where backup closers are rostered.


FanGraphs Depth Charts: Casilla—14, Romo—11, Affeldt—9, J. Lopez—7, Petit—5


Milwaukee Brewers

Closer: Francisco Rodriguez (5), Jon Broxton (2), Rob Wooten (1)

Setup #1: Jon Broxton (6), Jim Henderson (1), Will Smith (1)

Setup #2: Will Smith (6), Tyler Thornburg (1), Brandon Kintzler (1)


Comment: This isn’t as uncertain as it looks. K-Rod is the closer. The Brewers wouldn’t have signed him if he weren’t going to close. He’s still in the process of obtaining his work visa and the hope is that he gets to camp by the end of the week. For now, MLB.com has Rob Wooten listed as the closer, and ESPN.com and Fantasy Alarm both have Broxton listed as the closer. The reality is that the late inning pitchers for the Brewer will be K-Rod, Broxton, and Will Smith.


FanGraphs Depth Charts: Broxton—4


Toronto Blue Jays

Closer: Brett Cecil (6), Aaron Sanchez (1), Steve Delabar (1)

Setup #1: Aaron Loup (5), Aaron Sanchez (2), Brett Cecil (1)

Setup #2: Steve Delabar (4), Aaron Loup (2), Aaron Sanchez (1), Brett Cecil (1), Steve Delabar (1)


Comment: Cecil has been a very good reliever over the last two years and is expected by the majority of these eight sources to be the main man for saves in 2015. Aaron Sanchez is a terrific young pitcher who may get bumped to the bullpen if there’s no room for him in the rotation. Loup is a setup guy with a mediocre strikeout rate. Delabar was great in 2012 and 2013 but really bad last year. Fox has him listed as the Blue Jays’ closer at the moment, but I would say that’s not bloody likely.


FanGraphs Depth Charts: Cecil—37, Loup—4


Messy Closer Situations


Los Angeles Dodgers

Closer: Joel Peralta (6), Brandon League (2)—filling in for Kenley Jansen (DL)

Setup #1: Brandon League (3), Joel Peralta (2), Pedro Baez (2), J.P. Howell (1)

Setup #2: Pedro Baez (3), J.P. Howell (3), Brandon League (1), Paco Rodriguez (1)


Comment: With Jansen currently out with a foot injury, six of eight sources like Joel Peralta to close for the Dodgers, with Brandon League the choice by the other two. When Jansen comes back, Peralta and League should be the top setup guys. The FanGraphs Depth Charts have saves scattered among six guys with J.P. Howell projected for the most.


FanGraphs Depth Charts: J.P. Howell—8, Jansen—7, Peralta—7, League—6, Baez—3, Paco Rodriguez—2


New York Mets

Closer: Jenrry Mejia (6), Jenrry Mejia/Bobby Parnell (2)

Setup #1: Jeurys Familia (6), Bobby Parnell (2)

Setup #2: Jeurys Familia (2), Vic Black (2), Carlos Torres (2), Josh Edgin (1), Rafael Montero (1)


Comment: Mejia is listed by himself as the closer by six sources and he shares the job with Parnell on the lists of two other sources. Mejia had 28 saves last year. Parnell had 22 the year before and is coming back from an injury hoping to reclaim his job. Right now, the FanGraphs Depth Charts have Mejia projected for 21 saves and Parnell projected for 19, so it’s a difficult situation to judge at the moment. Familia would be the guy who is third in line.


FanGraphs Depth Charts: Mejia—21, Parnell—19, Familia—2


Houston Astros

Closer: Luke Gregerson (5), Chad Qualls (3)

Setup #1: Luke Gregerson (3), Pat Neshek (3), Chad Qualls (2)

Setup #2: Pat Neshek (5), Chad Qualls (2), Josh Fields (1)


Comment: Five of eight sources have Gregerson listed as the Astros’ closer, with the other three putting Qualls in that spot. Qualls was the team’s closer last year and he had 19 saves with a 3.33 ERA. You would think the spot would be his to lose, but Gregerson has been the better pitcher over the years so it’s not hard to understand why most people would expect Gregerson to become the closer. Neshek is most likely third in line and Fields is a longshot.


FanGraphs Depth Charts: Gregerson—26, Qualls—6, Neshek—6


Tampa Bay Rays

Closer: Brad Boxberger (4), Grant Balfour (2), Kevin Jepsen (2)—filling in for Jake McGee (DL)

Setup #1: Brad Boxberger (4), Grant Balfour (3), Kevin Jepsen (1)

Setup #2: Grant Balfour (2), Ernesto Frieri (2), Kevin Jepsen (2), Jeff Beliveau, Kirby Yates (1)


Comment: McGee is likely to miss most or all of April. It’s hard to know who will get saves in the meantime. The majority likes Boxberger, but Balfour and Jepsen both have their backers. Balfour had 12 saves last year and 38 the year before, so he has experience as a closer. Boxberger was very effective last year, striking out 14.5 batters per nine innings, but the Rays may want to keep him in a setup role.


FanGraphs Depth Charts: McGee—38, Boxberger—3, Balfour—1,


Drafting an Injured Hunter Pence

Hunter Pence has been one of baseball’s most durable players since his first full-time season in 2008. Over the last seven years, Pence has never played fewer than 154 games, and he’s coming off a three-year stretch of 160, 162, and 162 games. He is the active leader in consecutive games played, with 382.

Unfortunately, that streak will end when the Giants open their regular season on April 6th in Arizona. Pence was hit by a pitch in a spring training game on Thursday and will be out six-to-eight weeks with a broken arm. Of course, in the real world, the important thing for Pence and the Giants is that he heals quickly and gets back on the field as soon as possible. In the fantasy baseball world, it’s natural to wonder how the injury affects his value on draft day.

One of the reasons Pence has been valuable in fantasy baseball over the years has been his durability. He has played almost every day for the last seven seasons, and this has allowed him to accumulate counting stats even if his rate stats are not elite. He’s not a 30-homer guy, rarely a 20-steals guy, and has only hit over .300 once since 2008. He’ll generally score 80- to 90 runs and drive in around 90. He’s scored 100 or more runs one time. He’s driven in 100 or more runs one time.

Consider his average season since 2008:

159 G, 671 PA, 172 H, 88 R, 24 HR, 89 RBI, 13 SB, .280 AVG

That’s solid across-the-board production but without any of the big, round numbers that are so exciting to see (100 runs, 30 homers, 100 RBI, 20 steals, .300 average). An interesting comparison is Carlos Gonzalez. Gonzalez is an elite player, when healthy. When he’s in the lineup, he’s a top 5 guy. Unfortunately, Gonzalez is often not healthy.

Consider the average season for Carlos Gonzalez since 2008:

109 G, 444 PA, 118 H, 69 R, 19 HR, 65 RBI, 16 SB, .294 AVG

Now let’s look at both Pence and Gonzalez since 2008, per 162 games played:

162 G, 686 PA, 176 H,   90 R, 25 HR, 91 RBI, 14 SB, .280 AVG—Hunter Pence

162 G, 662 PA, 177 H, 103 R, 29 HR, 98 RBI, 24 SB, .294 AVG—Carlos Gonzalez

Given the same amount of playing time, Carlos Gonzalez beats Hunter Pence across the board. Gonzalez is the guy that you can dream on to achieve the big, round numbers mentioned above. In the real world, though, despite his inferior statistics on a per-plate appearance basis, Pence has been the more valuable fantasy outfielder because of his durability.

So, what about 2015? How much does Pence’s broken arm affect his fantasy value?

I created dollar values using composite projections from Fantasy411.com (a combination of 12 sources). These projections are based on a 12-team league with 21 players, including 9 active hitters (no MI or CI), 7 active pitchers (2 SP, 2 RP, 3 P), and 5 bench spots. There were 63 outfielders projected for positive value (a little more than 5 per team). Using these projections, a healthy Hunter Pence is projected for the following stats:

644 PA, 159 H, 81 R, 20 HR, 82 RBI, 12 SB, .270 AVG

This puts him #12 among outfielders, but a dollar more in value would move him as high as ninth and a dollar less would drop him to 15th, so you could say he’s in the 9-15 range when it comes to outfielders. Others in that same range based on these projections are Ryan Braun, Jacoby Ellsbury, Corey Dickerson, Matt Kemp, Justin Upton, and Matt Holliday. With these stats (per this set of projections), Pence would be a late fourth-round pick.

Healthy Hunter Pence

$21

#12 OF (range is from 9 to 15)

Late 4th round

Comparable to: Ryan Braun, Corey Dickerson, Matt Kemp, Justin Upton

This year we know Pence will miss some time. The initial estimates say six to eight weeks until he’s ready to play. Pence seems to me to be the type of guy who will do whatever he can to get back on the field as soon as possible. In fact, I can’t imagine Pence could sit still for five minutes, let alone an entire baseball game. He’s probably going to drive his teammates crazy.

So let’s say Pence misses the month of April. That leaves him with five months of playing time. Some simple math would suggest the injured Pence will get 83% of the playing time a healthy Pence would get, so we’ll pro-rate his projection above to 83% of the playing time:

535 PA, 132 H, 68 R, 17 HR, 68 RBI, 10 SB, .270 AVG—83% of the season

Losing a month of playing time drops Pence’s value into the mid-30s among outfielders, around such players as Brandon Moss, Denard Span, Marcell Ozuna, and Alex Rios.

Injured Hunter Pence (missing one month of the season)

$9

#36 OF (range is from 33 to 39)

Early 13th round

Comparable to: Brandon Moss, Denard Span, Marcell Ozuna, Alex Rios

But wait, there’s more! We know Pence will miss time. It could be a couple weeks, it could be a month, it could be a month-and-a-half. We also know that we can replace him for that time, so we can factor in his replacement to get a better value for Pence. If you drop him all the way down to 83% of his projected stats, he drops too far on your cheat sheet and you’ll never acquire him.

Let’s factor in the value of a replacement outfielder for the time Pence is going stir-crazy on the Giants’ bench. Based on the composite projections from Fantasy411, the first five replacement outfielders are Michael Saunders, Michael Morse, Curtis Granderson, Angel Pagan, and Dexter Fowler. If you combine the stats for these five players and pro-rate them to one month’s worth of playing time, you get the following:

87 PA, 20 H, 11 R, 2 HR, 9 RBI, 2 SB, .258 AVG—Pence one-month replacement

Add this to our “83% of the season” numbers for Pence from above:

535 PA, 132 H, 68 R, 17 HR, 68 RBI, 10 SB, .270 AVG—83% of the season

And we get:

622 PA, 152 H, 78 R, 19 HR, 77 RBI, 12 SB, .268 AVG—Pence + Replacement

This batting line moves Pence back up the rankings. He becomes the #20 outfielder, in the range of Alex Gordon, Nelson Cruz, and Jason Heyward.

Injured Hunter Pence + Replacement Player for One Month

$17

#20 OF (range is from 18 to 23)

6th round

Comparable to: Alex Gordon, Nelson Cruz, Jason Heyward

Of course, your numbers may vary, but the process is the important part. A healthy Hunter Pence is a late 4th-round pick. An injured Hunter Pence with no replacement is an early 13th round pick. An injured Hunter Pence with a replacement player for one month is a mid 6th round pick.

The recent injury to Hunter Pence hurts his value, but he could still be someone to target if other owners shy away from him and he’s still around in the 7th round or later.


K-BB vs. the RotoGraphs Top Starting Pitcher Rankings

Back on January 1, I wrote an article proposing a “quick-and-easy” way to rank starting pitchers for fantasy baseball. The TL; DR (Too Long; Didn’t Read) summary is that you can take the projections of your starting pitchers and rank them by the simple metric “strikeouts minus walks” (K-BB). I also looked at slightly more complex metrics like “strikeouts minus walks minus home runs” (K-BB-HR) and “strikeout rate minus walk rate, divided by games started” (K%-BB%/GS) and both of those had a slightly better correlation, but are not as simple.

The correlation between the starting pitcher rankings based on K-BB and starting pitcher rankings based on dollar values was around 0.80 for each of the last three years.

At the time, I created a list of the top starting pitchers based on Steamer projections, as those were the only readily available projections out there. Now that we’re getting closer to the season, more projections are available. At Fantasy411, they have a downloadable spreadsheet with the composite projections from 12 different providers. It’s a true “wisdom of the crowds” approach.

Using this collection of projections, I ranked the starting pitchers using the very simple K-BB metric and compared those rankings to the consensus rankings for starting pitchers on the updated RotoGraphs Top 300. I downloaded the spreadsheet from the post on February 17th by Paul Sporer where he explained that players not ranked by a writer would get a “last ranked+1” for that particular player. There were 87 starting pitchers ranked in the Top 300. [Note: I would have used K-BB-HR but the composite projections did not have home runs allowed for pitchers]

First off, the correlation between the RotoGraphs Top 300 rankings for these 87 starting pitchers and my rankings based on K-BB came out to 0.81. Also, 46 of the 87 pitchers (53%) were within 12 spots of each other on the two lists, or the equivalent of one round in a 12-team league. Seventy-four of the 87 pitchers (85%) were within 24 spots of each other, the equivalent of two rounds in a 12-team league.

The charts below show the starting pitchers based on the RotoGraphs Top 300, along with their rank by K-BB, the difference between the two, and the composite projection from the Fantasy411 sources for selected pitchers who were off by a significant number of picks. By looking at the projections for these pitchers, we may better understand why the rankings differ so much.

The Top 20:

Most of the pitchers in the top 20 are similarly ranked by the RotoGraphs’ Five and the K-BB method. Just one of these 20 pitchers has a rankings difference that is off by more than 12 (one round in a 12-team league). Carlos Carrasco has the biggest difference in this group of pitchers between his K-BB rank of 44th and his RotoGraphs’ rank of 16th. Carrasco is a popular sleeper. He’s such a popular sleeper that he’s probably no longer a sleeper. I think most people are wide-awake on Carlos Carrasco by this point. The composite projection has Carrasco down for 156 innings in 2015. Steamer projects 163 innings, ZiPS has him for 119, and the optimistic Fans are projecting 191 innings, which is more than Carrasco has pitched in the last two seasons combined.


The Next 20 (21-40)

There are more differences as we move down the list of starting pitchers. Sonny Gray (ranked 25th by RotoGraphs, 47th by K-BB) is an interesting guy to look at. For his career, Gray has a 2.99 ERA and 1.17 WHIP, but his FIP is 3.39, xFIP is 3.34, and SIERA is 3.44. Gray’s ERA and WHIP have been helped by a .277 career BABIP. That’s quite low, but Oakland as a team allowed a .276 BABIP in 2013 (2nd best in baseball) and .272 BABIP in 2014 (tops in baseball). If you expect that to continue, then Gray is probably better ranked by the RotoGraphs Five. Steamer (3.75 ERA, 1.29 WHIP) and ZiPS (3.36 ERA, 1.26 WHIP) are not so optimistic.

Phil Hughes’ impressive ability to limit bases on balls might have him ranked too highly by K-BB.

Andrew Cashner has the second largest difference between his ranking by K-BB (81st) and RotoGraphs (37th) of any pitcher in the RotoGraphs Top 300. Cashner has a history of injuries and he’s on record as saying he’s focusing more on getting quick outs than strikeouts. Over the last two seasons, his K% has been 18.1% and 18.4%. That 18.4% mark last year placed him 80th among pitchers with 120 or more innings. His 5.7% BB% placed him 41st and that was the best BB% of his career. Looking at just strikeouts and walks it’s easy to see why Cashner is ranked by K-BB among pitchers like Matt Cain and Jon Niese rather than Cliff Lee and Zack Wheeler (Cashner is between those two in the RotoGraphs starting pitcher rankings).


The Next 20 (41-60)

Garrett Richards’ composite projection calls for 137 strikeouts in 160 innings, which comes out to a 7.7 K/9. Steamer and ZiPS both project Richards to strike out around 8.2 batters per nine innings. If Richards’ composite projection is upped to a strikeout rate of 8.2 K/9, he would move up to 64th on the K-BB list.

Dallas Keuchel was very successful last year, posting a 2.93 ERA and 1.18 WHIP despite a middling strikeout rate (6.6 K/9). He succeeded last year with a terrific ground ball rate (63.5%) and by allowing far fewer home runs than he had in his first two years in the big leagues. The K-BB metric ranks Keuchel 77th among starting pitchers based on the two things a pitcher has the most control over.

Justin Verlander and Ian Kennedy are the two pitchers with the biggest difference in rankings in favor of K-BB over the RotoGraphs Five rankings and Drew Hutchison and Scott Kazmir are both in the top seven. Verlander is coming off an ugly 4.54 ERA, 1.40 season in which his strikeout rate dropped just below 7.0 K/9 after being around 9 K/9 for the bulk of his career. The composite projection expects his strikeout rate to go back up to 7.7 K/9 and his ERA to come down close to his 2014 FIP of 3.74. With a projection of 208 innings, Verlander is ranked 25th by K-BB, 34 spots ahead of where he’s ranked by the RotoGraphs’ writers. Similarly, Ian Kennedy is ranked 23rd by K-BB and 55th by RotoGraphs. He’s coming off a better year than you might realize, with 9.3 K/9 and a 3.21 FIP, but a 3.63 ERA.


The Final 27 (61-87)

In this final group of pitchers, the guys that K-BB likes much more than the RotoGraphs’ writers include John Lackey, Mike Minor, and A.J. Burnett. It’s possible that Lackey (36 years old) and Burnett (38 years old) were ranked lower by the RotoGraphs’ writers because of expected age-related decline. Also, Burnett had a 4.59 ERA and 1.41 WHIP with the Phillies in 2014. The composite projection may be looking at the 38-year-old Burnett through rose-colored glasses when he’s projected for 195 innings and an ERA below 4.00, but he has pitched an average of 202 innings over the last seven years and had 213 2/3 innings last season. Like Burnett, Minor is coming off a terrible year—4.77 ERA, 1.44 WHIP, which has him ranked 77th by the RotoGraphs Five. As bad as his results were in 2014, Minor’s strikeout rate was in the range of his two previous seasons and his walk rate was only slightly worse than his career mark. After the season he just had he’s a potential buy low candidate based on K-BB.

The three pitchers in this group who are much higher ranked by the RotoGraphs writers are James Paxton (the biggest difference in ranking of all the pitchers on this list), Tanner Roark (4th largest difference), and Henderson Alvarez (5th largest difference). Paxton (143 innings) and Roark (122 innings) have low playing time projections that limit their K-BB value. Henderson Alvarez is projected for a solid 182 innings, but with a projected strikeout rate of just 5.3 K/9 he gets little love from the K-BB metric.

This comparison included all 87 pitchers who were ranked in the RotoGraphs Top 300. The following pitchers are among the top 87 when ranked by K-BB and don’t show up on the RotoGraphs Top 300:


#60 CC Sabathia

#69 Wade Miley

#74 Bartolo Colon

#79 Yovani Gallardo

#81 Bud Norris

#84 Jon Niese

#84 Ricky Nolasco

#86 Trevor Bauer


I plan to revisit this at the end of the year. I’ll compare the RotoGraphs’ rankings and the K-BB rankings for these 87 pitchers to the actual end of season dollar value rankings for starting pitchers in 2015.