Archive for Strategy

2017 Team WAR Projections and Playoff WAR Targets

Now that the World Series is over and the offseason upon us, our view of baseball begins to shift. For the last six months we have been laser-focused on the outcomes on the field. Now we begin to focus on the process of team-building and the chase to taste October Glory.

This exercise is an attempt to figure out how close teams may be and what they need to add in in the offseason to reach the playoffs. To do this, I looked at the latest FanGraphs depth charts, and the WAR landscape looks something like this:

Team 2017 Projected WAR

Cubs 50.1
Dodgers 48.7
Nationals 45.3
Indians 43.2
Red Sox 42.5
Giants 41.1
Astros 40.2
Cardinals 39.1
Angels 38.3
Mets 37.5
Mariners 37.2
Yankees 36.9
Pirates 36.6
Tigers 34.2
Rays 33.8
Rangers 33.5
Blue Jays 32.5
Marlins 32
Orioles 31.9
White Sox 31.1
Royals 30.7
Athletics 30.7
Diamondbacks 30.3
Rockies 27.7
Twins 27.7
Reds 26.5
Phillies 26.1
Padres 23
Braves 22.9
Brewers 21.6

To the surprise of no one, the Cubs lead in projected WAR due to the excellent core in place, with the Dodgers and Nationals taking second and third, respectively. The Indians and Red Sox rank fourth and fifth on this list and represent the top of the American League.

Now, to get a feel for what it is likely going to take to make the playoffs in 2017, I approximated how much team WAR will be needed to make the 2017 playoffs by averaging the WARs of playoff qualifiers going back to 2012 and came up with this:

AL WAR Target: 42.0
NL WAR Target: 44.6

American League teams, when assessing whether they are a realistic playoff contender, should project for a team WAR of 42, and National League teams thinking the same should project for closer to 45. Next, I took the projected WAR from each team and subtracted it from the respective league’s WAR target to determine how close teams may or may not be:

Team Target WAR +/-

Cubs 5.5
Dodgers 4.1
Indians 1.2
Nationals 0.7
Red Sox 0.5
Astros -1.8
Giants -3.5
Angels -3.7
Mariners -4.8
Yankees -5.1
Cardinals -5.5
Mets -7.1
Tigers -7.8
Pirates -8.0
Rays -8.2
Rangers -8.5
Blue Jays -9.5
Orioles -10.1
White Sox -10.9
Royals -11.3
Athletics -11.3
Marlins -12.6
Diamondbacks -14.3
Twins -14.3
Rockies -16.9
Reds -18.1
Phillies -18.5
Padres -21.6
Braves -21.7
Brewers -23.0

We see that only five teams exceed the arbitrary threshold of projecting above an average playoff contender. For a team like the Astros and Giants the decision to go for it is obvious. The Giants and Astros have payroll available and solid player development. Interestingly enough, the Angels are closer than one might initially think, but that has more to do with Mike Trout than the cast around him.

Moving toward the middle of the graph is where things begin to get intriguing. With the cost of 1 WAR on the open market approximately $8 million and the trade market expected to be active and expensive, teams need to be realistic with how much they are willing to spend, in cash or prospects, in order to reach the projected WAR threshold. Fringe contenders like the Pirates, Blue Jays and White Sox need to look in the mirror and recognize the uphill battle they have. The Blue Jays are losing key pieces to free agency and they could potentially cripple their flexibility with ill-advised moves. The Pirates are staring up at the Cubs dynasty in the making and you wonder if it is time to shop Andrew McCutchen and other short-term pieces. Lastly, the White Sox have Chris Sale, Jose Quintana, Todd Frazier and other quality pieces around the diamond. Given the AL Central, the Sox could blow it up and return to contention sooner rather than later, with the Royals and Tigers’ windows closing and the Indians representing the class of the division.

As we know, it rarely plays out this cleanly on the field, but from a pure projections standpoint, this serves as a gauge to where teams currently are. Some teams have very easy decisions and the choice to contend or rebuild is obvious. For other teams, the decision is less clear, and failure to capitalize could leave them stirring in mediocrity. The Cubs and Indians will fortify their rosters to chase down another pennant. For teams like the Pirates and White Sox, it just might be time to hit the red button.


The Small Things Do Matter: Lack of Hustle by the Cubs

Despite their World Series Game 5 win, the Cubs came under fire Monday morning for their lack of hustle. On Mike & Mike ESPN Radio, Mike Greenberg commented that the Cubs seem to be lacking hustle, as evidenced by slow home-plate-to-first-base times by Jorge Soler on his Game 3 triple and Anthony Rizzo on his Game 5 double. Soler assumed a fly out or foul ball, and Rizzo assumed a go-ahead home run. Buster Olney added, “It’s interesting you say that, because I had a conversation with one of the veterans in this World Series…and that’s exactly what he said. ‘This is the World Series, how can that happen? It’s a different generation.’”

That’s right, this is the World Series, the biggest baseball stage, the postseason when even average fans tune in to watch and learn from some of the best players in the game. In today’s baseball market worth billions, where players in their late teens and early twenties are paid 10 or more times the average American salary, maybe a lapse in hustle or a hard 90-time is acceptable, if not necessary, during the regular season of 162 games in order to avoid injury or excessive exhaustion. You wouldn’t want your star player pulling a hamstring on a routine infield groundball in August, would you? Of course not. But c’mon, this is the World Series! Most of these players have never played for higher stakes. Is the “lack of hustle” a generational problem? What ever happened to the commitment Joe DiMaggio had to playing hard just in case someone was watching for the first or last time?

Your organization hasn’t won a title in 108 years. Why wouldn’t you approach every play as if it was the last? You’d think they would in the World Series; especially given Game 5 could have been the last. Greenberg and Olney failed to even mention Javier Baez’s Game 5, second-inning strikeout where he refused to run to first base on a dropped third strike, looking increasingly frustrated with his World Series offense (2 for 18 with 7 strikeouts, and 16 runners left on base after that at bat).

Let’s take a look at some numbers by analyzing the Win Expectancy (WE) for the Cubs before and after each of these three plays (Soler’s triple, Baez’s strikeout, and Rizzo’s double) to show the importance of maximizing every opportunity and play. These three players were caught up in the moment and took things for granted on the biggest stage of their sport, a time when small mental errors could make the ultimate difference in winning a game and the championship. We’ll also look at the WE if each play had ended with a different outcome. All WE are obtained from The Book: Playing the Percentages in Baseball, by Tom Tango, Mitchel Lichtman and Andrew Dolphin.

Jorge Soler (Age 24)

Game 3, Series tied 1-1

Bottom 7th, Cubs trailing 1-0 with 2 outs

Triple to right field

WE before at bat: 29.1%

WE after triple: 35.0%

WE after next batter ends inning 26.5%

For the sake of this article, let’s assume (which is assuming a lot with an inside-the-park home run) Soler runs hard out of the batter’s box and rounds the bases for an inside-the-park home run, tying the game. The WE for the Cubs would have jumped to 52.2%, a major swing (nearly double) from where that inning ended. The Cubs lost that game 1-0 to give the Indians a 2-1 series lead.

Javier Baez (Age 23)

Game 5, Indians leading series 3-1, Cubs one loss from elimination

Bottom 2nd, Cubs trailing 1-0 with 2 outs and a runner on 1st

Strikeout, dropped third strike (ball in dirt), Baez does not run to 1st base

WE before at bat: 41.9%

WE after strikeout: 39.4%

Again, for the sake of this article, let’s assume Baez runs hard to first on the dropped third strike and reaches base, which rarely ever happens in Major League Baseball. However, this is the World Series and Game 5 is an elimination game. You never know what can happen. Though the data for the number of baserunners reaching on a dropped third strike isn’t available, such instance would be scored with either a passed ball or wild pitch on the play (a battery error). Take a look at the number of passed balls and wild pitches in MLB over the past 10 seasons, as provided by Baseball Reference.

Year Passed Ball (per game) Wild Pitch (per game)
2016 0.08 0.37
2015 0.07 0.36
2014 0.07 0.35
2013 0.07 0.36
2012 0.08 0.32
2011 0.07 0.32
2010 0.06 0.34
2009 0.06 0.33
2008 0.06 0.32
2007 0.07 0.31
Average 0.069 0.338

A catcher is scored with a passed ball on average every 14-15 games, while a pitcher is scored with a wild pitch on average every third game. If anyone can provide data for the number of times a batter has reached base on a dropped third strike, it would only strengthen the claim that Baez’s chances of reaching base were slim. Regardless, remember it’s an elimination game in the World Series. For the sake of proving a point, let’s look at the scenarios if Baez had reached base.

The ball did skip quite a distance from catcher Robert Perez, so let’s take a look at WE if Baez reached first, leaving the Cubs with runners on first and second with 2 outs: 44.1%.

How about if Roberto Perez threw the ball away into right field, causing a 1st and 3rd situation (let’s note that catcher errors are also very rare): 45%.

Even though Baez reaching first base on a dropped third strike (which was far from guaranteed by running) would have only added about 5-6% to the Cubs WE, there is no excuse for Baez to have a lapse of effort and allow Perez an easy, no-pressure throw to first base because there was no runner hustling down the line. At the very least, run hard and make it look good for the millions of people watching. Not to mention the thousands of people who spent a week’s wage on tickets to Wrigley. They, along with your teammates, want to see you running to first base instead of walking back to the dugout.

Instead, the Cubs were left with their two weakest hitters (David Ross and Jon Lester) to lead off the next inning, which resulted in a 1-2-3 inning for Indians starting pitcher Trevor Bauer, who took a 1-0 lead into the fourth inning.

Anthony Rizzo (Age 27)

Game 5, Indians leading series 3-1, Cubs one loss from elimination

Bottom 4th, game tied 1-1, 0 outs, first batter after Kris Bryant game-tying home run

Double to right field

WE before at bat (after Bryant home run): 56.3%

WE after double: 63.4%

The back-to-back extra-base hits certainly turned the momentum of the game in the Cubs’ favor. Two batters (Bryant and Rizzo) increased the Cubs’ WE from 43.7% to 63.4%, a major increase in a game they eventually won 3-2 to force a trip back to Cleveland for Game 6.

A better throw from right field would have made a very close play at second base, so let’s look at the WE for the Cubs had Rizzo been thrown out at second base on his hit off the right-field ivy: 53.4%. His lack of hustle from home plate to first base, as he admired what he thought was a go-ahead home run, could have cost the Cubs 10% on their WE.

Conclusion

There is certainly no guarantee that any individual exertion of hustle will lead to a different outcome in a baseball game. Running out a groundball will not guarantee an infield hit, but it puts pressure on the fielder to make a clean play. Running hard on a fly ball has no measurable effect on whether a fielder will catch it or not, but it puts the runner in the best possible position to advance an extra base on a rare dropped ball. Running hard to first base after a dropped third strike does not make a difference in the outcome of the play 99% of the time, and it certainly doesn’t change the 0-for-1 with a strikeout in the box score. But it puts pressure on the catcher to retrieve the ball in a clean manner and make an accurate throw to first base. Let’s not forget that hustle is the right thing to do. It’s more about the precedent, not the result. It’s about the example we want MLB players on the biggest stage to set for younger players worldwide. DiMaggio likely wouldn’t recognize some aspects of today’s game. He, like many other players, never took anything for granted. Despite the fact that Soler and Rizzo still ended up with extra-base hits, and Baez most likely would have been thrown out at first base anyway, shouldn’t we hope that on this kind of stage the very best will play the game to its absolute potential?


The Case for No Starting Pitchers in the National League

I’ve watched many a baseball game over my lifetime (that’s 50+ years), and I’ve cringed every time I see a National League manager send his starting pitcher up to bat any time prior to the seventh inning. Especially with runners on base! Doesn’t he know that pitchers can’t hit? Doesn’t he know that if he would just pinch-hit for the lame-batting starter he’d improve his team’s chances of winning?

So, after years of pondering this problem for five seconds at a time every couple of days, I decided to see if I could build a solid quantitative case for never letting a pitcher come to the plate for a National League team (obviously this is not an issue for the American League with their designated hitters). How would this change the look of the team’s pitching staff? And more importantly, how many more games would a team expect to win in a season if they adopted a “pitchers never bat” strategy?

The answer to the first question is pretty easy. The staff would “look” different. There were would be no more “starting pitchers.” A team’s pitching staff would consist only of “relievers.” Sure, one of the “relievers” would throw the first pitch of the game and could technically be called a “starter,” but given that he’ll be taken out of the game as soon as his spot in the batting line-up comes up, he’s effectively a “reliever,” just like the other 10 or 11 guys on the staff.

Now, the conventional wisdom would say that the current starting pitchers, especially the “aces,” get in a groove, and can give you six or seven solid innings. Why would anyone take them out the game in the second or third inning? Well, let’s do a “cost-benefit” analysis and see if we can make a case for “The Pitchers Never Bat” strategy.


Key Components of the Case:

The two primary components of the analysis are 1) how many more runs would a team expect to score in a season by pinch-hitting for every pitcher, and 2) how many more runs would a team expect to give up in a season because their starting pitchers are no longer going six, seven, or more innings in an outing? Or, maybe the team adopting such a strategy would actually give up FEWER runs per year by giving up on the century-old strategy of planning for the starting pitcher to pitch deep into the game.

A third component of the analysis could include the benefit of being able to choose from any of the team’s entire staff (probably 11 or 12 pitchers) and use only the ones that look like they’ve got their “stuff” while warming up before the game, instead of sticking with the “starter” who is scheduled to pitch today because it’s his turn in the “rotation.”

A fourth component of the analysis could include the benefit a team could achieve because the other team can no longer stack their starting batting order with a lot of lefties (to face a right-handed starter), or with lot of righties (to face a left-handed starter), because the team with no “starters” will pinch-hit for their first pitcher after one, two, or three innings. So, in total, the “handedness battle” tilts slightly more in favor of the team implementing the new strategy.

A fifth component could include the cost (or benefit) of reducing the size of the pitching staff by one or two, and adding one or two more everyday players, who would be needed to pinch-hit in the early innings.

A sixth component could be an added benefit that batters will not be able to get “used to” a pitcher by seeing them multiple times in a single game. Under the new strategy batters will see each pitcher once, or, at most, twice in a game.

I’m going to focus on the two primary components above, and let the lessor components alone for now. Perhaps others can weigh in on how to quantify the potential impacts of these changes.


Component #1: How much more offense will the “Pitchers Never Bat” strategy create?

This is the easiest of the components to quantify. I will use the wOBA (weighted On Base Average) statistic as defined and measured by FanGraphs to evaluate this component. Let’s start with some basic information and rules-of-thumb.

Using data from the National League for the 2015 season I find that pinch-hitters have a wOBA of .275 across the entire league, while pitchers, when batting, had a wOBA of just .148 across the entire league. The difference in wOBA between pinch-hitters and pitchers is .127 (that’s .275 minus .148.) Note that all position players in the NL combined for an average wOBA of .318 in 2015. I’m assuming that our new pinch-hitters won’t get anywhere near that figure, but will be comparable to the 2015 pinch-hitters, who came in way lower, at .275.

Now, let’s assume we can replace every pitcher’s plate appearance (PA) with a pinch-hitter. This improvement of .127 in wOBA needs to be applied 336 times per season, because that was the average number of times that a National League team sent their pitchers up to the plate in 2015. And lastly, we need to know two rules of thumb from FanGraphs that are needed to complete the analysis of the first component: 1) every additional 20 points in wOBA is expected to result in an additional 10 runs per 600 plate appearances, and 2) every 10 additional runs a team expects to score in season translates into one additional win per year. OK – so, let’s do the math:

If 20 additional points of wOBA translates into 10 runs per 600 PA, then our new pinch-hitters who are now batting for pitchers will provide the team with 63.5 incremental runs per 600 PA (which equals 127/20 * 10.) And since these pinch-hitters will be coming to the plate 336 times, not 600 times, we need to reduce the 63.5 incremental runs per season down to 35.6 incremental runs per season (which is 336 / 600 * 63.5).

Finally, the last step is to take our 35.6 incremental runs per season and translate that into incremental wins per year using the rule-of-thumb that ten runs equates to one win. Therefore, our 35.6 extra runs results in an expected 3.6 incremental wins per year. That’s a decent-sized pick-up in expected wins.

OK, so now, what about the pitching staff? Will replacing the conventional pitching staff with a staff consisting of no starters and all relievers cause the runs allowed to increase, and if so, by how much? Enough to offset our 3.6 extra wins that we just picked up on offense?


Component #2: How many more runs will pitchers give up using the “Pitchers Never Bat” strategy?

Imagine, for the moment, that a GM is to build his pitching staff from scratch. (We’ll worry about how to transition from a conventional staff to an all-reliever staff later.) And let’s just assume he’ll pick just 11 pitchers. (Most NL teams use 12-man staffs while some use 13, so that will give the team one or two additional position players.) Currently, starting pitchers typically throw 160-200 innings per season, and relievers tend to throw 50-80 innings per season. But with the new all-reliever strategy, and using only 11 pitchers, each of our new guys will need to average around 130 innings each, with perhaps some pitching as much as 160, and some as low as 100 innings per year. So, the GM is looking for 11 guys who can each contribute 100-160 innings per season. Each outing will be for about one to three innings for each pitcher. How will they fare?

Let’s look at the National League’s pitchers for 2015. Starting pitchers had an aggregate WHIP (Walks Plus Hits per Inning Pitched) of 1.299, while relievers, in total, recorded an identical WHIP of 1.299. So my takeaway from this is that the average starter was equally as good (or bad) as the average reliever. From this, I am going to take a leap of faith, and assume that a staff of 11 new-style relievers could be expected to perform equivalently. (And that doesn’t even factor in some of the lesser elements of the new strategy, as mentioned above, such as Components 3 and 4 of the analysis.)

From this, albeit simplified, evaluation of Component #2, I estimate that a team moving to an all-reliever pitching staff will have an expected change in Runs Allowed of zero, and therefore the change will neither offset, nor supplement, the offensive benefit evaluated in Component #1.


Conclusion and Final Thoughts

In summary, using the two primary components of my analysis, I estimate that adopting a “Pitchers Never Bat” strategy in the National League (a.k.a. an “All Reliever Pitching Staff” strategy) will improve a team’s offense by an expected 36 runs per year, which will increase the team’s expected win total by 3.6 games. I estimate that the impact on runs allowed will be near zero. Some lesser elements, Components #3 through #6, could also add some additional value to the strategy.

Implementing the strategy does not necessarily need to be a complete, 100% adoption of the “pitchers never bat” rule. Modifications can be made. Perhaps a pitcher is doing well through two innings and comes to bat with two out and no one on base. In this case the manager could let the pitcher bat, so that he can stay in and pitch another two or three innings. This would change the name of the strategy to something like the “Pitchers Very, Very Rarely Bat” strategy.

As far as transitioning to an all-reliever staff from a conventional staff, it could be done over time, or only in part, such that a team could maintain, say, its two top aces, and complement them with eight or nine relievers. This way, the aces could pitch as they do now, going six-plus innings, every fifth day, while limiting the “Pitchers Never Bat” strategy to the three out of the five days when the two starters are resting.

Finally, let’s try to put a dollar value on this new strategy. The guys at FanGraphs, and other places, have tried to estimate how much teams are willing to pay for each additional win. Without going into all the various estimates and approaches at trying to answer that question, let’s just go with a simple $8 million per win. I’m sure it could be argued to be more or less, but let’s just put $8 million out there as a base case. If that’s true, a 3.6-win strategy, such as the “Pitchers Never Bat” strategy, is worth about $29 million per year. Go ahead and implement the strategy now, and, if it takes, say, three years before any of the other NL teams catch on, you’ve just picked up a cool $87 million (3 * 29 million).

And if the other components of the analysis (#3 through #6) are quantified and it can be determined that they add another 0.5 wins per year, which I think is quite doable, then we can get the total up to 4.1 wins per year, for a value of $33 million per year, or just around a cool $100 million over the first three years. And that’s how you make $100 million without really trying!


Should David Ortiz Play First Base In the World Series?

I have the mixed blessing of living in New England, so I unavoidably run into local sports radio once in a while. They’re already looking ahead to the Red Sox’ inevitable World Series appearance, and of course given David Ortiz’s unprecedented combination of offensive skills and just incredible foot pain/immobility, there’s a legitimate question of whether the Red Sox should play him in the field when they lose the DH in World Series road games. Just a quick-hit here on some of the relevant numbers.

I’m not going to address in this article the extent to which playing the field might limit his ability to hit or run. I don’t dispute that that could be significant, but I have no idea how to value that.

The way I see it, there are three options:

1. Move Hanley Ramirez over to 3B, play Ortiz at 1B, take Travis Shaw out of the lineup.
2. Replace Ramirez with Ortiz at 1B, keep Shaw.
3. Don’t start Ortiz, but do pinch-hit with him in a high-leverage situation.

We’ll make the following assumptions: I’m going to estimate that Ramirez will have the same defensive value at 3B that he had last year in LF (-22.9 runs), and I’m going to further estimate that Ortiz will have the defensive rating of some of the worst 1Bs in baseball over the past few seasons (-25 runs). Travis Shaw was worth 6.6 runs of defense playing mostly 3B this year. Ortiz was worth 27.6 runs of offense + baserunning, Ramirez 17.1, and Shaw -10.3. We’ll estimate that playing Ortiz would get him 4.4 plate appearances per start, whereas if he doesn’t start, he gets one plate appearance in a situation that has a leverage index of 2.

Scenario 1: Ortiz gives you 2.6 runs at 1B, Ramirez -5.8 runs at 3B, total of -3.2 runs.
Scenario 2: Ortiz gives you 2.6 runs at 1B, Shaw -3.7 runs at 3B, total of -1.1 runs.
Scenario 3: Ramirez gives you 1.8 runs at 1B, Shaw -3.7 runs at 3B, and Ortiz gives you 27.6*(1/4.4)*2 = 12.5 runs at PH, total of 10.6 runs.

Seems like the best option here by a decently wide margin is to use him as a pinch-hitter, and I’m surprised at how much of the value comes from just the pinch-hit appearance. Fairly robust to my assumptions, too — if you assume a leverage index of 1 in his one plate appearance, you still get the highest total with Ortiz as a PH. You could also give him a defensive rating of -15 (which would be incredibly generous) and the PH scenario comes out on top. Anything else I’m missing? Other lineup options for the Red Sox?


Paul Goldschmidt Has a Pop-Up Problem

When we were growing up, my dad would sometimes refer to my sister and me as ingrates. I always had a sneaking suspicion that statement was ruthless. I was young and under the assumption that he provided us everything we needed and wanted because that was what he was designed to do. In a sense, that perception of him probably does reflect the “ungratefulness” that young children tend to posses, innocent as it may be, what with a child’s inherently feeble comprehension of interpersonal relationships. I am now the parent of a two-year-old boy and just the other night he saw a commercial for a Power Wheels Jeep Wrangler that elicited the following outburst:

“I want to go in there!”

“I want one!”

Finally he turned to peer into my eyes and, in order to accentuate the severity of his next mandate, he raised his index finger and spoke;

“Daddy, better buy me one.”

His tone became dramatically more somber than it had been for the first two exclamations, and it made me laugh the hardest. I am certain I was the narrator of many statements similar to this as a kid, but the reality is, when kids are given everything they want, it’s up to the parent to understand that if there is a perceived lack of gratitude, it is a direct byproduct of the parent’s efforts to make them happy or even to keep them alive.

Lately I’ve been thinking of how I can be really ungrateful for even truly fine baseball seasons. Even some All-Star seasons disappoint me, and I know I’m not alone. If Mike Trout was in the middle of putting up a 5-win season, we’d all be talking about what could be wrong with Mike Trout. When players set the bar so ridiculously high we tend to hold them to that standard for better or worse. As an actual example, it’s completely understandable to be disappointed by Bryce Harper’s 2016 season after last year’s masterpiece. The reality is, however, that he’s 23 and has currently produced 3.4 WAR. His baserunning and defense have been positives and he’s compiled over 20 home runs and 20 stolen bases while hitting 14 percent better than league average; that’s damn fine and yet it’s still a damn shame.

Paul Goldschmidt, meanwhile, is hitting .301/.414/.494 and has accrued 4.7 WAR and might surpass 30 SB this year. His 136 wRC+ is still great even if it’s not quite the 158 he’s put up over the last three seasons. So why do I feel the loathsome inklings of disappointment bubbling inside of me? Firstly, and admittedly shallow of me, I like my Goldschmidt with more extra-base hits. For the first time in his professional career, at any level, Goldschmidt’s ISO starts with a number under 2. It’s possible he has a nice final week and brings that number up into the .200 range, but there are still some potentially concerning blips in his batted-ball profile that could portend of further decline in production. What I’m referring to most specifically, as the title suggests, is that Paul Goldschmidt has developed a pop-up problem.

From 2011 through 2015, Goldschmidt’s cumulative IFFB% was 4.8%. This year it sits at 14%. He has 17 IFFB this year, which is the same amount he had in the three previous seasons combined. Pop-ups aren’t good as they’re essentially as productive as a strikeout. Here are the 10 players with the biggest increases in IFFB% in 2016 compared to 2015 among qualified hitters in both years.

top-10-chart

I’m not suggesting there’s a positive correlation between popping up and performance, but it’s easy to make sense of some of the names that appear on this list. If you watched Josh Donaldson break down his swing on the MLB Network, you know that a lot of players are thinking about not hitting the ball on the ground because damage is done in the air. Did you know that DJ LeMahieu, at the time of this writing, has a higher slugging percentage than Goldschmidt? That’s bonkers. The league’s slugging percentage last year was .405, and this year it’s .418, but this group of players, minus Goldschmidt, have added, on average, 21 points to their slugging percentage, and part of that, for this group, has to be chalked up to putting more balls in the air.

popupsimprove

What I’m hoping to highlight is that what is even more troublesome for Goldschmidt is that he is the only player in this top 10 who had an increase in their IFFB% while also seeing his fly-ball rate and hard-hit rate drop.

goldschmidtpopsdown

So I have what could be an insultingly obvious hypothesis: since Goldschmidt has long been a quality opposite-field hitter, I am theorizing that pitchers are exploiting him with more fastballs up and in where he can’t quite get his hands extended. A cursory glance at his heat map vs. fastballs in 2015 and 2016 reveals a minor shift in approach by the league.


 goldschmidt-fb-2015goldschmidt-fb-2016

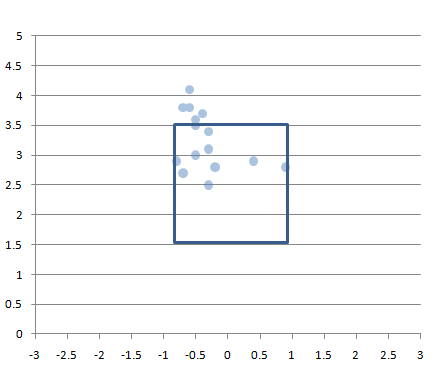
Besides the obvious, which is that pitchers are avoiding the zone even more than they had before, we can see just a bit more red in the specific zone I was referring to. It’s not so glaring or even enough information to make any conclusions, so let’s see if that area is where pitchers are getting Goldy to pop up. On the year, per Brooks Baseball, he has 22 pop-ups, 19 from fastballs and three from offspeed pitches. The 17 that are classified as IFFB by FanGraphs are plotted in the graph below.homemade-heatmap

*the two pitches towards the outside corner (for Goldschmidt) are sliders.

However, it’s not as if pitchers have previously avoided throwing Goldschmidt up and in; it just appears, despite his overall swing rate being at a career-low 39%, he’s upped his swing rate against fastballs by over five percentage points in that specific area just above 3.5 ft. And that area has the largest concentration of his pop-ups.  Looking at the entire area middle/up/and in to Goldschmidt, he has increased his swing rate from 57.2% in 2015 to 60.7% in 2016 while staying away from lower pitches in general. It’s a philosophy that is being echoed throughout baseball right now, and it is not at all a bad plan, but it has caused him, either deliberately or due the effect of swinging at these pitches more often, to go to the opposite field this season less than he ever has. This also is not necessarily a negative shift in regards to a batted-ball profile, but from 2013 – 2015 Goldschmidt was the fifth-most productive hitter in baseball going the other way, and in 2016 he’s 33rd. That represents a drop in wRC+ from 204 to 158, and from a .729 SLG (.329 ISO) to a .647 SLG (.255 ISO). I’ve long since regarded Goldschmidt to be in the same tier of hitters as Trout, Votto, Cabrera, and pre-2016 McCutchen, and it would be a shame for him to move away from a facet of his game that enables him to produce at that elite level.

At the end of this season I don’t think I’ll actually be all that worried about Goldschmidt; I can reconcile a 136 wRC+, even if it would feel a little disappointing. I wrote about Paul Goldschmidt last year and I wasn’t worried then, either. But I do think if I’m going to take a 136 wRC+ for granted I should place that appreciation toward the catalyst for this change in Goldschmidt’s performance, and a lot of that credit has to go to the pitchers who have induced 17 IFFB from a player who only averaged 5.7 over the last three seasons.

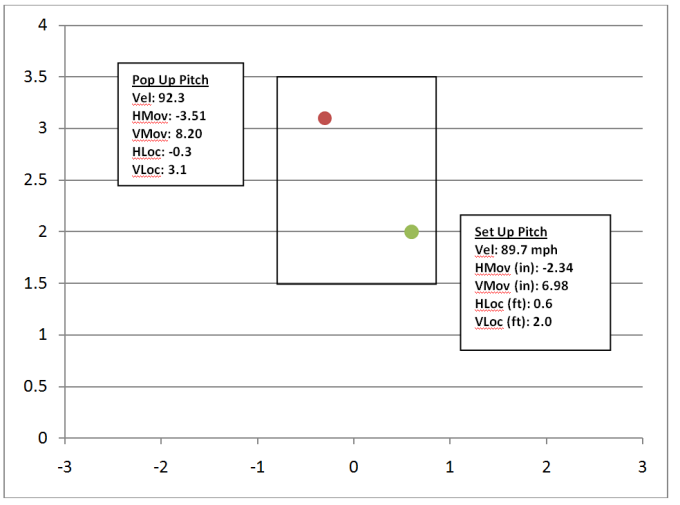
Now I know that setting up a pitch has so much more to do with an entire at-bat, game, or even season than the pitch that was thrown immediately before it, but for this exercise I want to look at the pitch that caused Goldschmidt to pop up and how it relates to the pitch thrown immediately before it. It’s crude and does not tell the whole story, but it still shows a definite approach — and, for all intents and purposes, it’s probably a decent representation of a general tactic used across the league for inducing pop-ups. I found all the data I needed using PITCHf/x at Brooks Baseball and I recorded the velocity, horizontal movement, vertical movement, horizontal location, and vertical location of each pitch Goldschmidt popped out on as well as the same data set for each set-up pitch if there was one (which would be in any situation where Goldschmidt did not pop up on the first pitch of an-bat). Below you’ll find a plot that shows the average location and characteristics of each pitch.

poppy-uppies

And here is that data in a table represented as the average difference between the two plot points.

pitchdiff

Doesn’t it make you feel warm when something fits into the shape you had pegged it to be? That’s just really simple and makes a hell of a lot of sense. Or maybe I feel warm for taking something that was disappointing and turning it into something I can really appreciate.  Now if you’ll excuse me, I have a Power Wheels Jeep Wrangler to buy.


The Twins Gave Up on Pitching to Contact Before We Did

For many Minnesota Twins fans, the recently vintage dominance of the AL Central that spanned seemingly the entirety of the first decade of the 2000s had been taken for granted. I, for one, am guilty of this, and like many fans, am starting realize that winning is not easy, although the Twins made it seem as easy as Torii Hunter made robbing home runs look effortless. Nostalgia aside, the Twins, and their fall toward mediocrity, are an interesting topic to look into. To some, they seemed a similar team to the Oakland Athletics (perhaps aiding in the creation of a post-season rivalry). The Twins, who were not quite as much of a small-market team as Oakland, seemed to develop from within. They had a deep minor system, so deep that when Johan Santana or Torii Hunter deemed it time to cash in, the Twins were able to find a quick replacement and continue their success. Santana, and Hunter, as well as Joe Mauer and Justin Morneau (who have both had their careers altered due to more recent concussions) and many other corner pieces, all made their debut in a Twins uniform and became cornerstones, yet they could never win the big playoff series.

They did not have the ability to flex the financial muscle that the Red Sox, Yankees, and even division rivals Detroit Tigers were capable of; however, they still managed to win the AL Central six out of the 10 years in the previous decade, including a loss in a playoff game to decide the division winner in 2008. The success carried into the Target Field era, represented by a beautiful ballpark that fans spent what seems like an eternity waiting for. After another disappointing playoff loss to the hated Yankees, the Twins entered 2011 looking to improve, with a similar roster and the intrigue of Japanese second baseman, Tsuyoshi Nishioka. That year was filled with injuries, and despite a post-All-Star Game push, the Twins ended the year with the worst record in the American League. Since then, the Twins have failed to reach the playoffs, and are currently battling with the Atlanta Braves for the worst record in baseball. Not to mention, long-time general manager Terry Ryan, the one credited with building the farm system leading to the team’s prior success, was fired on July 18th. Time to find out where the Twins went wrong.

Those successful Twins teams were always credited for their small-ball and defensive skills. With Joe Mauer behind the plate, Torii Hunter (replaced by Carlos Gomez, who could also flash some leather) and many other solid defenders manning the diamond, a lot of the Twins’ success was credited to this defense.

Yet the Twins were far from a one-dimensional team. The Twins had a solid pitching staff, including, most famously, Johan Santana, who was a two-time Cy Young winner with the club, before being sent off to New York. The Twins also produced one of the most exciting pitching prospects at the time in Francisco Liriano. Liriano’s career was marred by injuries, which led to his inconsistency. Despite Johan’s departure and Liriano’s ineffectiveness, the Twins’ pitching was still an effective unit. The Twins raised their pitchers not on the attractive strikeouts, but on “pitching to contact.” The premise behind this was that pitchers would attack the lower half of the strike zone, induce weak contact, and show excellent control to give up few walks. It seemed to work, as pitchers with low to average strikeout rates were able to be effective pitchers, such as Scott Baker, Nick Blackburn, Kevin Slowey, and Brian Duensing.

Before I delve into my research, I should point to Voros McCracken’s ideas about Defense Independent Pitching for those less sabermetrically inclined (if you are sabermetrically inclined, feel free to skip the next few paragraphs). If I were to give a brief summary of his work, I would say McCracken’s main point is that if a pitcher does not give up a home run or strike out or walk a batter, then he has little control of what happens to the batted ball in play. A lot of what happens can be credited to luck, sequencing, and how good his defense is. For those unaware of sequencing, it is the idea that if a pitcher gave up three singles and a home run in an inning, there are many different possibilities of what could happen. The three singles could come in a row, followed by the dinger, for a total of four runs, or, two singles could come early, the pitcher gets a double play or some other way to get out of the jam, then gives up a home run with the bases empty, followed by another single and an out. In that scenario, only one run was surrendered, despite an equal amount of hits. McCracken suggests there is randomness in this effect, which combined with the quality of defense behind the pitcher and a good deal of luck, can make ERA a poor indicator of a pitchers true skill.

McCracken looked at defense-independent pitching stats (HR, BB, K) and defense-dependent stats (ERA), and noticed that the defense-independent stats correlate much better from year to year, and are a better indicator of how a pitcher will perform, since a pitcher does not have control of what happens to balls in play.

While McCracken did not actually create FIP, his work was a building block for modern pitching analysis. FIP (Fielding Independent Pitching) tracks what a pitcher’s stats would look like if he played behind a league-average defense and experienced league-average luck. It is a much better indicator of future performance than ERA. All the data I used was from 2007-2014. Over that span, for pitchers who pitched more than 100 innings in at least a two-year span, a pitcher’s ERA from one year to the next (tracking how consistent the stat is in tracking performance) had a correlation coefficient of 0.338. FIP, conversely, had a correlation coefficient of 0.476. Clearly, FIP performs better when predicting future performance, as McCracken suggested.

To end my digression on McCracken’s importance, if I had to sum up its importance to this article, it is that pitchers have little or no control over what happens to a ball in play.

When I was talking Twins recently with some recent, justifiably uneasy Twins fans, they attributed the Twins’ recent troubles to injuries and inconsistent pitching. This was when I was reminded of the “pitch to contact” philosophy heralded by the Twins. Since the days of recently past successes, the Twins have changed management, and hopefully have let go of this ideology. Anyways, I thought to myself that McCracken’s work and subsequent furthering of the topic do not go along with the pitch-to-contact philosophy. Sure, if a pitcher can prevent walks and home runs, then it does go along with part of McCracken’s ideas. But, if the goal is to induce weak contact, yet the pitcher does not have control of what happens to a ball when it is contacted, then there is a bit of a discrepancy.

So, like any other statistically-oriented college mind looking for how to spend the rainy days of my summer break, I decided to run some regressions to test if “pitch to contact” actually succeeded and the Twins were able to induce weak contact, or if the relative success of the pitching staff is related to luck and a good defense.

To reiterate, the data I looked at came from the seasons of 2007-2014. To sum up the Twins’ pitching through the period, the period starts with solid pitching from guys who lack the ability to post high strikeout rates, excluding the one season Santana pitched in the study. Guys like Scott Baker and Nick Blackburn had solid seasons early on, but Blackburn and many others faded once things went downhill for the team. From the outside looking in, it may seem like a chicken-or-the-egg scenario, whether it was pitching that caused the downfall or some other factor that caused the pitching to fail.

I gathered data for Twins pitching over this span, and compared it to the rest of the league. The pitch-to-contact philosophy was easily visible, as over this eight-year span, only five Twins pitchers had higher strikeouts per nine innings than league average (Johan Santana, Phil Hughes, Scott Baker, Francsico Liriano, Kevin Slowey). At the same time, only four pitchers had a walks per nine innings above league average (Nick Blackburn, Boof Bonser, Sam Deduno, and Liriano), and most of those seasons came in that pitcher’s last season with the team. The data shows that despite few strikeouts, Twins pitchers found some success in limiting numbers of walks. However, for those pitchers who struggled with control, their combined ERA in those seasons was 4.82, with a FIP of 4.60. Clearly, if a pitcher struggled with control, their success was hindered by the high walk rate.

Much of the Twins’ pitching was inconsistent over this time as well, as pitchers such like Blackburn or Brian Duensing seemingly went from quality starters to below-average pitchers. For the most part, I found this to be a team-wide theme. For pitchers with multiple years with the club, I correlated year-by-year ERA and FIP, to see if any consistent trends arose. Amazingly, there was no correlation from ERA from one year to the next, as the R-squared value was 0.002, stressing no relationship at all (graph). FIP, on the other hand, showed an R-squared value of 0.15; so while not a concrete relationship, a weak relationship exists (graph).

Why this lack of consistent ERA and FIP? This is where I think BABIP comes into play. Since FIP does not take into account BABIP, it did produce more reliable data. A few outliers threw off the data, and since it is not a large sample size, those outliers did affect correlation. By the nature of the relationship, this probably did more to affect the FIP correlation than the ERA, but nonetheless, the small sample size of pitchers from this period did affect the relationship. Interestingly, but perhaps not surprisingly, I performed a regression graphing FIP to ERA, and a solid relationship exists, with an R-squared of 0.36 (graph). This would be even better of a correlation if I took out seasons by Phil Hughes and Liriano, as in those two seasons their FIP was almost a full point lower than their ERA, respectively. This shows the validity of FIP as a metric, as it accurately predicts how a pitcher likely will perform based on independent factors.

Nonetheless, there is a clear difference here in the two pitching metrics. FIP implies a relationship, while ERA does not. How can this be? My theory is that it has to do with the pitch-to-contact philosophy. If pitchers are constantly relying on luck and defense to produce outs, rather than getting batters out themselves, then random variation will play much greater of a role in a pitcher’s effectiveness. Additionally, a team’s defense will play much greater of a role in pitching.

How much can a defense affect pitching? Well, I graphed the total WAR produced by the various Twins defenses against the team ERA from the 2007-2014 seasons. I additionally graphed BABIP against team defense. Amazingly, an ERA to defense regression produces an R-squared of 0.47 (graph), while a Defense to BABIP regression produces a 0.37 R-squared value (graph). Team defense clearly has a relationship with team ERA and team BABIP, as when the Twins defense was in its prime (2007, 2010), pitching performed well. Similarly, in the defense’s worst two seasons, the team also had its highest BABIP (2013, 2014). For those wondering, FIP to team defense produces no correlation (as we expect, since it does not account for a team’s defense) with an R-squared of 0.003.

What does this all mean?

Putting it all together, we notice a few trends. After 2010, the defense took significant steps back, along with pitching (ERA). As we expect, the team’s BABIP was affected by the defense’s regression. FIP, on the other hand, remained fairly constant through the span, showing how the defense must play a role in team ERA. For example, we will look at 2014. This was the defense’s worst year in the span, with a defensive WAR of -46.5. Team ERA was second-worst in this year, at 4.58. FIP, conversely, showed the team had its second-best year in pitching, with a value of 3.97. This shows that if the Twins would have had an average defense, their ERA would have been much lower.

As team ERA ballooned, the quality of the Twins’ defense fell. Since Twins pitchers were taught to rely on their defense through the pitch-to-contact ideology, this relationship was amplified. Pitching to contact, although relying on luck and defense, may have had some merit when the Twins’ defense was in its prime. If the team could get to more balls, produce a few more outs, then as long as the pitchers kept batters from getting on for free via the walk, the team would succeed. The pitcher would not need to strike out as many batters since the defense would make more outs than the normal team. This sounds nice on paper, but as the team defense decayed, the pitching regressed. This is most evident in 2014, as a solid pitching staff was marred by the defense behind them.

If the Twins were to truly focus on pitching to contact, then they should have looked at the defense, not the pitcher. At the same time, pitching to contact is flawed in a way. Why should a pitcher rely on a defense if he can just get the batter out himself? Teaching a pitcher not to use his natural talent to strike out a batter is counter-productive. I am not saying the Twins’ coaching staff directly did this, but when only four pitchers in an eight-year span have above-average strikeout rates, it raises the question. Perhaps the Twins looked for pitchers who were undervalued because of their low strikeout rates, and used these undervalued pitchers in their pitch-to-contact system. Yet, this does not seem to be the case, as the Twins pitchers with the lowest ERAs and FIPs were the pitchers with the highest strikeout rate, excluding Brian Duensing, whose downfall could have been predicted by his 3.82 FIP (to a degree), as it showed is 2.62 ERA would be much closer to 4.00 with an average defense. Even in a pitch-to-contact system, the pitchers with the best ability to get the batter out without putting the ball in play were the best pitchers.

If pitching to contact were to have a textbook year, it would be 2007, where a team with a 4.37 FIP had an ERA of 4.18. Yet, soon after, the defense plummeted, bringing the team pitching down with it. Clearly, through the team’s porous defense, the Twins gave up on pitching to contact, too. They just hadn’t realized it yet.

Hopefully, with the new management in place, pitching to contact is forgotten. While it is also important to keep a viable defense behind the pitcher, I still can’t trust the pitch-to-contact ideology. It had a good run, but seriously, when was the last time the Twins were able to produce a consistent pitcher out of a highly-praised prospect? Liriano wasn’t consistent, Kyle Gibson has yet to dominate, and Jose Berrios has looked shaky is his brief appearances. I think Scott Baker might be the answer to my question, but if not him, then maybe Johan Santana?

Clearly, the Twins need a new philosophy for grooming pitching. It’s a team riddled with questions, and this is not the lone answer, but it can be one step in the right direction for the team currently pegged at the bottom of the AL barrel.


Buying or Selling Carlos Gomez

What are you to do with a former fantasy superstar who hasn’t lived up to expectations? For some, the answer’s easy; Carlos Gomez has already been dropped in over 25% of leagues on both ESPN and Yahoo.

Now that I’ve driven half my audience away with my use of a semicolon, let’s start the real analysis. Gomez certainly disappointed his owners through the first month and change of the season, sporting a minuscule .486 OPS through May 15 before being placed on the DL. For reference, out of 324 batters with at least 100 plate appearances, just two (2) have a lower OPS as of June 24. Both are on the Braves (one hit fifth in the lineup as recently as June 21, while the other has batted second 13 times this season).

So yes, one could see why owners would have lost patience with Gomez. But this was also a player who hit 66 home runs and stole 111 bases while hitting .277 between 2012 and 2014. If anyone deserved patience, it was him.

So when he hit two home runs in his first six games back from the DL, it was hard to be too surprised. Since then, he’s put together five multi-hit performances, and has brought his season line back up to at least non-Atlanta-ish numbers.

While it’s obviously a small sample size, Gomez’s 76 plate appearances in 19 games since his return have shown immense improvement over his horrendous start to the season. To demonstrate this, take a look at each of the different areas in which he’s bounced back:

Plate Discipline
2012-2014 April 5 – May 15 May 31 – June 24
BB% 6.2% 5.3% 10.5%
K% 22.8% 34.8% 30.3%
BB/K .27 .15 .35
SwStr% 13.9% 19.4% 16.7%
O-Contact% 59.5% 42.4% 45.9%
Z-Contact% 84.4% 74.4% 80.5%
O-Swing% 37.4% 32.1% 35.7%
Z-Swing% 79.3% 79.9% 65.8%

I could bring up more player comparisons and show you just how bad the Atlanta Braves are this year, but that’s not the point of this article. Instead, let’s just focus on Gomez’s numbers and how they compare to earlier in the year and during his prime years. He’s nearly doubled his walk rate while striking out more than 10% less often than before, leading to a BB/K that is no longer painful to look at. He’s missing less frequently on pitches he swings at, both in and out of the zone, and has fewer swings-and-misses as a result. The one worrisome spot here is his swing rates, where the trend is the opposite of what we’d generally expect when we see favorable results. However, his O-Swing% is still lower than it was between 2012 and 2014, and it seems as though swinging less at pitches in the zone is leading to more walks and less bad contact, so it’s not truly a terrible result.

Batting and Power
2012-2014 April 5 – May 15 May 31 – June 24
AVG .277 .182 .294
BABIP .329 .293 .405
OBP .336 .238 .368
SLG .483 .248 .471
ISO .206 .066 .176
OPS .819 .486 .839
wOBA .356 .216 .364
wRC+ 123 28 129
HR/FB% 14.6% 0.0% 33.3%

I already referenced Gomez’s OPS above, but it’s still almost unbelievable to see that his post-injury slugging percentage is nearly as high as his OPS once was. Besides that, there’s improvement across the board. His average is up over 100 points, as his OBP, SLG, ISO, OPS, and wOBA. He’s gone from being 70% worse than the average hitter to 30% better. What’s good to see her is that he’s not outpacing any of his career stats by a noticeable amount — an indication that his current run is very much sustainable. Okay, maybe not the .385 BABIP, but as you’ll see next, keeping it over .300 shouldn’t be an issue.

Batted Ball Breakdown
2012-2014 April 5 – May 15 May 31 – June 24
GB% 39.3% 47.1% 44.2%
FB% 40.6% 35.7% 20.9%
LD% 20.1% 17.1% 34.9%
Pull% 42.7% 36.4% 62.2%
Cent% 33.9% 41.6% 13.3%
Oppo% 23.5% 22.1% 24.4%
Soft% 16.7% 29.9% 31.1%
Med% 48.0% 45.5% 28.9%
Hard% 35.3% 24.7% 40.0%

Let’s take this one at a time. First, Gomez has seen a drastic increase in his line-drive percentage, unfortunately at the expense of hitting fewer fly balls. While it’d be better to see him hit fewer ground balls and get some more balls in the air, he’s certainly making this approach work for him right now. He won’t hit 30 home runs with this approach, but with the increased line drives, he should have no problem continuing to hit for extra bases.

Then comes the confusing part. He’s increased both the percentages of balls he hits to the pull side and opposite of the field, now hitting just 13.3% of his balls to center. He was definitely spraying the ball better beforehand, although the bloated Pull% will undoubtedly help him to put up some better power numbers. If the numbers stay in this region, I’d definitely expect his BABIP to regress, but it’s more likely that they regress closer to his career norms. A lot of those pulled balls will end up going to center field.

Finally, there’s the stuff that’s easy to analyze. Hit the ball harder, get better results. Gomez apparently believes in that approach as well, now hitting the ball hard over a third of the time and showing over a 50% increase from his previous rate. He needs to work on hitting the ball soft less often, which should happen if he continues to be selective and wait for his pitch.

Statcast Data
2015 April 5 – May 15 May 31 – June 24
Exit Velocity (mph) 88.5 84.8 86.4
Exit Velocity on Line Drives and Fly Balls (mph) 92.7 91.2 96.4
Fly Ball Distance (feet) 315.2 309 359

Ah, Statcast. What would we do without your infinite wealth of knowledge? The data here was obtained through Baseball Savant, and confirms that Gomez is indeed hitting the ball harder than he was before his injury. His overall average exit velocity remains low, but his velocity on line drives and fly balls is actually higher than it was last year. He can hit all the slow ground balls he wants and still be successful, provided he can keep up this increased velocity on balls in the air. Of course, he’s not going to continue hitting his fly balls over 350 feet — that’s reserved for people like Byung Ho Park (and apparently Tyler Naquin?). But he’s at 323 feet for the season now, and which should easily suffice for him to begin putting up some rejuvenated power numbers.

If you’re looking for a tl;dr, here it is: Carlos Gomez is performing much better than he was earlier in the season. He’s taking more walks, striking out less, making more contact, and hitting the ball harder and farther (further?). It’s obviously a small sample size, and he may not put up another 20/40 season, but he’s more than capable of hitting 10 home runs and stealing 15 bases the rest of the way. While it’s not elite production, it’d be better than he did last year, which would be quite an achievement after his start to the season.


Lineup Construction is Changing

Lineup construction is a topic that comes up far more often in proportion to how important it is. But if you can save a few runs in a year by using the proper lineup, it’s worth it. Put your OBP up top, not your steals. The #2 hitter should be better than your #3.

With 14 going on 15 years of lineup splits available on FanGraphs, are any trends clear? Yes, actually. In regards to the two specific issues above, managers do seem to be getting better. Let’s explore. (Note: All “league averages” are non-pitchers. Pitchers aren’t real hitters, after all.)

The on-base percentage of leadoff hitters vs. the league average has climbed. In 2002, the league average OBP was .336 whereas it was just .332 for leadoff hitters. Ten years later, in 2012, league average was .324 but leadoff hitters hit .344. The gap has begun to decline since then, but the trend is still apparent, and in 2016 leadoff hitters have a .332 OBP vs. the league’s .324. Overall, here’s a simple chart of the league’s leadoff OBP minus the overall average OBP for each year since 2002:

Not everyone has caught on; either Dusty Baker or Ben Revere really need to figure things out soon for the Nationals, for example. But leadoff hitters are getting better at getting on base.

Meanwhile, managers have a longer way to go in their understanding of the fact that a #3 hitter will most often find themselves batting with the bases empty and two outs which, naturally, is not a good situation for scoring runs. However, just by comparing the wRC+ of the league’s #2 and #3 hitters shows that some teams are learning. In the dark days of 2002, #2 hitters had a wRC+ of 92, compared to 128 for #3 hitters. Since then, #2 hitters haven’t been that bad, but they haven’t been great, either. However, the last three years have been #2 hitters’ most productive since 2002: they had a 102 wRC+ in 2014, 107 in 2015, and currently a 105 in 2016. Teams haven’t moved their best hitters out of the three hole (this will be #3 hitters’ seventh straight year with a wRC+ of 120 or better), but they are starting to see the value of a good #2 hitter. This has led to the wRC+ gap between #2 and #3 hitters to exhibit a clear downward trend since 2002:


Even if you take out that 2002 season, the trend holds. It is still basically due to a change in the past two years, but the more hitters like Andrew McCutchen or Manny Machado, Corey Seager or George Springer bat in that second spot in the order and have success, the more we can expect out of the two hole. A lot of these #2 hitters, you might note, are young guys with a lot of career ahead of them with their current teams. It’s up to managers to keep them at #2 instead of moving them to #3 as these players continue in their careers. They may not, leaving 2015 and 2016 as anomalies so I can be wrong again. (Actually, I’m never wrong, because where’s the fun in that?)

But next time you lament the general failures of managers to put out the correct lineup, remember, things are getting better. Maybe it’s just your favorite team’s manager.


Waiting On an Ace: Jimmy Nelson

I love pitching prospects. Not that I can back this statement up, but I believe pitchers make a more immediate impact on a fantasy roster than hitters. So, each year I stack my “Watch List” with young pitchers that might get called up in September, have a good shot of getting called up in June and potential breakout sleepers. Four years ago, one such player was Jimmy Nelson. How could a man that stands 6-6 at 245 lbs. not be on the radar? I watched with eager anticipation at all those strikeouts. That was four years ago and not much has changed. Both the Brewers and I seem to be in the same boat — waiting on Jimmy Nelson.

At one point, Nelson was the number one prospect in the Brewers’ organization. His fastball and slider were scouted as plus pitches and as such, Nelson was touted as a middle-of-the-order pitcher with potential to move up with the development of a third pitch. He was drafted in the 2nd round, 64th overall and is still just 26 years old. His aforementioned size gives him the frame to tax his arm with 200-plus innings each year. Plainly put, Nelson has the pedigree to be a stud and clearly the Brewers thought so too. Why then are we waiting three years into Nelson’s MLB career?

About 16 months ago, Mike Newman wrote about Nelson’s rising stock. That was prior to a year when Nelson had somewhat of a breakout campaign, going 11-13 with a 4.11 ERA and a 19.7 K%. If you recall he seemed to put things together in July to the point of striking out 32 in 33 IP with a sizzling 1.61 ERA. That’s when everyone jumped on board and expected big things in my fantasy league (10-team mix league, five keepers, deep rosters, 12 years running). July ended, however, and Nelson fizzled with the fading temperatures in 2015. His stock was mixed heading into this year (ADP 211, Yahoo!). It’s a new year now and the temps are starting to rise again. Will Nelson resurface as the potential ace he showed last July?

Last year Jimmy Nelson introduced a curveball to his arsenal, and it was good. The story on Nelson is that he always lacked confidence in his third pitch, the changeup. In the early going Nelson rarely threw that pitch. In order to get lefties out and develop into an ace Nelson needed a third pitch he was not only confident in but that could develop into a plus pitch. Maybe the curve was just what the doctor ordered. His pitch distribution looks like this.

In 2015, Nelson offered his newly-found curve 21% of the time while keeping his plus slider around (17%). 2016 seems to be a different story to this point. Nelson is throwing his fastball much more often and his off-speed pitches less, basically ditching the change all together. This has had two results: hitters are swinging less and making more contact. Z-contact% is creeping up to scary levels (93%).

Worse, so far, hitters are being patient with Nelson. It seems when Nelson goes outside the zone, hitters are laying off.

To summarize, hitters are swinging less at pitches, both inside and outside the zone, and making more contact, both inside and outside the zone, than ever before against Nelson. This is not a good sign. Dating back to Nelson’s early days, he has displayed control issues. What happens when hitters become patient against a pitcher with historic control issues? His walk rate increases.

Jimmy Nelson is progressing in the wrong direction. Hitters have adjusted to his curve and slider, they are being more patient, and they are making more contact. While Nelson’s K% has not dropped dramatically, his BB% is trending in the wrong direction. As a result his K-BB% is at an all-time high (in both the major and minor leagues).

I have something to confess. Prior to researching Jimmy Nelson I attempted to trade him in my fantasy league. To multiple teams. Multiple times. Here were my selling points: Pedigree, development of a third pitch and progression. So far this year Nelson has a 3.46 ERA, a 3-1 record, and he is still striking guys out at 17.9%. On the surface it looks like he is pitching to more contact and inducing weaker contact when he does; his 24.7% soft-contact rate is up from 19.2% last year.

One could be optimistic about this. I am not, however. His ERA is being supported by a .225 BABIP and a crazy 90% strand rate. Worse, pitching to contact is not a good strategy when fly-ball percentage is also trending in the wrong direction; up to 35% from 29% last year.

To wrap this lengthy post up I have several concerns with Jimmy Nelson. He’s always been known for having control issues and it seems he has not improved that yet. He’s developed a third pitch but is refusing to throw his plus slider and curveball more often. He’s inducing more contact but that contact is in the air. I am not searching for a way to “fix” Jimmy Nelson. His velocity seems to be consistent, perhaps just a tick down. His mechanics seem fine. There are no injuries to report. Rather, this post is about waiting on the ace that the Brewers thought they had. If that ace is going to emerge, Nelson is going to have trust in his slider and curve as he did in July of 2015. He’s going to have to find a way to induce more swings outside the zone. As it stands now, he is living dangerously inside the zone and will eventually run into major problems when those stranded runners come around to score as his BABIP rises. As deep as our fantasy league is, he still might be able to be moved. More than likely, however, he’ll remain what he has been — a middle- to back-end-of-the-rotation arm both in fantasy and real baseball.


Does Payroll Matter? (Part I)

Money in baseball has been an infinite source of criticism. In MLB, there is no salary cap as in other major sports, and luxury tax is relatively recent. Media has made us believe that the small fish (e.g. small-market teams) will always be eaten by the big one (e.g. big-market teams). The Kansas City Royals’ performance during the last couple of years, along with the tricky and often misunderstood Moneyball concept, has brought back salary to the newspaper headlines even though it is safe to say the Royals were not even a low-end payroll team. In any case, this post is an attempt to see if popular beliefs regarding money, power and on-field performance pass the numerical test.

There are many interesting questions related to this topic. However I will limit myself to the following during two posts:

  1. Is there a relationship between payroll and wins? If so, how strong is it?
  2. Has this relationship changed over time? If so, where are the peaks? Where are we now?
  3. Will money buy you a ring or a post-season ticket? If so, how much should we spend?
  4. Are there truly big spenders? If so, who are they? Have they changed over the years?

Let me start off by stating what my data sources are, and laying out my assumptions so that we are in the same page. My sources for salaries are Baseball Chronology (1976-2006), Sean Lahman database (2007-2014) and Sportrac (2015). For wins and post-season appearances, my references are MLB and the Sean Lahman database. MLB revenue data is from Forbes.

My assumptions and caveats are the following:

  1. Payroll values are not adjusted for inflation. Time value of money has not been taken into account.
  2. The Houston Astros are considered an American League (AL) team. The Milwaukee Brewers are considered to be a National League team.
  3. 1994 strike-shortened season does not have playoff teams or a World Series champion.
  4. Payroll is considered to be Opening Day payroll. Payroll is assumed to be constant throughout the season for simplicity. Arguably this may not hold true as winning/better teams will likely be buyers at the trade deadline. Losing teams will likely be sellers.
  5. I have not tested for any confounding effect on the variables studied (payroll and wins).

Without further talk, I will get to it.

Question 1: Is there a relationship between payroll and wins? If so, how strong is it?

To answer this question, I found the correlation between yearly payroll and winning percentage for every individual season played from 1976 to 2015. Because payroll values have changed so much in 40 years, I used z-scores or standard scores, which allows us to compare different seasons, regardless of payroll differences.  A payroll number on its own does not mean much and should be compared to the pool of teams on a yearly basis i.e. it is the distribution of payroll in the league that matters. Here’s a link in case you are not familiar with the concept of z-scores; please keep in mind that correlation does not imply causation. Check out the correlation here.

A couple of interesting insights can be drawn from this graph. The first one, quite obvious, is there’s a positive slope there, implying that more money affects wins positively. The second point, though, is that payroll alone does not wholly explain the total number of wins. We inherently knew that. In 40 years, we are able to find teams that satisfied each situation: low-payroll teams that were awful (Houston 2013), low-payroll teams that played over a .600 win percentage (Oakland 2001 and 2002), high-payroll teams that unperformed (Boston 2012) and high-payroll teams that exceeded expectations and went on to win 114 games (NYY 1998). There is a mid-tier team that did extremely well (SEA 2001). These are all outliers, though people can (will?) use every one of these cases to support a preconceived idea e.g. “baseball is a sport and it is attitude and effort that matters,” “money will buy you handshakes at the end of each game,” “big-money teams won’t win because they lack camaraderie,” etc. Therefore, let’s focus on the big picture.

The third point I’d like to highlight is the R-square. The R-square measures how successful the fit line is in explaining the variation of the overall data on a 0-to-1 spectrum. In this case R-square is 0.1905 so it looks like ~19% of the total variation in wins can be explained by the linear relationship between payroll and wins. Also, the slope of the best fit line is 0.0302. This means for a one-unit increment in Z-scores, there is a 0.0303 win-percentage increment. Remember z-score increments are not linear e.g. going from -0.5 to 1.5 requires a different amount than moving from 2 to 3.

However, the potential drivers behind the total number of wins are complex (injuries, roster construction, plain luck, etc.) and the R-square, along with the F-test and P-value, shows that money matters but seems to be overrated. Again, remember that correlation does not imply causation.

Question 2: Has this relationship changed over time? If so, where are the peaks? Where are we now?

We have established that team payroll can predict win percentage with a low confidence level. However, has that always been the case? Was money more important in the 80s than now? The following graph shows the R-square value for every two-year period from 1976 to 2015. It is important to keep in mind that the higher the R-square value, the stronger the relationship between payroll and winning percentage.Check out the R-square of payroll and winning percentage for every 2-year period.

The answer to our question of whether the relationship has changed over time is definitely yes. There are noticeable peaks and valleys. There have been two periods (which I highlighted in green) when money was a better predictor of winning percentage: from 1976 to 1979 and from 1996 to 1999. The first period corresponds to the first four years of free agency. Team owners flooded the league with new money as they went after key players e.g. Mike Schmidt or Reggie Jackson, and payroll increased drastically (60% in 1977, 34% in 1978), as shown below. These have been largely documented (here, here and here). Click here for the payroll growth trend since 1976.

The second period (1996 – 1999) is linked to the Yankees, Orioles (though they dramatically underperformed in 1998), Indians and Braves’ successful expenditure (read: lot of won games) and to the lack of Cinderella stories (perhaps only Houston in 1998 and Cincinnati in 1999). This period was also characterized by, firstly, a league expansion sequel: Tampa Bay and Arizona joined the league in 1998 and, understandably, underperformed. Secondly, MLB revenues year-to-year growth averaged 17% from 1996 to 1999 (not adjusted), so probably teams redirected that surplus to the salary pool. Lastly, in the late 90s, MLB was increasingly becoming a rich-team game. The graph below will show the payroll coefficient of variation for the 1976 – 2015 timeframe. This number, which I will call payroll spread, is simply the standard deviation divided by the mean. This number allows us to quickly assess how spread is the payroll across the league over time. Do you see the trend after ~1985? By 1999, this number had increased continuously for almost 15 years and MLB has had enough. As the power money increased AND the gap widened, MLB commissioned the Blue Ribbon Panel to come up with initiatives to level the field A.K.A. a revenue-sharing program to increase competition. Entertainingly, the correlation of money and winning percentage has decreased steadily but the payroll spread has remained pretty much consistent. I am hesitant to attribute the decline in R-square to the Blue Ribbon Panel or to other factors (read: is this coincidence?). Check out the payroll spread here.

If we go back to the yearly payroll and winning-percentage correlation graphs, you’d notice that I highlighted two periods in red too — from 1982 to 1993 and from 2012 until last season. Those were moments when the correlation of salary power and winning percentage was remarkably low. The first period seems to be closely related to the collusion MLB crisis (check out this link as well). The lowest point was in 1984-1987, when the correlation was only 0.03 and the salary spread was 0.22.

The 2012-onwards period has brought down R-square to a 20-year low (0.06 in 2012-2013). While TV revenue keeps rising, the baseball landscape has changed and new variables are in the mix. There is a redefined revenue-sharing model, we have analytically-inclined organizations, an extended wild-card system and international signings – all these factors have added more complexity to the winning equation, effectively diminishing the relationship between payroll and winning percentage – even with the salary spread still at ~0.40. We are living in interesting times in baseball indeed: If investing money in players doesn’t lead to better on-field results, where do teams need to invest e.g. analytics, managers or front office?

Note: This analysis is also featured in our emerging blog www.theimperfectgame.com