Archive for Research

Austin Jackson’s Bothersome Batted-Ball Bind

On July 30, 2014, the Seattle Mariners found themselves in the interesting position of being in playoff contention. The Mariners sported a 32-23 record, only 2.5 games back of the AL West-leading Los Angeles Angels, and owned the third-best Pythagorean record in the American League. Seattle’s newfound position as postseason hopefuls meant that they were suddenly buyers at the trade deadline – not drastically so, but in the sense that the Mariners were only a couple of upgrades away from assembling themselves a nicely well-rounded playoffs roster. Chief among these desired upgrades was a serviceable everyday center fielder, one who could replace a revolving door of below-average outfielders that included Abraham Almonte, James Jones, Stefen Romero, and Endy Chavez.

Jack Zduriencik sought to remedy the Mariners’ outfield issues with a pair of trade deadline deals. The first involved packaging Almonte and minor-league pitcher Stephen Kohlscheen to the Padres in return for Chris Denorfia, a rather unsexy deal to be sure, but one that was a success at the time in that the acquired player was not Almonte. The second deal, a three-way transaction between the Rays, Tigers, and Mariners, was collectively more sexy, but a large share of the sexy went to the Tigers, who landed Rays ace David Price. The other major components of the deal were the Rays’ acquisition of young Mariners middle infielder Nick Franklin and Tigers pitcher Drew Smyly, as well as Seattle’s prospective answer to its outfield problem: Detroit center fielder Austin Jackson.

Since his move to the Mariners, Jackson has racked up 277 plate appearances for Seattle, and the results have been fantastically underwhelming. Of the center fielders who amassed more than 100 plate appearances for the Mariners in 2014 – an uninspiring triumvirate of Jackson, Abraham Almonte, and James Jones – Jackson produced the worst offensive performance by wRC+. Jackson’s 2014 performance also disappointed even by more conventional measures:

  • Jackson totaled 34 extra-base hits in 416 plate appearances for the Tigers in 2014. For the rest of the year, in 240 plate appearances for the Mariners, Jackson managed 6.
  • Jackson’s ISO dropped from .127 to a paltry .031 with the move from Detroit to Seattle.
  • Jackson’s 2014 OBP/SLG/wOBA with Detroit: .330/.397/.321. With Seattle: .271/.264/.243.

Not great for a player only two seasons removed from a 5-win campaign.

Ostensibly, something was fundamentally different with Jackson in 2014, something that can hopefully be determined by closely examining his recent performance. Looking first to Jackson’s approach, it seems that there hasn’t been too much change over the course of his career. His K/BB ratio has generally hovered around league average and his contact rates haven’t fluctuated all that much from year-to-year. If anything, Jackson’s approach metrics look like they’re trending positively – he actually posted career bests in Z-contact% and SwStr% in 2014. If we examine Jackson’s batted ball data, however, we begin to get a little closer to the root of Jackson’s troubles of late. The most easily identifiable aspect of Jackson’s game can be somewhat distilled in the following graphic:

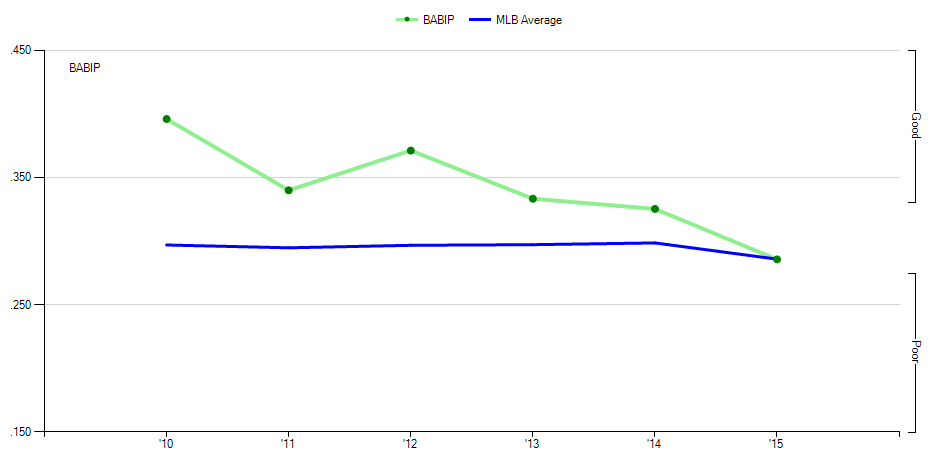
Over the course of his career, Jackson’s BABIP has been way above league average. He managed an absolutely ridiculous .396 BABIP in his 2010 rookie season over 675 PA, and his career-best 2012 season, in which he posted a 134 wRC+, was bolstered by a BABIP of .371. That figure would predictably fall after 2012, but between 2013 & 2014, Jackson’s BABIP only declined by .008, whereas in the same period, his wOBA fell from a very good .332 to a mediocre .292. This might suggest that in 2014 specifically, it may not have been the frequency with which Jackson was able to put balls in play so much as the quality of those batted balls that limited Jackson’s production.

Unfortunately, batted ball data is out of the scope of my access. The closest I can get to Jackson’s batted-ball profile is  by pulling data from this pre-season piece on Jackson by Jake Mailhot over at Lookout Landing, and indirectly from Jeff Zimmerman’s work on hitter analytics at RotoGraphs (the relevant batted-ball spreadsheet now seems to be unavailable for some reason).

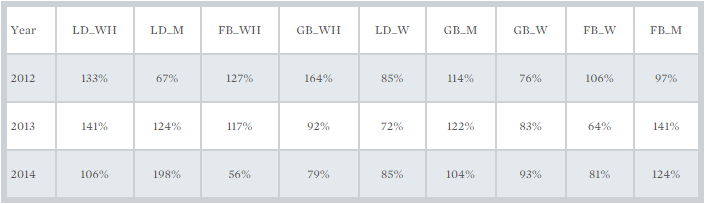
To quickly explain – this table charts batted-ball rates expressed as a percentage of league average. Batted balls are separated into three categories (line drive, groundball, fly ball) which are then further divided into subcategories of contact quality (Well-Hit, Medium, and Weakly-hit). These categories are ordered left-to-right from highest to lowest based on xBABIP.

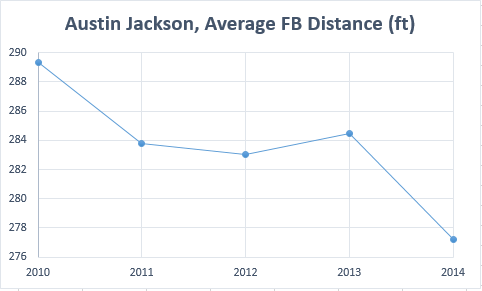
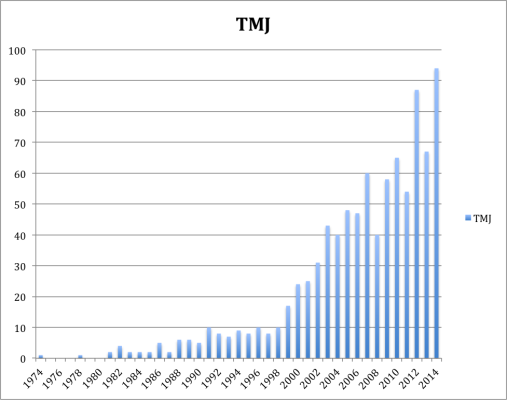
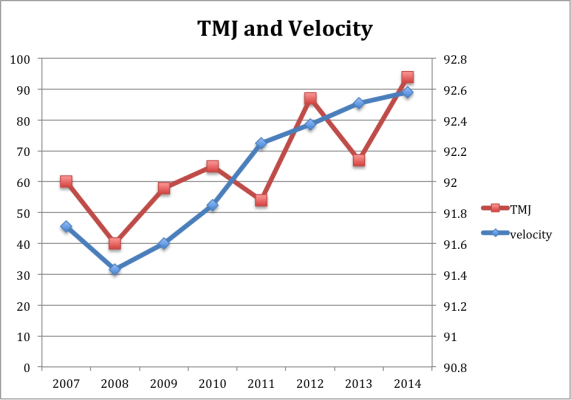
Mailhot astutely notes an alarming drop in well-hit groundball rate – from 64% above league average in 2012 to 11% below league average in 2014. This is accompanied by a commensurate rise in weakly-hit groundballs. Jackson’s well-hit line-drive rate also drops by a sizable amount, hovering around league average in 2014, while his rate of medium-hit line drives balloons to 198% of league average in 2014. Mailhot also points out possibly the most substantial shift: an immense drop-off in well-hit fly-ball rate in 2014 to 56% of league average, a trend corroborated by data pulled from Baseball Heat Maps on Jackson’s average fly ball distance over his career:

Jackson’s high rate of well-hit line drives and ground balls prior to 2014 puts into perspective the aspects of his game that brought him success earlier on in his career, and his sharp decline in those metrics in 2014 even more so. To put it in exceedingly simple terms, Austin Jackson just didn’t really hit balls hard in 2014, something he was quite good at doing before that season. Judging by the splits, most of the not-hitting-balls-hard occurred after the move to Seattle.

Jackson’s 2013 was much better than his 2014, but it is the beginning of a short trend of BABIP decline. From examining batted-ball data, we can infer that quality of contact has a significant bearing on BABIP, and this makes sense using conventional logic as well. Hard-hit line ground balls are more likely to find gaps between defenders, hard-hit line drives are more likely to drop in for hits, and hard-hit fly balls are more likely to turn into extra-base hits (although BABIP ignores home runs). The easy explanation is that Jackson lost some power in 2014. I don’t have enough film on Jackson to know for sure if there’s a visually concrete reason for this (if, for example, there’s something off in his swing mechanics), but data from 2014 indicates that Jackson just hasn’t been making good contact.

Jackson’s issues are probably best explained by his batted-ball troubles, but park factors likely play some part as well, with Comerica Park being relatively more hitter-friendly than Safeco Field. Safeco’s pitcher-friendly park factor and the ‘dead ball effect’ of Seattle’s marine air probably have something to do with Jackson’s decline in fly-ball distance, although Jackson is himself contributing to that same decline in some measure.

At the time of his acquisition, a merely average performance from Jackson would have been a significant upgrade over the convoluted mishmash that had previously taken the field for the Mariners. Unfortunately, he was unable to even provide replacement-value production after coming to Seattle, totaling -0.4 wins above replacement in 2014. The Mariners traded for an above-average player and received the production level of a player who theoretically wouldn’t cut it in the big leagues altogether.

The prospect of 2015 being a bounceback year for Jackson has not gone over too well in these first few weeks. ZiPS (R) and Steamer (R) still think Jackson could manage 1.7-2.1 WAR on the season, which is a bit below his peak, but I think the Mariners would take that statline in a heartbeat. I’ve gone this far without mentioning Jackson’s other tools, but as a 28-year-old without a concerning injury history, there’s not as much reason to worry about his defense and baserunning as there is to worry about his offensive output. Jackson was a below-average defender by UZR in 2013/2014 and has been worth approximately 4 baserunning runs above replacement in each of the past couple of years, neither of which have dictated his value nearly as much as his offense, or lack thereof. Using those numbers as a serious predictive measure from year-to-year is simply not very useful at this point.

Lloyd McClendon was Jackson’s hitting coach back in Detroit, and suffice it to say he probably has a better grasp on Jackson’s habits as a batter than most. If anyone’s able to get Jackson back on track this season, it’s probably McClendon. At time of writing (the 18th of April), Jackson managed a slightly encouraging 2-hit, 1-walk performance against the Rangers. It’s early yet in the season, and there’s time for Jackson to hopefully figure things out. Alternatively, if Jackson can’t find some of his pre-2014 form this season, the Mariners might once again find themselves in the same trade deadline predicament from last year – only this time, there’s not an obvious trade chip à la Nick Franklin. Then again, 2015 is Jackson’s last year under team control, so the Mariners may simply choose to let him walk after the year is over if they’re not satisfied with his performance. If that’s the case, it’s hard to imagine looking back on the 2014 Jackson trade with anything but the same tinge of regret and frustration that has colored so many other Mariners transactions of the last decade.


Hardball Retrospective – The “Original” 1924 Washington Senators

In “Hardball Retrospective: Evaluating Scouting and Development Outcomes for the Modern-Era Franchises”, I placed every ballplayer in the modern era (from 1901-present) on their original team. Therefore, Frank Robinson is listed on the Reds roster for the duration of his career while the Rangers claim Ivan Rodriguez and the Red Sox declare Jeff Bagwell. I calculated revised standings for every season based entirely on the performance of each team’s “original” players. I discuss every team’s “original” players and seasons at length along with organizational performance with respect to the Amateur Draft (or First-Year Player Draft), amateur free agent signings and other methods of player acquisition.  Season standings, WAR and Win Shares totals for the “original” teams are compared against the “actual” team results to assess each franchise’s scouting, development and general management skills.

Expanding on my research for the book, the following series of articles will reveal the finest single-season rosters for every Major League organization based on overall rankings in OWAR and OWS along with the general managers and scouting directors that constructed the teams. “Hardball Retrospective” is available in digital format on Amazon, Barnes and Noble, GooglePlay, iTunes and KoboBooks. The print edition is coming soon. Additional information and a discussion forum are available at TuataraSoftware.com.

Terminology

OWAR – Wins Above Replacement for players on “original” teams

OWS – Win Shares for players on “original” teams

OPW% – Pythagorean Won-Loss record for the “original” teams

Assessment

The 1924 Washington Senators   OWAR: 43.1     OWS: 287     OPW%: .615

Based on the revised standings the “Original” 1924 Senators obliterated the competition with the Tigers finishing a distant 13 games in arrears. Walter “Big Train” Johnson, approaching the final stop in his 21-year career, continued to blow smoke past American League batsmen. He whiffed the most batters in the Junior Circuit for the twelfth time and furnished a 23-7 mark with the best ERA (2.72) and WHIP (1.116) in the League. Johnson received the MVP Award for his efforts in ’24 and the future Hall-of-Famer retired three years later with 417 victories, a 2.17 ERA and a 1.061 WHIP along with 3,509 strikeouts and the most shutouts in Major League history (110). Johnson ranks first among pitchers in “The New Bill James Historical Baseball Abstract”.

Jack Bentley bolstered the Washington pitching corps, delivering 16 victories against 5 losses. Firpo Marberry split time between the rotation and bullpen, notching 11 wins and saving 15 contests (although saves were not officially tabulated until 1969).

ROTATION POS WAR WS
Walter Johnson SP 7.02 28.65
Jack Bentley SP 1.96 11.78
Firpo Marberry SP 1.48 17.72
Joe Martina SP 0.35 5.74
BULLPEN POS WAR WS
Ted Wingfield RP 0.67 2.54
By Speece RP -0.25 3.52
Slim McGrew SP -0.27 0.32
Paul Zahniser SP -0.28 3.72

Goose Goslin (.344/12/129) topped the American League leader boards in RBI while recording 199 hits and 100 runs. The future Hall of Famer surpassed the century mark in ribbies 11 times and recorded a .316 lifetime batting average. Sam Rice batted .334 with 106 runs scored and 39 two-baggers while producing a League-best 216 base hits. A .322 career hitter, Rice concluded his career only 13 hits shy of 3,000.

Charlie Jamieson rapped 213 safeties and posted a personal-best .359 BA after leading the Junior Circuit in the previous campaign with 222 knocks. First-sacker Joe Judge clubbed 38 two-base hits and delivered a .324 BA. Goslin rated 16th among left fielders in the “NBJHBA”. Rice (33rd-RF), Judge (44th-1B) and Bucky Harris (70th-2B) also placed in the top 100 at their respective positions.

LINEUP POS WAR WS
Charlie Jamieson CF/LF 3.09 19.11
Sam Rice RF 3.65 23.99
Goose Goslin LF 5.69 28.91
Joe Judge 1B 2.12 19.08
Ossie Bluege 3B 0.72 10.42
Bucky Harris 2B 0.32 13.31
Eddie Ainsmith C 0.11 0.45
Howie Shanks SS -0.02 5.21
BENCH POS WAR WS
Frank Brower 1B 1.05 5.27
Irish Meusel LF 0.98 16.78
Doc Prothro 3B 0.9 5.89
Bing Miller RF 0.83 13.65
Earl McNeely CF 0.3 5.84
Carl East RF 0.09 0.36
Ike Davis SS 0.02 0.35
Bennie Tate C -0.02 0.64
Carr Smith RF -0.13 0.04
Tommy Taylor 3B -0.13 0.85
Showboat Fisher RF -0.14 0.4
Pinky Hargrave C -0.35 0.21
Mule Shirley 1B -0.5 0.34
Frank Ellerbe 3B -0.9 2.19

The “Original” 1924 Washington Senators roster

NAME POS WAR WS General Manager
Walter Johnson SP 7.02 28.65 Thomas Noyes
Goose Goslin LF 5.69 28.91 Clark Griffith
Sam Rice RF 3.65 23.99 Clark Griffith
Charlie Jamieson LF 3.09 19.11 Clark Griffith
Joe Judge 1B 2.12 19.08 Clark Griffith
Jack Bentley SP 1.96 11.78 Clark Griffith
Firpo Marberry SP 1.48 17.72 Clark Griffith
Frank Brower 1B 1.05 5.27 Clark Griffith
Irish Meusel LF 0.98 16.78 Clark Griffith
Doc Prothro 3B 0.9 5.89 Clark Griffith
Bing Miller RF 0.83 13.65 Clark Griffith
Ossie Bluege 3B 0.72 10.42 Clark Griffith
Ted Wingfield RP 0.67 2.54 Clark Griffith
Joe Martina SP 0.35 5.74 Clark Griffith
Bucky Harris 2B 0.32 13.31 Clark Griffith
Earl McNeely CF 0.3 5.84 Clark Griffith
Eddie Ainsmith C 0.11 0.45 Thomas Noyes
Carl East RF 0.09 0.36 Clark Griffith
Ike Davis SS 0.02 0.35 Clark Griffith
Howie Shanks SS -0.02 5.21 Thomas Noyes
Bennie Tate C -0.02 0.64 Clark Griffith
Carr Smith RF -0.13 0.04 Clark Griffith
Tommy Taylor 3B -0.13 0.85 Clark Griffith
Showboat Fisher RF -0.14 0.4 Clark Griffith
By Speece RP -0.25 3.52 Clark Griffith
Slim McGrew SP -0.27 0.32 Clark Griffith
Paul Zahniser SP -0.28 3.72 Clark Griffith
Pinky Hargrave C -0.35 0.21 Clark Griffith
Mule Shirley 1B -0.5 0.34 Clark Griffith
Frank Ellerbe 3B -0.9 2.19 Clark Griffith

Honorable Mention

The “Original” 1915 Senators             OWAR: 49.1     OWS: 272     OPW%: .565

“Big Train” Johnson (27-13, 1.55) completed 35 of 39 starts while leading the American League in wins, WHIP (0.933), innings pitched, shutouts and strikeouts. The rotation was supplemented by Doc Ayers (14-9, 2.21) and Bert Gallia (17-11, 2.29). Clyde “Deerfoot” Milan swiped 40 bags and Tom Long legged out 25 triples at the top of the lineup.

The “Original” 1965 Twins                 OWAR: 46.0     OWS: 280     OPW%: .644

Zoilo Versalles topped the leader boards with 126 tallies, 45 doubles, 12 triples and 308 total bases to capture the 1965 A.L. MVP Award. Teammate Tony Oliva (.321/16/98) finished runner-up in the MVP race and collected his second batting title. Bob Allison, Jimmie Hall and Harmon Killebrew slammed at least 20 circuit clouts apiece. Jim Kaat (18-11, 2.83) anchored the starting staff and Ted Abernathy led the League with 31 saves and 84 relief appearances.

On Deck

The “Original” 1992 White Sox

References and Resources

Baseball America – Executive Database

Baseball-Reference

James, Bill. The New Bill James Historical Baseball Abstract. New York, NY.: The Free Press, 2001. Print.

James, Bill, with Jim Henzler. Win Shares. Morton Grove, Ill.: STATS, 2002. Print.

Retrosheet – Transactions Database

Seamheads – Baseball Gauge

Sean Lahman Baseball Archive


Testing the Eye Test: Part 2

Sorry for the relatively long delay – sometimes life gets in the way of our best laid plans. In case you want a refresher, here is part 1: http://www.fangraphs.com/community/testing-the-eye-test-part-1/

In part 1, I found that, counter to my expectations, range correlated most strongly with FSR data of all the UZR components (UZR itself had a stronger correlation with FSR). I expected the strongest-correlated component to be errors, which was actually one of the least-correlated components. However, I wanted to go a little bit farther and look at the difference between correlations between the UZR components and FSR and the correlations between the UZR components and UZR itself to get a sense of what the fans weight more than UZR does. As a reminder, here is the data set I compiled for this analysis:

“I pulled the defensive stats of every player who qualified (minimum of 900 innings) at a position from 2009-2014 (FSR data is only available for those six seasons on FanGraphs). I then disregarded catchers, as UZR does not cover the position. Likewise, pitchers are left out because they are not covered by UZR or FSR. That left me with 761 player seasons across the other seven positions.”

Without further ado, here are the correlations between UZR and its components:

Position |# |ARM |DPR |RngR |ErrR
1B |118 |N/A |0.207 |0.930 |0.326
2B |117 |N/A |0.275 |0.907 |0.465
3B |107 |N/A |0.166 |0.948 |0.386
SS |130|N/A |0.459 |0.866 |0.384
LF | 71 |0.584 |N/A |0.895 |0.196
CF |115 |0.357 |N/A |0.935 |0.069
RF |103|0.310 |N/A |0.906 |0.061

I always had a suspicion that range was the most important component of UZR but these results are insane. It turns out range is far and away the most important component of UZR. Interestingly, the weakest correlation for range is at SS, perhaps because shortstops without proper range are moved to another position. ARM, although only calculated for outfielders (a real shame as Andrelton Simmons deserves credit for being able to make this throw), has the second-strongest correlation but lags range by a large amount. Like the FSR correlation, it is surprising that LF has a stronger ARM correlation than CF or RF. DPR narrowly edges out errors, although the correlation for errors is far stronger when you only consider infielders. Now, to get a sense of the difference, here’s the two sets of correlation subtracted from each other (positive numbers mean the correlation with UZR is higher and negative numbers mean the correlation with FSR is higher):

Position | # | ARM | DPR | RngR | ErrR
1B | 118 | N/A | -0.005 | 0.644 | 0.006
2B | 117 | N/A | 0.116 | 0.437 | -0.082
3B | 107 | N/A | 0.011 | 0.315 | 0.125
SS | 130 | N/A | 0.095 | 0.437 | 0.041
LF | 71 | 0.074 | N/A | 0.369 | 0.010
CF | 115 | 0.120 | N/A | 0.441 | -0.002
RF | 103 | 0.096 | N/A | 0.365 | -0.006

There are two different ways to look at this: one is that FSR has nearly the same correlation as UZR in most categories. That’s good! It lends a lot of credibility to FSR to know that you can predict FSR nearly as well as UZR with ErrR or DPR. On the other hand, look at the huge difference in the range column. It appears that the fans are severely underestimating the importance of having great range (or have different ideas of how to evaluate range). That’s a problem! As we just saw, range is the most important component of UZR for every position. It is also not terribly surprising as I hypothesized at the beginning of this series that the fans are underestimating the importance of range in favor of flashier tools. This also explains a lot of the discussion about Derek Jeter’s defensive ability (or lack thereof).

This sums up the research portion of this series. I think all of this does lend a lot of credence to FSR: it does reflect that range is the most important component of defense and it does a good job of properly ranking the importance of the other components. In addition, the correlation between FSR and UZR is fairly strong but not so strong that the two systems are interchangeable. However, when considering FSR, be sure to mentally adjust when a player has particularly good (or bad) range.

In part 3, I will examine some of the player seasons that produced the most disparity in the two rankings.


A Decade of DH: The Mariners Post-Edgar Martínez

Edgar Martínez is kind of a demigod in Seattle. If you drive west past Safeco Field, parallel to the first-base line, you’re doing so on Edgar Martínez Drive (hang a right at home plate and you’re on Dave Niehaus Way).

He’s the only one of the franchise’s most celebrated players, besides hopefully Felix, to have spent his entire career with the Mariners organization, something Ken Griffey Jr. and Ichiro can’t lay claim to. His game-winning double in the 1995 ALDS is the Seattle Sports Moment to many, and it was just a quarterfinal, Super Bowl/’79 NBA Finals/1917 Stanley Cup be damned.

He’s also the greatest designated hitter of all time, and if not the greatest (which he is, in a completely objective manner of speaking untainted by my personal preferences) the player who perfectly typifies the designated hitter position. For years he has been the barometer of the DH, the mark by which all who came before and all who shall come after will be evaluated – Frank Thomas and Jim Thome weren’t purebred designated hitters the way Edgar was. Although Edgar won his first batting title playing third base, a hamstring injury relegated him to the DH role, so he was the only one of the three to primarily play designated hitter for most of his career, unlike Thomas and Thome, who spent much more time in the field. Also, Frank Thomas was an absolutely filthy pitcher in Backyard Baseball 2003, as well as complete garbage as a hitter in that very same game, so don’t you tell me that designated “hitter” is his primary position.

seriously this makes no sense

But whatever Edgar Martínez meant to the DH position went tenfold for the Mariners. For me Edgar’s retirement was in a way the turning of a page for the franchise, but his loss as a Mariners icon could ostensibly be counteracted somewhat by roster stalwarts Ichiro, Dan Wilson, Bret Boone, and Jamie Moyer (duh), among others.

What would change almost irreparably was the Seattle Mariners’ designated hitter slot that Martínez vacated when he retired.

2015 marks the Mariners’ eleventh season since Martínez’s retirement, meaning that a full decade has passed in the majors without Edgar on the Mariners. The first step in our journey into an Edgar-less world begins with a ranking of cumulative fWAR at the DH position by team from 2005 (the Mariners’ first season without Martínez) to 2014.


The first thing you’ll notice seems pretty intuitive, which is that the top 15 teams are all American League teams – this obviously makes sense because the DH rule is only applicable in the American League, so it would logically follow that the fifteen American League teams would have accrued the most Wins Above Replacement in the major leag-

wait, hold up – philadelphia????????

where are the mariners

um

ok

lemme just scroll down to find them, one sec

..

….

…………

uhhhhhhhhhhhh

So Mariners designated hitters rank 27th, which means that between the Mariners and the Astros, twelve – TWELVE National League teams, who only employ a designated hitter for a handful of games per season (interleague away games to be exact), have produced more fWAR at that position over the last decade than the Mariners, who use a designated hitter on pretty much a daily basis.

In fairness, the explanation for this seems logical: the defensive fWAR penalty for the designated hitter position (the highest of any defensive position) is cumulative – it increases with the amount of innings played at any given position. The Mariners have accrued ungodly of amounts value above below replacement by trotting out consistently bad DH production, whereas the magnitude of damage a National League DH can do to his team’s aggregate replacement value is limited by sample size. Something that I don’t completely understand is that FanGraphs’ data on National League players DHing seems to be incomplete, but maybe it just has something to do with eligibility not lining up with FanGraphs data or the fact the sample size of National League DHs is inadequte. Perhaps having all National League DHs accounted for just wouldn’t be worth the effort or be statistically significant.

Even if we remove the National League from the equation, the Mariners are still dead last in their own league by quite a bit. The next-worst team, Houston, has been in the American League for all of two full seasons and has managed to comfortably outpace Seattle (upon further examination this is made more impressive by the fact that one of those seasons, Chris Carter’s 37-dinger campaign in 2014, doubles Seattle’s cumulative fWAR over the entire decade in magnitude). But then again as stated before, Seattle have incurred a penalty for having adhered to the DH rule since its inception, whereas Houston have only had two seasons to let the DH penalty pile up.

In order to ascertain exactly what shenanigans could have gone down with the M’s DH position such that all Seattle DHs from 2005-2014 collectively managed to produce fewer wins than Edgar’s farewell 2004 season (his worst by fWAR, totaling -0.5), here’s a fond look back at some of the Mariners’ highlights at DH over the past decade (min. 100 PA), ordered by total fWAR produced for the Mariners.

1. Russell Branyan, 2009 & 2010, 125 wRC+, 3.4 fWAR

FanGraphs lists Branyan first in highest total accumulated fWAR post-Martínez for any Seattle DH, which makes sense, because his 2009 116-game stint with the Mariners was quite good-until you realize that he played all of those games for the Mariners at first base, meaning that 2.7 wins of these 3.4 weren’t even put up from the designated hitter slot. Fun fact: Branyan’s 2009 season, in which he swatted 31 homers and posted 126 wRC+, is the only season since 2006 in which a Mariners player has hit 30 homers (2013 Ibañez missed this mark by just one home run).

On the bright side, Branyan returned to the Mariners via trade in June of 2010, and this time he actually put in some time at DH. He managed to do quite well for himself, with 121 wRC+ in 238 plate appearances, and 25 of his 44 hits went for extra bases. After a couple 2011 stints with Arizona and Los Angeles, he then decided that playing for Seattle had ruined the major leagues for him and went on to play only in minor-league and Mexican league games for the rest of his career.

2. John Jaso, 2012, 143 wRC+, 2.6 fWAR

Jaso shared catching and DH duties with Jesus Montero in 2012, and in only 108 games became the second-most valuable position player on the team by fWAR behind Kyle Seager. Jaso also had the third-highest walk of rate of any position player in baseball (min. 350 PA) in 2012 and was Felix Hérnandez’s batterymate for his perfect game against the Tampa Bay Rays.

The Mariners then infamously dealt Jaso to division rival Oakland in a three-team deal that yielded a return of Michael Morse, former Mariner just coming off a career year with Washington in 2011. Morse played half of the 2013 season before injury caught up to him and he was shipped off to Baltimore.

Jack Z could lead the Mariners to 4 consecutive titles and be the executive of the year each of those years and Mariners fans (myself included) would probably still find time to complain about the Jaso-Morse Trade for some reason. Jaso is currently back with Tampa Bay and is currently injured, but his 2013 and 2014 seasons were still much better collectively than what the Mariners fielded during that same time period.

3. Mike Sweeney, 2009-10, 111 wRC+, 0.7 fWAR 

At the same time Russell Branyan was busy dirtying himself in the field and hitting big hits, the Mariners extended 2 non-roster invites in 2 consecutive years to great Royals player, great hitter, and great all-around guy Mike Sweeney (who doesn’t have a picture on his Wikipedia profile, but Yuniesky Betancourt does….?). Making the team both times, Sweeney was a productive hitter for the Mariners in 2009 and 2010 and was traded to the Phillies, they of the 15th-ranked DH fWAR, in time for the NLDS, where he was able to collect a hit in his first and only postseason at-bat (against Aroldis Chapman, no less). He then signed a one-day contract to retire a Royal. It’s nice to feel good about something tangentially Mariners-related every once in a while, especially because after we move past Sweeney on this list things start to get a little dicey.

4. Kendrys Morales, 2013 & 2014, 108 wRC+, 0.2 fWAR

Morales was one of the better hitters on a largely uninspiring 2013 Mariners team, boasting a .342 wOBA and a 119+ wRC, both of which would have led the team if not for an incredibly strange Raul Ibañez season. The Twins signed Morales as a free agent the following offseason for $7.6 million, which was kind of strange but made sense if they could turn that value into something. It turns out that something was the Mariners’ Stephen Pryor, and Morales ended up back in Seattle, where he had effectively iced his chances of cashing in on a qualifying offer from the Mariners a year ago. In 2014, Morales put up -0.8 fWAR for Minnesota and -1.0 fWAR for Seattle, by far the worst year of his career.

5. Jack Cust, 2011,  97 wRC+, -0.1 fWAR

A profile of Jack Cust came up on the Jumbotron at Safeco Field once while I was in attendance at a Mariners home game, in which he stated that his favorite quote was “play hard”, a nugget of wisdom Cust attributed to himself. The combination of that Jumbotron quote and Cust’s .116 ISO for the Mariners in 2011 continues to be one of the more perplexing relationships I’ve observed to date, as is the 97 wRC+ (Cust’s wRC on the season was 20).

6. Jose Vidro, 2007-08, 94 wRC+, -0.2 fWAR

Vidro, who leads the players on this list in plate appearances with 955, spent almost two seasons with the Mariners (2007 & 2008). His 2007 season with Seattle wasn’t bad – his .775 OPS was just above league average, his 10.1 BB% was just above league average, and his .345 wOBA was just above league average. Vidro decided to use 2008 to erase most of the solid work he had done in the previous year, cutting his walks in half, getting on base 70% as often, and found himself designated for assignment and later released that summer.

7. Greg Dobbs, 2004-06, 74 wRC+, -0.3 WAR

Dobbs didn’t really play enough to be remembered as outright terrible, usually taking backup duty at third base and then being relegated to a pinch-hitting/DH role in 2005/2006. Before we move on, there’s a couple interesting notes about Dobbs.

First, Greg Dobbs hit a home run in his first at-bat with the Mariners (and his first major league at-bat), which would turn out to be the only home run he would hit in 2004. This isn’t particularly notable except for the fact that it always reminds me that Miguel Olivo also homered in his first major league at-bat, which I will never forget for some incredibly frustrating reason. “Miguel Olivo homered in his first major league at-bat. He was with the Chicago White Sox and the home run was off Andy Pettitte”. This useless piece of information has been wasting my neural capacity ever since I read it on some Mariners gameday program, which I think had Richie Sexson on the cover, so I’m jointly blaming Sexson and Olivo both for forcing me to remember that information and also for being pretty underwhelming with the Mariners.

The second thing is Dobbs’ 2006 season, in which he was only around for 28 PA in 23 games, 18 of which he came in as a pinch-hitter. In those games he managed 150 wRC+ on a cool .435 BABIP. He also walked 0 times. Ultimately it was only 28 PA, an absurdly silly sample size, and clearly the Mariners felt similarly, because they waived out of him in 2007, whereupon Pat Gillick, now with the Phillies, decided to take a second chance on Dobbs long enough for him to earn a World Series ring in 2008.

8. Jeff Clement, 2006-09, 90 wRC+, -0.3 fWAR

Yeah, let’s just not go there.

9. Milton Bradley, 2010-11, 83 wRC+, -0.5 fWAR

Bradley contributed -0.5 fWAR in his time with the Mariners and interestingly enough, being bad at baseball may have been one of the better things he did in Seattle.

10. Carl Everett, 2006, 72 wRC+, -0.8 WAR

Carl Everett was a two-time All-Star in Boston, put up a six-win season with the Astros, and found himself signed by the Mariners for the 2006 season, where he had his worst offensive season by far. Everett was league-average in B% and K% and that was about it. Everett was released in July of 2006 at the age of 35, having posted -0.8 fWAR in 92 games. You could say he was getting to be a bit of a dinosaur, but don’t tell Carl Everett anyone said that about him.

11. Ben Broussard, 2006-07, 88 wRC+, -0.8 fWAR

Broussard was acquired by the Mariners from Cleveland in the second half of the 2006 season, filling in mostly at DH after Carl Everett’s dismissal; in that time-frame Broussard’s figure of 78 wRC+ is not particularly inspiring, and only slightly bests Everett’s. Broussard then spent most of his first and only full season (2007) for the Mariners switching between first base and the corner outfield spots, His overall 88 wRC+ was a slight improvement but still not great, especially while the man Bill Bavasi gave up to acquire Broussard, Shin-Soo Choo, has produced 24.3 fWAR since the 2007 season.

Back to Broussard, though:

12. Eduardo Perez (2006), 48 wRC+, -0.8 fWAR

I don’t think I really have to say anything here.

13. Jesus Montero (2012-), 83 wRC+, -0.9 fWAR

Jesus Montero is now somewhat of a tragic figure among Marinerds. In the 2012-2013 offseason, Montero claimed that he had a coach who had helped him ‘learn to run’, which I guess if you haven’t yet is probably a good idea. He then cut his 2013 season short by getting suspended for his involvement in the Biogenesis snafu. Last August, he got into a bizarre altercation. Montero’s role in the organization has strayed far from the top hitting prospect the Mariners traded Michael Pineda(who’s now the #3 in New York) for. Montero continues to toil away in the Mariners’ farm system (reports out of Tacoma yesterday were that he legged out an infield single), in the hopes he can top 2013’s terrible 64 wRC+. Montero is still only 25, so it’s not as if all hope is lost, but the fact remains that his on-field production at the major league level has been nothing short of disappointing.

14. Ken Griffey, Jr. [1989-99(omitted), 2009-10], 84 wRC+, -0.9 fWAR

Nobody was expecting 90s Griffey Jr. the ballplayer, which was convenient because he didn’t show up. Griffey was only mediocre in 2009, with a wRC+ of 97 and a wOBA of .324, rendering him merely replacement-level (0.0 fWAR). 2010 was a different story. Griffey Jr. posted a depressingly bad 32 wRC+ in 108 plate appearances. Amid issues with Don Wakamatsu restricting his playing time and the bizarre rumor of Griffey napping during a potential pinch-hit opportunity, things came to a head in June of 2010, when Griffey abruptly left the club, drove home, and announced his retirement before the next days game. The Kid’s return to Seattle was a welcome dip into the nostalgia-drenched coffers of yesteryear for a struggling ballclub, and before anyone had time to process it, the sweetest swing in baseball was silenced in a flash.

15. Corey Hart (2014), 70 wRC+, -1.1 fWAR

Hart has the lowest single-season WAR of any player on this list. The Mariners paid $6 million with $7 million in undisclosed incentives for a year of Hart coming off a knee surgery that caused him to miss all of 2013, which at the time seemed to be a reasonable gamble for a high-risk commodity that could potentially have paid great dividends. Unfortunately, Hart struggled to stay healthy and perform. playing only 68 games in the season; the midseason acquisition of Kendrys Morales certainly didn’t help. Ultimately the Mariners’ front office decided to take a gamble with Hart and lost.


BONUS ROUND (fun with small sample sizes): Scott Spiezio in 2005

Scott Spiezio in 2004 was simply a bad infielder and player, posting a miserable .288 OBP, 67 wRC+, among other poor statistics on his way to putting up a below replacement-level season of -0.1 fWAR.

Big deal though – it’s one bad season. Besides, if you look up on that same list, Carl Everett put up -0.8 fWAR in 92 games. Eduardo Perez did it in 43!

This is nothing to Scott Spiezio.

Again, the sample size here is ridiculously small, but the absurdity of the numbers he managed to log in 29 games is honestly kind of impressive. The Mariners released him from here and he then went on to win the World Series with St. Louis, even hitting a game-tying triple in Game 2 of the 2006 NLCS, so fortunately he was of some use to a team after that 2005 season.


In fairness, the designated hitter is not an incredibly stable position in today’s game. It doesn’t make sense to pay a premium for a skill that can be replicated by other hitters who can also play competent defense. There are only a handful of “conventional” designated hitters in the league, and even Victor Martinez and his -31.1 UZR/150 in 2014 are called upon to play defense every once in a while. For whatever reason – be it sentimentality with Griffey or having the odds stacked against them with Hart or just because Bavasi (Clement, Broussard), the Mariners have gotten an extraordinarily poor level of performance out of their designated hitters in an Edgar-less world, with some bright spots (Jaso, Branyan, 1 season of Kendrys Morales).

This season, Seattle will call on 2014 home-run king Nelson Cruz to fill in most nights at DH (at least as long as Seth Smith and Justin Ruggiano are healthy enough to man right so Cruz doesn’t have to). In 10 years of trying to fill Edgar’s place, the Mariners haven’t quite succeeded and probably won’t ever do so, but wouldn’t it be something to see them come close?


Gausmanian Distribution

At the end of spring training, Buck Showalter banished Kevin Gausman from the rotation in favor of Ubaldo Jimenez, a pitcher with a much higher salary and much less talent.  Many assumed that Jimenez’ salary largely dictated the move. Yes, he outpitched Gausman in spring training (4.44 ERA to 7.04), but it’s hard to believe that Showalter invests very much in spring training stats, and in any case if you put “4.44” into Google Translator, “success” is unlikely to be one of the resulting character strings.

One Orioles fan of my acquaintance heard that Showalter’s decision had more forethought: Buck’s intent may be to use Gausman much as the fireman reliever of old, and bring him in to critical situations in ballgames regardless of today’s ossified reliever usage patterns. Bill James long ago established that this is the most effective way to use a top-flight reliever, but it is less clear that this is the best way to use a potential #1 starter. Gausman is the only pitcher on the Orioles 25-man roster who has even  a prayer of turning into an ace, and it seems unlikely he’ll do it from the pen.

Gausman’s had a somewhat unusual start to his career. In his first two years as a major leaguer, he started 25 games and made 15 relief appearances. There are a total of 15 active pitchers who had at least 25 starts and 15 relief appearances in their first two years:


(Table courtesy of the invaluable Baseball Reference Play Index)

It’s certainly an eclectic mix. Only Buehrle established himself as an ace, though Arroyo has had a good career as a mid-rotation workhorse, and Masterson and (to a lesser extent) I-Can’t-Believe-It’s-Not-Fausto-Carmona have made useful contributions. For other starters on this list (Wood, Kelly) it’s too soon to tell. Affeldt and Stammen wisely gave up starting and have become bullpen mainstays. More sobering, many of the names on this list have had their careers derailed by injuries. It’s hard to know whether the mixed usage contributed to injury problems for guys like Ogando, Billingsley, and Holland; it is equally possible that conserving these young arms early may have averted even more serious or earlier arm trouble.

Gausman sits uneasily here; he is by far the highest drafted pitcher on this list (fourth overall in 2012). It is unsurprising to see a club experiment with a 38th-round pick who struggles to break a pane of glass, like Buehrle. Such tinkering is less common with a player drafted to be a rotation anchor. Indeed, there are only two other first-rounders on this list, Billingsley and Lynn.

In his first season (2006), Billingsley started 16 games and came in from the bullpen twice. He put up a respectable 3.80 ERA, but with atrocious peripherals (5.8 BB/9, 5,9 K/9). The Dodgers understandably exiled him to the bullpen to start the 2007 season, but Dresden-like pyrotechnics from Proven Veterans Mark Hendrickson, Brett Tomko, and Jason Schmidt forced the Dodgers to put Billingsley back in the rotation in June, and he acquitted himself reasonably the well the rest of the way. He would go on to have uneven success over the next four seasons until diagnosed with a torn UCL in September 2012. He has pitched in two major league games since.

Lance Lynn offers a happier comp for Gausman. He appeared largely in relief (2 starts in 18 games) in 2011. Despite Kyle McClellan’s runtastic performance as the Cardinals’ fifth starter, LaRussa elected not to insert Lynn into the rotation; the Cardinals instead traded for Edwin Jackson, who stabilized the fifth spot.  This seems similar to Showalter’s choice: go with the established if not necessarily dominant veteran in lieu of the risky young flamethrower. Lynn had put good numbers in 2011 at AAA, but not in 2010. The Cards’ reluctance to turn over a rotation spot to him in the midst of a playoff run was understandable. Lynn has been in the rotation since 2012, and has consistently produced very close to his career marks of 3.32 FIP and 2.71 K/BB, despite some jumpiness in his ERA.

Both these examples tend to suggest Showalter is making a mistake. The Dodgers finally ran out of Jason Schmidts, while the Cards went with the good-enough E-Jax (and, to  be fair, won the World Series). But in each case the young replacement would quickly prove himself superior to the older and supposedly safer option when finally given the chance. There are very few who would predict that, over the course of 30 starts, Jimenez will outperform Gausman in any significant statistical category.

But Showalter has other things on his mind. Specifically, this:

#27 Orioles


Name IP ERA FIP WAR
Chris Tillman 184.0 4.10 4.40 1.4
Wei-Yin Chen 169.0 4.04 4.17 1.5
Miguel Gonzalez 157.0 4.42 4.84 0.5
Bud Norris 154.0 4.15 4.30 1.1
Ubaldo Jimenez 146.0 4.28 4.38 0.9
Kevin Gausman 91.0 3.97 4.00 0.9
Dylan Bundy 18.0 4.40 4.56 0.1
Total 919.0 4.17 4.38 6.4


Yep, this is the FanGraphs Depth Chart projection for the Orioles starting rotation, with the O’s ranked 27th out of 30. Not a single starter checks in with a FIP under 4.00. This is a shaky rotation, and the Orioles have no quick way of making it better. Eventually, perhaps as early as next year Gausman, Bundy, and Hunter Harvey will form an enviable top 3, but there’s another problem on Buck’s plate. Next year, much of the current roster may be lost to free agency, including Chris Davis, Matt Wieters, Chen, and Norris. The Orioles are under enormous pressure to win now.

And Gausman can help! Because at this stage of his career, he is a much better reliever than starter. The big difference is in strikeouts:

AL average starter K/9: 7.1

AL average reliever K/9: 8.3

Gausman as starter K/9: 7.0

Gausman as reliever K/9: 11.7

That there is some major whiffage for a staff in dire need of it. Put Gausman together with Zach Britton, Darren O’Day, and Tommy “Big Game” Hunter, and the Orioles have a fully weaponized bullpen.  Buck’s plan is to hold on for the first five or six innings, and them shut down the opponent’s offense while the Orioles bats bludgeon their way to victory. And with Gausman acting as a mobile reserve, Showalter can shrink the innings for which the starters are responsible, but do so on a game-to-game basis. On those days when the starters happen to be effective they can go longer, and on those days (more often than not, one suspects) that they get into trouble, Showalter will be able to address some of that trouble with the best arm on the roster.

This isn’t the way I would ordinarily do it, but then again, this isn’t the roster I would have assembled. Showalter has repeatedly shown an ability to work with the tools he has rather than impose some prefabricated tactical rule set that disregards the strengths and weaknesses of his players. Baltimore’s road to the playoffs is neither straight nor sure, but at least it’s Showalter behind the wheel.


Insurance in Baseball is Like a Black Hole

How much gravity does insurance have in Major League Baseball front office decisions?

Puns aside, let me tell you the funny thing about a black hole. You see astronomers cannot really see one, instead they are detected through their effects on the universe around them. Although less extreme, insurance is similar in this regard on its impact on baseball teams. Most teams insure some of their larger contracts in case their players cannot play due to an exterior factor such as injury. Perhaps the impacts of this major facet of the game does not cross our mind often because it is not eminently visible. However, make no mistake that insurance is a major factor when teams make major decisions regarding the DL, contract extensions, playing time and so on.

First, consider the history of baseball insurance to better understand why it impacts baseball. It can be said that by the late 1990s it had become common place for teams to insure their larger contracts. The first time baseball and insurance first truly started getting media attention was with Albert Belle in 2001 due to confusion over his insurance contract. Albert Belle had suffered a career-ending hip injury with the Orioles. Fans grew excited however despite the disheartening news when in 2002 the all-star slugger was added back onto the Orioles’ 40 man roster. Disappointed Orioles fans can tell you that Belle never played another MLB game however. Instead, he was added back onto the 40-man roster so the Orioles could collect insurance on his contract (some MLB insurance contracts do not cover a player unless they remain on the 40-man roster). At the time the MLB insurance contract covered the remainder of the salary owed on Belle’s contract. According to writer Michael Branda, the Orioles recovered an astounding 27.3 million out of a 39-million-dollar loss represented by Belle’s injury. Since the huge losses on Belle’s contract in the early 2000s, insurers in baseball have become much more stringent with their underwriting in baseball contracts.

Belle was not the only reason for teams being more stringent with their underwriting. The associated risks with insuring a MLB player have increased. One reason is PEDs. The MLB really did not enforce its ban on PEDs up until the late 2000s, but now being caught using PEDs can result in a significant loss in playing time. According to MLB Trade Rumors a syndicate of the MLB, Ervin Santana a first-time offender was suspended for 80 games on April 3rd of 2015. Santana was expected to make 13.5 million dollars this season. Despite being suspended, the Minnesota Twins are expected to still have to pay half of Santana’s salary (only players caught for the second time or more for steroids lose most of their salary).

To account for this insurers enforce a 60 to 90 day deductible policy in order to shield themselves from these sort of losses as well as claims made for short-term injuries. In addition to the 90 day deductible insurance policies are typically term policies of about three years with an option for renewal after the conclusion of the contract. As a result, if a contract proves to incur severe losses the liabilities will be only in the short term. Obviously to further protect themselves insurers only cover players with no preexisting injuries and all players must be inspected by the insurer. Furthermore, with wide variability and unpredictability in player health an insurer can in a way readjust its rate every three years to better reflect the player’s risk of not playing.

These more stringent underwriting practices have influenced the game, oftentimes when deciding when to take a pitcher off of the DL. Adam Kilgore of the Washington Post explained it best when he talked about how in 2012 Stephen Strasburg was “shut down” during a playoff push for the Nationals due to potential health concerns. In this decision there appeared to be a delicate balance between contention and the considerations of the insurance company that would not have covered Strasburg if he had been injured due to these health concerns. It is not crazy to think that finances come into play when making a decision on baseball players. Jeff Moorad, a decision maker for the Padres explained that in 2010 Chris Young was eligible to come off the DL. The Padres ultimately chose to put Young back on the field but Moorad added, “the accounting department much preferred that he [had stayed] on the disabled list.”

Baseball insurance has grown steadily more expensive. Although it is difficult to ascertain how much a team actually spends on insurance it is clear that it can be a burden for smaller teams. For instance, the Arizona Diamondbacks’ rotation once featured the dominant starting pitcher Brandon Webb. Between 2006 and 2008 Brandon Webb made three all-star games and finished first, second and second respectively in Cy Young voting. In this span Webb also led the league in innings pitched once. In essence Webb was due for a large payday once his contract expired. However contract negotiations between Webb and the Diamondbacks hit a snag in June of 2008. Despite a track record as a durable starter, no insurance company was willing to write a policy for injury risk to the Diamondbacks hurler. The reason is because insurance companies refused to accept the risk of Webb injuring his arm or if they were willing to, they were going to charge exorbitant rates.

As a result, the Diamondbacks could not get an insurance contract that did not have an exclusion on arm, shoulder or elbow injuries, all vital and injury-prone body parts for pitchers. According to AZCentral, a news outlet that covers the Arizona Diamondbacks, due to Webb not being insurable the Diamondbacks broke off all contract negotiations. In the long run, this proved to be a smart move since ten months later after contract talks ceased Brandon Webb never pitched in the majors again due to injuries. The point of this is that not only is baseball insurance so expensive it can prove to be impractical, it shows that most insurers are unwilling to insure some pitchers. Walt Jocketty, the former general manager for the middle-market St. Louis Cardinals explained that insurance has “become so expensive that it’s a cost item we really have to look at when you put your payroll together.”

In addition to insurance contracts altering how teams manage their rosters they influence how teams treat their players. In essence there is a human side to these contracts. Consider Josh Hamilton who is in the middle of a massive five-year, 125-million-dollar contract with the Angels and who has been playing quite ineffectively relative to his salary. Josh Hamilton who recently suffered a relapse on his drug addiction before the 2015 season is a prime example of insurance influencing teams to treat their players in a way they hopefully normally would not. Despite being a repeat offender, an arbitrator chose not to suspend Hamilton for any period of time. What makes this story scandalous is the Angels’ seemingly acerbic response to this news. It appears that the Angels almost wanted Hamilton to be suspended to spare them the expense of his failed contract. Clearly the Angels have little incentive to help Hamilton recover from his addiction. Instead, it is in their interest to see that Hamilton never plays another game of baseball again because if he does not play for an extended period of time the Angels can potentially collect insurance and definitely reduce their payroll.

Insurance influences baseball more than many people may realize. When it comes to playing time, DL decisions and contract negotiations, insurance seems to be an integral piece in the decision-making process. For me though, part of what makes baseball great is the inherent competition of players, often with disregard to their own body (*cough* Adam Eaton *cough*). There is little harm of teams protecting themselves from the inherent risks of baseball players becoming injured. The risk is that insurance becomes an incentive for teams to make decisions that may be bad for the game, such as not playing players for financial gain. Let’s hope that ultimately, teams do not get engulfed into this black hole.


Hardball Retrospective – The “Original” 1999 Texas Rangers

In “Hardball Retrospective: Evaluating Scouting and Development Outcomes for the Modern-Era Franchises”, I placed every ballplayer in the modern era (from 1901-present) on their original team. Therefore, Fergie Jenkins is listed on the Phillies roster for the duration of his career while the Pirates claim Barry Bonds and the Rays declare Carl Crawford. I calculated revised standings for every season based entirely on the performance of each team’s “original” players. I discuss every team’s “original” players and seasons at length along with organizational performance with respect to the Amateur Draft (or First-Year Player Draft), amateur free agent signings and other methods of player acquisition.  Season standings, WAR and Win Shares totals for the “original” teams are compared against the “actual” team results to assess each franchise’s scouting, development and general management skills.

Expanding on my research for the book, the following series of articles will reveal the finest single-season rosters for every Major League organization based on overall rankings in OWAR and OWS along with the general managers and scouting directors that constructed the teams. “Hardball Retrospective” is available in digital format on Amazon, Barnes and Noble, GooglePlay, iTunes and KoboBooks. The print edition is coming soon. Additional information and a discussion forum are available at TuataraSoftware.com.

Terminology

OWAR – Wins Above Replacement for players on “original” teams

OWS – Win Shares for players on “original” teams

OPW% – Pythagorean Won-Loss record for the “original” teams

Assessment

The 1999 Texas Rangers         OWAR: 50.4     OWS: 284     OPW%: .512

GM Tom Grieve acquired 79% (38 of 48) of the ballplayers on the 1999 Rangers roster. 38 of the 48 team members were selected through the Amateur Draft process. Based on the revised standings the “Original” 1999 Rangers placed six games behind the Mariners in the American League Western Division race. Texas (83-79) claimed the Wild Card by a one-game margin over Chicago and Kansas City.

Perennial All-Star backstop Ivan Rodriguez enhanced his trophy case with the 1999 A.L. MVP award. “Pudge” produced a .332 BA while notching career-bests in home runs (35), RBI (113), runs scored (116), base hits (199) and stolen bases (25). Rodriguez collected 13 Gold Glove Awards including 10 in consecutive seasons (1992-2001). “Slammin’” Sammy Sosa launched 63 moon-shots, drove in 141 baserunners and registered 114 tallies. Juan “Igor” Gonzalez belted 39 round-trippers, knocked in 128 runs and delivered a .328 BA after an MVP season in the previous campaign.

Fernando Tatis (.298/34/107) enjoyed a career year over at the hot corner, scoring 104 runs and swiping 21 bags. Rusty Greer clubbed 41 doubles, 20 big-flies and plated 101 baserunners while eclipsing the .300 mark for the fourth successive season. Rich Aurilia (.281/22/80) and Mike Stanley (.281/19/72) supplied additional thump towards the bottom of the lineup. Warren Morris parlayed a .288 BA and 15 long balls into a third-place finish in the Rookie of the Year balloting.

Rodriguez slots into 13th place in “The New Bill James Historical Baseball Abstract” among backstops. He certainly elevated his ranking after playing ten additional years following the publication of NBJHBA in 2001. Right fielders Sosa and Gonzalez are listed in 45th and 52th place, respectively.

LINEUP POS WAR WS
Warren Morris 2B 1.71 15.4
Ivan Rodriguez C 5.22 28.63
Fernando Tatis 3B 5.05 23.74
Sammy Sosa RF 4.98 26.64
Juan Gonzalez DH/RF 2.88 24.42
Rich Aurilia SS 3.06 18.11
Rusty Greer LF 2.32 21.03
Mike Stanley 1B 1.82 13.67
Terrell Lowery CF -0.17 3.21
BENCH POS WAR WS
Rey Sanchez SS 2.59 11.29
Jose Hernandez SS 2.3 16.33
Dean Palmer 3B 1.04 16.71
Hanley Frias SS 0.22 4.42
Edwin Diaz 2B 0.17 0.62
Kevin L. Brown C 0.12 0.58
Jon Shave SS 0.09 1.98
Bill Haselman C -0.04 3.84
Jeff Frye 2B -0.13 2.35
Ruben Mateo CF -0.26 1.9
Kelly Dransfeldt SS -0.26 0.8
Chad Kreuter C -0.58 3.51

Kevin J. Brown, the undisputed ace of the Texas rotation, compiled a record of 18-9 with a 3.00 ERA, 1.066 WHIP and 221 strikeouts. The balance of the starting staff submitted sub-par efforts in contrast to their career norms. Jeff Zimmerman (9-3, 2.36) fashioned a 0.833 WHIP and received an invitation to the Mid-Summer Classic during his rookie campaign.

ROTATION POS WAR WS
Kevin J. Brown SP 5.54 19.92
Darren Oliver SP 3.94 12.45
Rick Helling SP 3.78 12.52
Kenny Rogers SP 2.97 11.57
Wilson Alvarez SP 1.89 9.95
BULLPEN POS WAR WS
Jeff Zimmerman RP 3.67 14.64
Mike Venafro RP 1.19 7.36
Mark Petkovsek RP 0.84 9.49
Terry Mathews RP 0.31 2.54
Danny Kolb RP 0.13 1.9
Brian Bohanon SP 1.63 9.68
Ryan Dempster SP 1.45 6.98
Jim Brower SP 0.42 1.87
Robb Nen RP 0.07 7.89
Danny Patterson RP -0.08 2.64
Mike Cather RP -0.17 0
Corey Lee RP -0.2 0
Jonathan Johnson RP -0.26 0
Bobby Witt SP -0.28 4.52
Billy Taylor RP -0.3 5.54
Dan Smith SP -0.34 1.73
Tony Fossas RP -0.39 0
Ryan Glynn SP -0.42 0
Scott Eyre RP -0.66 0
Doug Davis RP -0.66 0
Julio Santana SP -1 0.17
Matt Whiteside RP -1.1 0

The “Original” 1999 Texas Rangers roster

NAME POS WAR WS General Manager Scouting Director
Kevin Brown SP 5.54 19.92 Tom Grieve Sandy Johnson
Ivan Rodriguez C 5.22 28.63 Tom Grieve Sandy Johnson
Fernando Tatis 3B 5.05 23.74 Tom Grieve Sandy Johnson
Sammy Sosa RF 4.98 26.64 Tom Grieve Sandy Johnson
Darren Oliver SP 3.94 12.45 Tom Grieve Sandy Johnson
Rick Helling SP 3.78 12.52 Tom Grieve Sandy Johnson
Jeff Zimmerman RP 3.67 14.64 Doug Melvin Chuck McMichael
Rich Aurilia SS 3.06 18.11 Tom Grieve Sandy Johnson
Kenny Rogers SP 2.97 11.57 Eddie Robinson Joe Klein
Juan Gonzalez RF 2.88 24.42 Tom Grieve Sandy Johnson
Rey Sanchez SS 2.59 11.29 Tom Grieve Sandy Johnson
Rusty Greer LF 2.32 21.03 Tom Grieve Sandy Johnson
Jose Hernandez SS 2.3 16.33 Tom Grieve Sandy Johnson
Wilson Alvarez SP 1.89 9.95 Tom Grieve Sandy Johnson
Mike Stanley 1B 1.82 13.67 Tom Grieve Sandy Johnson
Warren Morris 2B 1.71 15.4 Doug Melvin
Brian Bohanon SP 1.63 9.68 Tom Grieve Sandy Johnson
Ryan Dempster SP 1.45 6.98 Doug Melvin Sandy Johnson
Mike Venafro RP 1.19 7.36 Doug Melvin Sandy Johnson
Dean Palmer 3B 1.04 16.71 Tom Grieve Sandy Johnson
Mark Petkovsek RP 0.84 9.49 Tom Grieve Sandy Johnson
Jim Brower SP 0.42 1.87 Tom Grieve Sandy Johnson
Terry Mathews RP 0.31 2.54 Tom Grieve Sandy Johnson
Hanley Frias SS 0.22 4.42 Tom Grieve Sandy Johnson
Edwin Diaz 2B 0.17 0.62 Tom Grieve Sandy Johnson
Danny Kolb RP 0.13 1.9 Doug Melvin Sandy Johnson
Kevin Brown C 0.12 0.58 Tom Grieve Sandy Johnson
Jon Shave SS 0.09 1.98 Tom Grieve Sandy Johnson
Robb Nen RP 0.07 7.89 Tom Grieve Sandy Johnson
Bill Haselman C -0.04 3.84 Tom Grieve Sandy Johnson
Danny Patterson RP -0.08 2.64 Tom Grieve Sandy Johnson
Jeff Frye 2B -0.13 2.35 Tom Grieve Sandy Johnson
Terrell Lowery CF -0.17 3.21 Tom Grieve Sandy Johnson
Mike Cather RP -0.17 0 Tom Grieve Sandy Johnson
Corey Lee RP -0.2 0 Doug Melvin
Ruben Mateo CF -0.26 1.9 Doug Melvin Sandy Johnson
Jonathan Johnson RP -0.26 0 Doug Melvin Sandy Johnson
Kelly Dransfeldt SS -0.26 0.8 Doug Melvin
Bobby Witt SP -0.28 4.52 Tom Grieve Sandy Johnson
Billy Taylor RP -0.3 5.54 Eddie Robinson
Dan Smith SP -0.34 1.73 Tom Grieve Sandy Johnson
Tony Fossas RP -0.39 0 Eddie Robinson
Ryan Glynn SP -0.42 0 Doug Melvin Sandy Johnson
Chad Kreuter C -0.58 3.51 Tom Grieve Sandy Johnson
Scott Eyre RP -0.66 0 Tom Grieve Sandy Johnson
Doug Davis RP -0.66 0 Doug Melvin
Julio Santana SP -1 0.17 Tom Grieve Sandy Johnson
Matt Whiteside RP -1.1 0 Tom Grieve Sandy Johnson

Honorable Mention

The “Original” 2001 Rangers              OWAR: 48.4     OWS: 278     OPW%: .513

Sosa shredded opposition pitching to the tune of a .328 BA while launching 64 moon-shots, registering 160 RBI and scoring a League-best 146 runs. Aurilia delivered career-bests with a .324 BA, 37 dingers, 97 ribbies and 114 tallies as he topped the circuit with 206 safeties. Gonzalez swatted 35 big-flies and knocked in 140 baserunners. Zimmerman notched 28 saves and Brown furnished a 2.65 ERA in 19 starts.

On Deck

The “Original” 1924 Senators

References and Resources

Baseball America – Executive Database

Baseball-Reference

James, Bill. The New Bill James Historical Baseball Abstract. New York, NY.: The Free Press, 2001. Print.

James, Bill, with Jim Henzler. Win Shares. Morton Grove, Ill.: STATS, 2002. Print.

Retrosheet – Transactions Database

Seamheads – Baseball Gauge

Sean Lahman Baseball Archive


Are Two Opening-Day Homers Merely Dust-in the Wind?

As a Red Sox fan, I got very excited opening day when Dustin Pedroia hit two home runs. One of the big questions of this offseason is whether he has upper-single-digit homer power, or upper-teens homer power. Of course, as a thinking baseball fan, my head tells me to avoid getting overly excited about a small sample size. But does the two-HR outbreak actually tell us nothing? I think the expectations going into the season combined with Pedroia’s performance in his first game is a perfect situation to use Bayes’ Theorem.

To elaborate, I think Pedroia’s expectations going into this season have a bimodal distribution. If you look at his 2008-2012 seasons, he averaged 16 HR per year. His last two seasons averaged 8 HR per year. Was this due to a real decline, or due to injuries that sapped his power? While someone like Mike Trout might have a nice normally-distributed expectation around 35 HR, I expected Pedroia to have an either/or season: he’d either get back to 2008-2012 production, or continue as a 8-HR guy.

Now for a review of Bayes’ Theorem: it tells you how to update your prior beliefs given an observation. The formula for this is P(A|B) = P(B|A)*P(A)/P(B), where A and B are events, P(A) and P(B) are the probabilities of those events, and P(A|B) or P(B|A) should be read as “Probability of A given B,” or “Probability of B given A,” respectively. Specifically, in this case, A is “Dustin Pedroia is a 16-HR guy”, and B is “Dustin Pedroia hit 2 HR in his first game of the season”. I had a preseason belief about P(A), but I want to update it given that event B has occurred.

As implied above, I’m going to simplify Pedroia’s season outcomes into two possible outcomes: He is an 8-HR guy, or a 16-HR guy. Before the season, I’m going to guess that I had about a 50-50 belief that he was either one. Another assumption I’m going to make, to make the math easier, is that a season will see 640 plate appearances. You can make your own assumptions, but this is a demonstration of how much Bayes’ Theorem helps us update beliefs based on just one observation.

We need to determine three quantities to do our calculation now:
1. P(A)—probability that Pedroia is a 16-HR guy
2. P(B|A)—probability that we would see Pedroia hit 2 HR in his first 5 plate appearances, given that he is a 16-HR guy
3. P(B)—probability that we would see Pedroia hit 2 HR in his first 5 plate appearances (taking our 50-50 chance that he’s a 16 or 8-HR guy as a given)

1. Probability that Pedroia is a 16-HR guy

Easy. By assumption, P(A) is 50%.

2. Probability that we would see Pedroia hit 2 HR in his first 5 plate appearances, given that he’s a 16-HR guy

Tougher, but we can use a binomial probability model. That is 5C2*P(HR)^2*(1-P(HR))^3. When we have 16 HR in 640 plate appearances, P(HR) is 1/40, and 1-P(HR) is 39/40. This turns out to be .00579. P(B|A)= 0.579%.

3. Probability that we would see Pedroia hit 2 HR in his first 5 plate appearances, with preseason assumptions

This is the weighted average of all his possible season outcomes—so probability of 2HR in 5PA, given that he is a 16-HR guy, times the chance that he’s a 16-HR guy, PLUS, probability of 2HR in 5PA, times the chance that he’s an 8-HR guy. The same calculation as in number 2 can be done for if he’s an 8-HR guy, yielding an answer that the chance that he’d hit 2HR in 5PA is 0.151%. Given our calculation in the above paragraph, and our preseason assumption that it’s 50-50 that he’s an 8 or 16-HR guy, that gives us a weighted average P(B) = 0.365%.

So now we can mash all of those numbers into Bayes’ equation, and we find that .50*.00579/.00365 = .794, or 79.4%! Turns out that my Red Sox-loving lizard brain was not wrong! If you believed preseason that there was a 50%-50% chance that Pedroia would return to his 2008-2012 form, you should rationally update your beliefs to 80%-20% on the minuscule sample size of just two home runs in five plate appearances! Another note is that we should be forward-looking: since he has nearly a full season of plate appearances remaining, it might be rational to think that he’s likely to be an 18-HR guy, now that he has 2 in the bag.

This method could be adapted to a continuous expectation of outcomes, allowing a chance that Pedroia might be something besides an 8HR guy or a 16HR guy (although you and I know that that is clearly absurd).


Z-Scores in Sports (a Supporting Argument for zDefense)

This is part 3 of the Player Evaluator and Calculated Expectancy (PEACE) model, which is an alternative to Wins Above Replacement.  This article will introduce evidence that z-scores can be converted into runs (or points in other sports) with accuracy and reliability, as well as analyze the results that zDefense has produced.

Recall that zDefense is broken down into 4 components: zFielding, zRange, zOuts, and zDoublePlays.  The fielding and range components depend on the accuracy of Calculated Runs Expectancy, which I introduced in Part 1.  Outs and double plays, though, use a different technique: they take z-scores for the relevant rate statistics, then multiply by factors of playing time.  Here were the equations:

  • zOuts = [(Player O/BIZ – Positional O/BIZ) / Positional O/BIZ Standard Deviation] * (Player Innings / Team Innings) * (√ Player BIZ / 2)
  • zDoublePlays = [(Player DP/BIZ – Positional DP/BIZ) / Positional DP/BIZ Standard Deviation] * (Player Innings / Team Innings) * (√ Player BIZ / 2) * Positional DP/BIZ


We can set up models in other sports that estimate point differentials using very similar techniques.  I’ve developed one for college football and another for the NBA.

For the first model, I’ve used the data for every Division I FBS football team from 2000-2014 (1,802 teams), and I defined the relevant statistics and their “weights” as such:

  • zPassing = [[Completion Percentage z-score * Completions per Game] + [Passing Yards per Attempt z-score * Passing Attempts per Game]] / 10
  • zRushing = [Rushing Yards per Attempt z-score * Rushing Attempts per Game] / 10
  • zTurnovers = [Turnovers per Game z-score]
  • zPlays = [Number of Offensive Plays per Game z-score] 


These 4 components summed make up zOffense, while taking each team’s opponents’ calculations results in zDefense.

What I found after summing the different components was that the resulting number, when divided by the number of games played, was a very accurate estimator for a team’s average point differential.

Among the nearly 2,000 college football teams, the average difference between zPoints (calculated margin of victory) and actual MOV was just 3.21 points, with a median of 2.77, and a max difference of 13.97 points.  About 20% of teams’ MOV were calculated to within 1 point or less, 53% were accurate to 3 points or less, 79% to 5 points or less, and 99% to 10 points or less.  The regression model for this dataset can be seen below:

http://imgur.com/kUDwbA7


The NBA model has similar results using 6 parts:

  • z3P (3-point shots) = [[3P FG% z-score * 3-point attempts * 3] / 10
  • z2P (2-point shots) = [2P FG% z-score * 2-point attempts * 2] / 10
  • zFreeThrows = [FT% z-score * free throw attempts] / 10
  • zTurnovers = [Turnovers per Minute z-score * League Average Points per Possession] * 2
  • zORB (offensive rebounds) = [Offensive Rebounds per Minute z-score * League Average Points per Possession]
  • zDRB (defensive rebounds) = [Defensive Rebounds per Minute z-score * League Average Points per Possession] 


Similar to the football model, these 6 components make up zOffense, while each team’s opponents’ calculations make zDefense.  I particularly like z3P, z2P, and zFT because they multiply the z-score by the “weight”: 1, 2, or 3 points.  Recall that zRange is multiplied by the IF/OF Constant, which is just the difference, on average, in runs between balls hit to the outfield vs. balls that remain in the infield.

I’ve only done the calculations for the 2013-2014 season, where teams averaged 1.033 points per possession.  To convert to zPoints in this model, add zOffense and zDefense, then divide by 5.

In most seasons, elite teams will have an average point differential of +10, while terrible ones will hover around -10.  On average, the NBA model had an average difference between the calculated and actual differential of just 1.331 points, with a median of 0.800.  17 out of 30 teams were calculated within 1 point, 25 within 2, and 29 out of 30 were accurate to within 5 points per game.

The fact that these models can be created using the same general principle (rate statistic z-scores multiplied by a factor of playing time equates relative points) provides some evidence that similar results are calculable in baseball.  This is the basis for zDefense in PEACE.  Let’s look at the results.

Most sabermetricians would turn to the Fielding Bible Awards for a list of the best fielders by position in any given year, so we’ll use those results to compare.  If we assume that the Fielding Bible is accurate, then we would expect zDefense to produce similar conclusions.  Comparing the 2014 winners to the players ranked as the best at their position by zDefense, we can see some overlap.  The number in parentheses is the positional ranking of the Fielding Bible Award winner by zDefense.

  • Position: Fielding Bible Winner (#)…zDefense Winner
  • C: Jonathan Lucroy (12)…Yadier Molina
  • 1B: Adrian Gonzalez (1)…Adrian Gonzalez
  • 2B: Dustin Pedroia (2)…Ian Kinsler
  • 3B: Josh Donaldson (2)…Kyle Seager
  • SS: Andrelton Simmons (8)…Zack Cozart
  • LF:Alex Gordon (1)…Alex Gordon
  • CF: Juan Lagares (3)…Jacoby Ellsbury
  • RF: Jason Heyward (1)…Jason Heyward
  • P: Dallas Keuchel (5)…Hisashi Iwakuma

The multi-position winner, Lorenzo Cain, was also rated very favorably by zDefense.  While most positions don’t have a perfect match, every single Fielding Bible winner was near the very top of their position for zDefense.  This is the case for almost every instance, which isn’t surprising: if there were drastic disagreements about who is truly elite, then we would suspect one of the metrics to be egregiously inaccurate.  Instead, we see many similarities at the top, which provides some solid evidence that zDefense is a valid measure.

As always, feel free to comment with any questions, thoughts, or concerns.


Tommy John Surgery and Throwing 95+ MPH

Nowadays all the rage seems to be about Tommy John surgeries, as it should be. The number of players who’ve had the surgery is rising at an alarming rate. Therefore many studies have been done on the issue. Most notably by Jeff Zimmerman and John Roegele, who have combined forces to create the biggest and most complete list of Tommy John surgeries. This led them to delve into many studies, such as the effects of Tommy John on performance, the success rate of the surgery, the effects of velocity, the effects of certain pitches, etc… Therefore I decided to do my part.

While a lot has already been done on Tommy John surgeries, not a lot of studies have examined the percentage of hard-throwing pitchers who have had the surgery. Jeff Zimmerman did look at pitchers who hit 100 MPH or more and the percentage of them who have had Tommy John (25% had the surgery). What I will be doing, however, is somewhat different. I will look at the pitchers whose fastball averaged 95 or more and the percentage of them who have had Tommy John surgery, as requested by Jeff, “Help Out: While I looked at pitchers who threw over 100 mph, 100 may not me the key number. Maybe it’s 97 mph, or 95 mph. The increase in velocity and increase in TJS can’t be ignored. It is time to perform a more thorough assessment.”

Before I dive into this, some of you reading might not be familiar with Tommy John surgeries, so I’ll give a brief explanation. If you are, however, then you can probably skip this paragraph. Tommy John surgeries or the ulnar collateral ligament (UCL) reconstruction is a surgical procedure where a ligament in the medial elbow is replaced with a tendon from elsewhere in the body. The procedure was first performed in 1974 on a pitcher called Tommy John, by Dr. Frank Jobe; the surgery was named after Tommy John. The procedure is rather devastating and it will usually take around a year for a pitcher to get back onto the field. Now, some pitchers of course never make it back, and some pitchers come back but are never the same. The success rate of the recovery varies and is debatable; some have estimated it at around 80%. For a more elaborate explanation of the success rate I recommend reading Jon Roegele’s article here. The final element you should know is that the Tommy John surgery is on the rise; it’s being performed at an alarming rate, which has spurred many studies. Below is a graph of all the Tommy John surgeries performed since 1974 (not including the ones that occurred in 2015).

TMJ

So Tommy Johns are on the rise, and reached an all-time high in 2014. You know what’s also on the rise? Pitcher velocity. Since PITCH f/x was made available in 2007, there has been a steady and consistent increase in pitcher velocity. Both the rise in Tommy John surgeries and the rise in velocity seem to be linked. (The velocity below is on an average per year basis).

TMJ and Velocity

This, however, doesn’t mean that one causes the other. A big question, at the end of almost every Tommy John article, is the attempt to figure out or contemplate what is causing the increase in the surgery. Especially since it seems practically every pitcher that throws hard is getting the surgery, Zack Wheeler being the latest example. Hopefully what follows will show or will give some inclination into whether pitchers who throw hard are more likely to have the surgery.

So first I’ll explain my process. I went on Baseball Prospectus and I looked at every pitcher’s average velocity from 2007 to 2014. I looked at both starters and relievers and I didn’t set an innings limit, in order to get as big of a sample size as possible. Then I took every pitcher who threw 95 or over as the arbitrary definition of hard throwers, which left me with 191 pitchers. After I got every pitcher who 95 MPH or more and I looked up their injury history, to see whether or not they had received the surgery. Here is what I found; I also included the pitchers who threw 96+ MPH because while I was compiling the data, I thought I noticed a slight increase in Tommy John surgeries. A final element to note is that I didn’t look at Minor League pitchers, only the Major Leaguers because unfortunately there is no PITCH f/x data available for minor leaguers (at least that I know of).

Sample Size MPH Percentage of TMJ
191 95+ MPH 32.46%
95 96+ MPH 36.45 %

Of those pitchers who threw 95+ here’s a list of those who have had more than one Tommy John surgery:

Brian Wilson
Pedro Figueroa
Tyler Yates
Christian Garcia

Okay, so now what to make of this? 32.46% seems like an awful lot, but one needs to put it into perspective. Jeff Zimmerman in his “100MPH = Tommy John Surgery?” article pointed out that, “The number of major league pitchers with the surgery now stands at 33% according to Will Carroll.” I personally felt that that number was awfully high.

So I read Will Carroll’s article and found it somewhat problematic. “One-third of current MLB pitchers have had Tommy John surgery. Of the about 360 who started the season, 124 share the all-too-familiar triangular scar.” While I do respect Will Carroll’s work, why did he limit himself to the pitchers who started the season? And what does that even mean? Is it the pitchers who threw on opening day? Was it the pitchers on opening day rosters? Did he use an innings limit? At this point, I’m simply befuddled at how he came to the number of “360 pitchers”. Due to baseball’s Minor League system one first needs to define what qualifies as a Major League pitcher. I’m not sure that Carroll did that or rather cannot tell from his article how he did that. I think a more thorough study needs to be done. For example, not simply looking at the pitchers who start the season. I think a good barometer could be, to set an innings limit, for a certain amount of years and looking at the percentage of those pitchers who had Tommy John. I think that will give us a better sense of the total percentage of pitchers who have had the surgery. Or hell one could do it on a year-by-year basis.

As for this study, what we can conclude is that around one in three pitchers who throw 95+ MPH have to suffer the surgery. If we simply go by Will Carroll’s study, this doesn’t seem like it increases a pitchers chance of getting the surgery at all. I, however, think that with a more thorough study we will find that throwing harder does actually lead to more Tommy Johns. This is of course just a hypothesis, and by no means should be taken as fact. Also saying that 95 MPH is the benchmark for hard throwers is relatively arbitrary, maybe 94+ or 93+ MPH will give us different results.