Tommy John Surgery and Throwing 95+ MPH
Nowadays all the rage seems to be about Tommy John surgeries, as it should be. The number of players who’ve had the surgery is rising at an alarming rate. Therefore many studies have been done on the issue. Most notably by Jeff Zimmerman and John Roegele, who have combined forces to create the biggest and most complete list of Tommy John surgeries. This led them to delve into many studies, such as the effects of Tommy John on performance, the success rate of the surgery, the effects of velocity, the effects of certain pitches, etc… Therefore I decided to do my part.
While a lot has already been done on Tommy John surgeries, not a lot of studies have examined the percentage of hard-throwing pitchers who have had the surgery. Jeff Zimmerman did look at pitchers who hit 100 MPH or more and the percentage of them who have had Tommy John (25% had the surgery). What I will be doing, however, is somewhat different. I will look at the pitchers whose fastball averaged 95 or more and the percentage of them who have had Tommy John surgery, as requested by Jeff, “Help Out: While I looked at pitchers who threw over 100 mph, 100 may not me the key number. Maybe it’s 97 mph, or 95 mph. The increase in velocity and increase in TJS can’t be ignored. It is time to perform a more thorough assessment.”
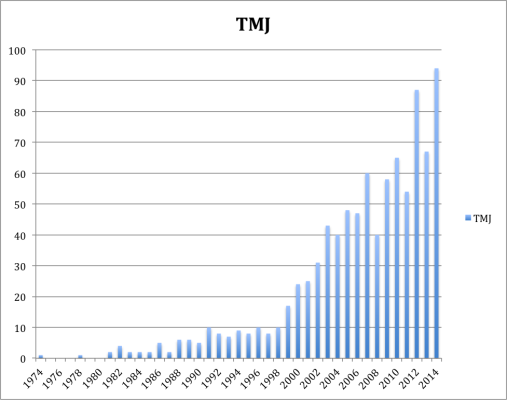
Before I dive into this, some of you reading might not be familiar with Tommy John surgeries, so I’ll give a brief explanation. If you are, however, then you can probably skip this paragraph. Tommy John surgeries or the ulnar collateral ligament (UCL) reconstruction is a surgical procedure where a ligament in the medial elbow is replaced with a tendon from elsewhere in the body. The procedure was first performed in 1974 on a pitcher called Tommy John, by Dr. Frank Jobe; the surgery was named after Tommy John. The procedure is rather devastating and it will usually take around a year for a pitcher to get back onto the field. Now, some pitchers of course never make it back, and some pitchers come back but are never the same. The success rate of the recovery varies and is debatable; some have estimated it at around 80%. For a more elaborate explanation of the success rate I recommend reading Jon Roegele’s article here. The final element you should know is that the Tommy John surgery is on the rise; it’s being performed at an alarming rate, which has spurred many studies. Below is a graph of all the Tommy John surgeries performed since 1974 (not including the ones that occurred in 2015).
So Tommy Johns are on the rise, and reached an all-time high in 2014. You know what’s also on the rise? Pitcher velocity. Since PITCH f/x was made available in 2007, there has been a steady and consistent increase in pitcher velocity. Both the rise in Tommy John surgeries and the rise in velocity seem to be linked. (The velocity below is on an average per year basis).
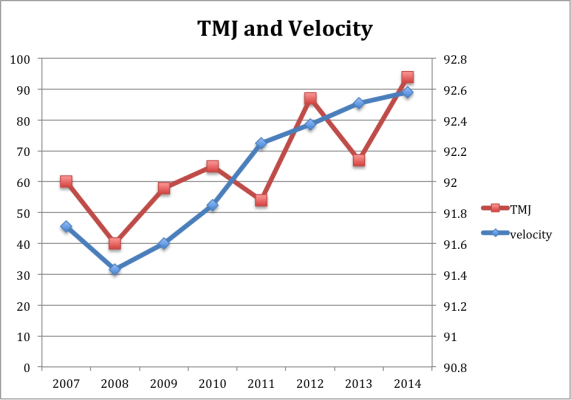
This, however, doesn’t mean that one causes the other. A big question, at the end of almost every Tommy John article, is the attempt to figure out or contemplate what is causing the increase in the surgery. Especially since it seems practically every pitcher that throws hard is getting the surgery, Zack Wheeler being the latest example. Hopefully what follows will show or will give some inclination into whether pitchers who throw hard are more likely to have the surgery.
So first I’ll explain my process. I went on Baseball Prospectus and I looked at every pitcher’s average velocity from 2007 to 2014. I looked at both starters and relievers and I didn’t set an innings limit, in order to get as big of a sample size as possible. Then I took every pitcher who threw 95 or over as the arbitrary definition of hard throwers, which left me with 191 pitchers. After I got every pitcher who 95 MPH or more and I looked up their injury history, to see whether or not they had received the surgery. Here is what I found; I also included the pitchers who threw 96+ MPH because while I was compiling the data, I thought I noticed a slight increase in Tommy John surgeries. A final element to note is that I didn’t look at Minor League pitchers, only the Major Leaguers because unfortunately there is no PITCH f/x data available for minor leaguers (at least that I know of).
| Sample Size | MPH | Percentage of TMJ |
| 191 | 95+ MPH | 32.46% |
| 95 | 96+ MPH | 36.45 % |
Of those pitchers who threw 95+ here’s a list of those who have had more than one Tommy John surgery:
| Brian Wilson |
| Pedro Figueroa |
| Tyler Yates |
| Christian Garcia |
Okay, so now what to make of this? 32.46% seems like an awful lot, but one needs to put it into perspective. Jeff Zimmerman in his “100MPH = Tommy John Surgery?” article pointed out that, “The number of major league pitchers with the surgery now stands at 33% according to Will Carroll.” I personally felt that that number was awfully high.
So I read Will Carroll’s article and found it somewhat problematic. “One-third of current MLB pitchers have had Tommy John surgery. Of the about 360 who started the season, 124 share the all-too-familiar triangular scar.” While I do respect Will Carroll’s work, why did he limit himself to the pitchers who started the season? And what does that even mean? Is it the pitchers who threw on opening day? Was it the pitchers on opening day rosters? Did he use an innings limit? At this point, I’m simply befuddled at how he came to the number of “360 pitchers”. Due to baseball’s Minor League system one first needs to define what qualifies as a Major League pitcher. I’m not sure that Carroll did that or rather cannot tell from his article how he did that. I think a more thorough study needs to be done. For example, not simply looking at the pitchers who start the season. I think a good barometer could be, to set an innings limit, for a certain amount of years and looking at the percentage of those pitchers who had Tommy John. I think that will give us a better sense of the total percentage of pitchers who have had the surgery. Or hell one could do it on a year-by-year basis.
As for this study, what we can conclude is that around one in three pitchers who throw 95+ MPH have to suffer the surgery. If we simply go by Will Carroll’s study, this doesn’t seem like it increases a pitchers chance of getting the surgery at all. I, however, think that with a more thorough study we will find that throwing harder does actually lead to more Tommy Johns. This is of course just a hypothesis, and by no means should be taken as fact. Also saying that 95 MPH is the benchmark for hard throwers is relatively arbitrary, maybe 94+ or 93+ MPH will give us different results.
Julien Assouline is a journalism student at Ryerson University, and writes for Baseball Prospectus Milwaukee. Follow him on Twitter @JulienAssouline.
The 360 pitchers who started the season are obviously the pitchers on the opening day roster. I don’t really think that’s unclear at all.
Why didn’t you just also list every pitcher who threw below 95? That would have been a great way to test your hypothesis and also test the mentioned study. If it wouldn’t show any menaingful difference then your hypothesis seems wrong that hard throwers have a higher TJS rate.
Suggestion: create buckets of avg velo and then draw a function that shows the relationship between FB velo and TJS rate for a respective bucket.
Example:
90-91 mph
n=50 pitchers
TJS% = 20/50 = 40%
91-92
n= 45 pitchers
TJS% = 15/45 = 33%
All numbers are purely for illustration.
Perhaps, then if they are I would have to question his results. I watched yesterday the SSAC15 study on TMJ, by Glenn Fleisig who found that around 16% of current Pitchers had Tommy John, and if I remember correctly 25% of them where in the Majors (although) I could be wrong on the last point. I recommend you watch it it’s really good.
As for your second point I’m currently in my finals period so I don’t have the time at this moment to do that. When I’m done, if no one else has done a larger study I will definitely dive into it. As for the buckets, I’ve thought about that. The problem is that for certain groups, the sample may simply be too small. When I have more time all try and look at it more closely.
Sure! =) This is all done voluntarily. Still a promising and interesting topic for further investigation.
You can contribute some of this to mechanics. A lot of the little tricks used to increase velocity also seem to contribute to injury concerns. If a pitcher can sit at 95 with a good natural motion, they are usually fine, but most pitchers need to do unsafe things to get to that velocity.
Some of those 124 pitchers who had received TJS must have had the surgery before they fully matured and began throwing “hard.” For example, High School and little league baseball.
Maybe the best thing to do would be to look at it over one season. What percentage of pitchers who threw over 95 mph that season ended up hurting their UCL.
vs. the percentage of pitchers who threw under 95 mph
Here is what I would do.
Make a table like this
Velocity (rounded to nearest whole) — # of Pitchers having Tommy John with that velocity
85
86
87
88
89
90
etc.
Then do a regression and see if there is a statistically significant correlation.
Thats a really good idea and something I’ve pondered doing. I will investigate this when i have more time, unless someone else beets me to it.