Archive for Player Analysis

Mike Trout and the HBP Risk

If you’ve ever looked at Mike Trout’s Baseball Reference page, you’ve seen a lot of black ink, indicative of leading the league in some offensive category. Trout is currently leading the league in a lot of such categories — and he has done so in the past. He’s likely to lead the AL in homers for the first time this year, and as noted recently by Ben Lindbergh, that would be the 10th category out of 17 basic ones at Baseball Reference that he’s led the league in at least once in his career. Only about two dozen players have led the league in more of these 17 categories at some point in their careers.

Trout is also leading the league in another category that would also be a first for him: hit by pitch (HBP). He’s been plunked 15 times this season (editor’s note: now 16), one more than Shin-Soo Choo as of this writing. HBP is not what you would call a sexy stat, but it does have value. It’s as valuable as a walk — in fact, per FG’s linear weights, a little more so, apparently because it occurs slightly more in base-out states that have higher run expectancy (RE) than average.

HBP, like walks, are valuable because they put a runner on base, where he has a chance to score, while simultaneously avoiding an out, thus giving another batter a chance. They’re a good thing. But they also come with a risk. If a batter is hit by a pitch, he could suffer a significant injury and miss time. The resulting lost time is lost value. This raises an obvious question: is the increased value gained by getting hit by pitches greater than the potential risk of losing value to injury? If it is — and one would assume that in this stat-savvy age, it would have to be — by how much? Read the rest of this entry »


Talking The Tauch

You probably didn’t pay much attention (or even notice) when the New York Yankees acquired 28-year-old outfielder Mike Tauchman from the Colorado Rockies in exchange for pitching prospect Phillip Diehl towards the end of spring training on March 23rd. Who could blame you? Tauchman’s major league resume to that point was ugly: a .153/.265/.203 slash line in 69 plate appearances over 52 games for the Rockies.

From 2013 to 2016 in the Rockies’ farm system, Tauchman hadn’t shown much in his age-22 to age-25 seasons. He displayed a decent hit tool but didn’t flash much power, combining for only eight home runs across four minor league seasons. If Tauchman wanted to crack Colorado’s major league roster, he needed to make a change.

Prior to the 2017 campaign, as reported by the New York Times’ James Wagner, Tauchman worked with Justin Stone, a hitting instructor at Chicago-based Elite Baseball Training. With three-dimensional sensors and plates that measure force, Stone, who was hired as a hitting consultant by the Chicago Cubs in 2018, used biomechanics to help Tauchman improve his swing. Stone and Tauchman found that he was transferring energy inefficiently from his lower half to his upper half. In scientific terms, Tauchman’s kinetic chain, or the sequence of movements that make up his swing, was off. With Stone’s help, Tauchman learned to use his lower half better when starting his swing, enhancing the transfer of energy up the kinetic chain.

The results were undeniable. Still in Triple-A, Tauchman improved his wOBA from .322 in 2016 to .399 in 2017 and .420 in 2018. His 139 wRC+ was good for the eighth-best mark in Triple-A in 2017. In 2018, his 153 wRC+ was fourth-best, just behind fellow 2019 breakouts Daniel Vogelbach and J.D. Davis as well as Astros top prospect Kyle Tucker. Tauchman’s power had definitely increased: he tripled his career home run mark with 16 homers in 2017 and swatted another 20 in 2018. The Yankees front office took notice and was intrigued enough by Tauchman’s minor league success to add him as a depth piece just before the 2019 season. Read the rest of this entry »


A Better Understanding of Pitch Overlays

I make pitching gifs on a regular basis. In fact, there are dozens of other accounts on Twitter that do it as well. We participate in trying to help other fans understand what happens during plate appearances that go beyond what meets the eye. They can be great for seeing pitch shapes and how they contrast each other, but it’s important to know that there are some factors that can make them a bit deceptive (I myself have been guilty of making more out of an overlay that there actually is).

Overlays can be good for viewing how pitches move in relation to each other or noticing how different spin and axis affect the shape of a pitch. The Athletic’s Joe Schwarz is great at writing about and breaking that stuff down with the help of another gif-creating giant, ‘cardinalsgifs‘.

These two use gifs to demonstrate how a pitcher has made adjustments, for better or worse, and compare how it impacted the shape of their respective pitch. Having a good camera angle for that practice matters as we are less concerned about how the hitter sees the pitch and more about how certain tweaks can alter its personality.

Most MLB cameras do not lend themselves to a good visual representation of an event. You’re not getting the actual pitch shape nor are you getting the real trajectories from the hitter’s perspective. Even direct-level views (via the Braves, Marlins, or Orioles, to name a few) aren’t always beneficial, especially if you’re trying to make a point of how “filthy” or “nasty” pitches are to hitters. Read the rest of this entry »


playerElo: Factoring Strength of Schedule into Player Analysis

*Note: All numbers updated to August 12th, 2019*

Introduction

Consider the following comparison between Freddie Freeman (29) and Carlos Santana (33). Both players were starters for the 2019 All-Star teams of their respective leagues, and both are enjoying breakout seasons beyond their usual high production level, with nearly identical statistics across the board.

  PA wOBA xwOBA wRC+
Freeman, 1B 533 0.400 0.398 146
Santana, 1B 503 0.390 0.366 142

However, I argue that there is an underlying statistic that makes Santana’s success less impressive and Freeman’s worth MVP consideration. Recall the quality of competition of pitchers faced. The Atlanta Braves’ division, the NL East, contains the respectable pitching competition of the Mets (13th in league-wide in ERA), Nationals (15th), Marlins (16th), and Phillies (19th). Contrast this with the competition of the Cleveland Indians in the AL Central: The Twins (ninth), White Sox (22nd), Royals (24th), and Tigers (28th). Over 503 plate appearances, Santana has faced a top-15 pitcher (ranked by FIP) just 15 times, compared to 46 times by Freeman over 533 plate appearances. wRC+ controls for park effects and the current run environment, while xwOBA takes into account quality of contact, but all modern sabermetrics fail to address the problem of Freeman and Santana’s near-equal statistics despite widely different qualities of competition. Thus, I present the modeling system of playerElo. Read the rest of this entry »


Edwin Diaz’s Running Fastball

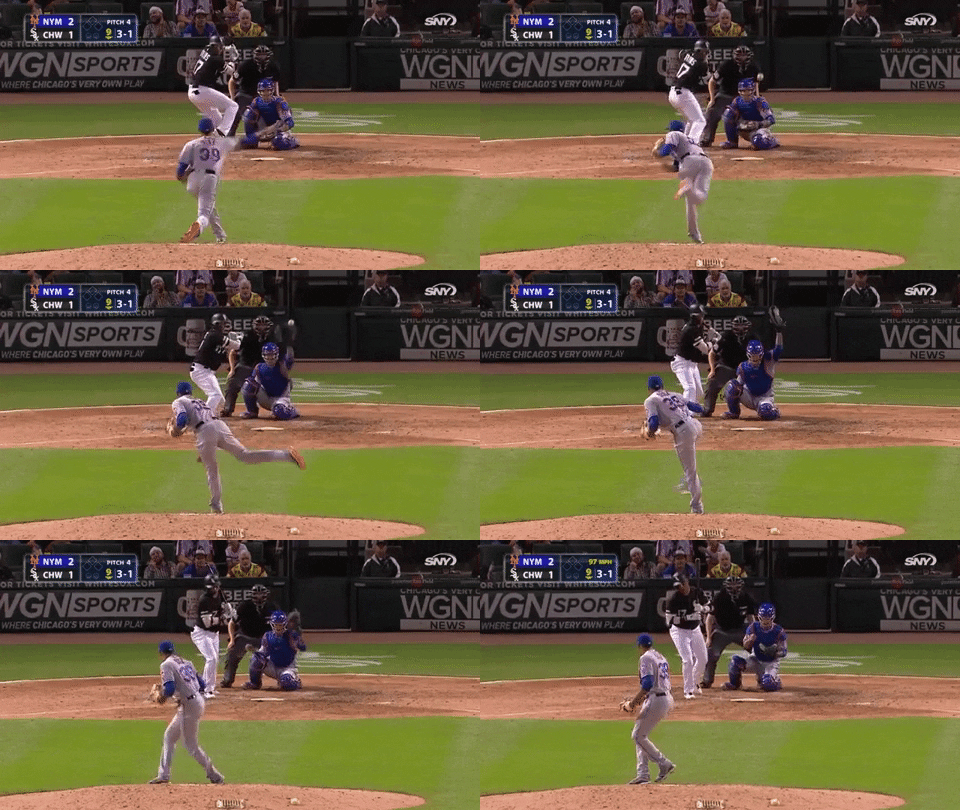
Edwin Diaz is having an absolutely miserable season. A year after posting a 1.96 ERA (208 ERA+), he currently holds an ERA of 5.32 (78 ERA+). He has already given up 10 homers in 44.0 innings, whereas last year he gave up just 5 in 73.1 frames. Some of his stats, such as his strikeout rate of 14.5% and walk rate of 3.3%, while less impressive than last year, are sitting at about his career averages. Mets mananger Mickey Callaway has often cited his mechanics as the main problem, and that when he throws more “sidearm,” it is a recipe for disaster. To get a visual of this difference, notice the release point on the following two pitches:


Notice how Diaz’s arm is much flatter in the first picture. The release point is a bit farther from his body and significantly lower. Pitches released in that way have too often resulted in a running fastball:


From this angle, however, it is difficult to see the exact difference in release point because one may be farther forward than the other. Consider the following table that tells a more detailed story: Read the rest of this entry »


What’s Next for Chris Archer?

The trade and struggles of Chris Archer have been well-documented by the baseball community. As many patrons of this very website know, Archer was sent from the Rays to the Pirates at the 2018 trade deadline for Austin Meadows, Tyler Glasnow, and a player to be named later, who was revealed as Shane Baz. Both Meadows and Glasnow have been very productive at the major league level for the Rays, while Baz is FanGraph’s 63rd-rated prospect on THE BOARD, carrying a future value of 50.

Archer, on the other hand, has been an unmitigated disaster. The once-tantalizing strikeout artist has delivered a 5.01 ERA paired with a 5.05 FIP. He has still struck out batters at a 26.0% rate, but his walk rate with the Bucs has surged to 10.1%. The main culprit for Archer’s spell of bad performance has been home runs; Archer has always tended to give up more fly balls than the average hurler, but since his move to Pittsburgh, 19.6% of his fly balls have gone over the fence, about 6% more than league average over that time span. Naturally, this leaves all of us baseball fans wondering, what happened to the pitcher who just four years ago was deemed by Dave Cameron as one of the 10 most valuable assets in MLB?

The Pirates were once thought of as one of the savviest organizations in baseball, a team that could spin washed-up pitchers into innings-eating workhorses. Detailed in Travis Sawchik’s book Big Data Baseball, the Pirates were one of the first teams to weaponize the infield shift. Pirates pitchers under the tutelage of pitching coach Ray Searage have been taught to rely on sinkers and two-seamers and to induce ground balls that can be gobbled up by the shift. As hitters have adjusted to the shift and focused on putting balls in the air, the Pirates’ approach of tailing fastballs low in the strike zone has become outdated. What was once the fountain of youth for veteran pitchers has become the focus of ridicule from the more analytically inclined. Read the rest of this entry »


Inside Aaron Bummer’s Transformation, or How to Make a Lights-Out Reliever From Scratch

A look at the relief pitcher ERA leaderboard yields names many baseball fans are now familiar with. Felipe Vazquez, Adam Ottavino, and Ken Giles have been in the spotlight before. The breakout seasons for All-Star trio Kirby Yates, Shane Greene, and Liam Hendriks have been well documented. Will Harris has been quietly dominant for multiple years. Even Scott Oberg had 200 innings of respectable relief pitching under his belt entering this year.

And then there is Aaron Bummer. Like most of his teammates on the White Sox who don’t routinely flip their bats into near-earth orbit, Bummer is fairly anonymous to the baseball world at large. Yet he has been without question the best arm in a surprisingly respectable White Sox bullpen, notching 49 innings across 41 appearances in 2019, posting a 1.65 ERA that is good for third amongst qualified relief pitchers.

Bummer is an outlier on this leaderboard in more than name recognition. The names ahead of him are racking up the strikeouts, with Yates posting a 14.58 K/9 to go with his 1.08 ERA while Hendriks holds 12.42 and 1.30 marks, respectively. Bummer averages a measly 7.88 K/9 by comparison. Few other relievers with such stellar ERAs have struck out batters at the low rate that Bummer has.

Bummer has largely accomplished this through an astronomical 68% ground-ball rate, surpassed by only worm-burner sensei Zack Britton. So how did this 19th-round relief-only prospect who topped out at 23rd on any White Sox prospect list turn into a ground-ball machine with one of baseball’s most effective fastballs? Let’s take a look. Read the rest of this entry »


Dissecting Jack Flaherty’s Approach Against Lefties

In 2018, Jack Flaherty took significant strides towards looking like a potential front-of-the-rotation starter for the St. Louis Cardinals. He posted a 3.34 ERA across 151 innings, striking out nearly 30% of the batters he faced, while holding a 3.58 xFIP. Additionally, he maintained strong numbers against both righties and lefties. As a result, expectations for Flaherty in 2019 were high. Projection systems called for an ERA between 3.30 and 3.60, which placed Flaherty among the top 15-20 pitchers in baseball, depending on the algorithm. However, through 97 innings in 2019, Flaherty has fallen short of those marks. Going into the All-Star break, the young righty held a 4.64 ERA with a 4.07 xFIP. Peripherally, his strikeout rate (K%) is down 3%, his ground-ball rate (GB%) is down 5%, and his hard-hit% is up as well. Investigating further, one of the biggest differences between Flaherty’s 2018 and 2019 seasons is his performance against left-handed hitters.

Flaherty2018Splits

While worse than his performance against righties, in Flaherty’s .275 wOBA against left-handed hitters in 2018 ranked eighth out of all right-handed pitchers with more than 300 total lefties faced, and his 26.8% strikeout rate against them ranked twelfth. Those numbers place him around pitchers like Aaron Nola, Jose Berrios, and the 2018 version of Mike Foltynewicz. Those are good pitchers! However, Flaherty’s performance against lefties in 2019 has not held up — take a look at the numbers.

FlahertyLHHSplits18-19.png

It’s easy to see, but through the first half of the 2019 season, Flaherty has been drastically less productive. His surrounding numbers paint the whole picture: the average exit velocity from lefties has risen from 81.9 mph to 84.4 mph, with their GB% dropping from 42.5% to 35.8%. Lefties have been replacing those ground balls with batted balls in the air, as his FB% went from 34.4% to 41.8%. It doesn’t help either that his HR/FB rate has nearly doubled across the two seasons. The bottom line is that lefties are hitting him harder, and when they do so, their results are better. Read the rest of this entry »


Gerrit Cole’s Strikeout Rates Continue to Reach New Heights

There is arguably not another starting pitcher in the majors better at striking out opposing hitters right now than Gerrit Cole. Not only does he lead all starters in total strikeouts (216) and strikeout rate (36.4%), the Astros’ right-hander is also second in strikeout-per-nine innings (12.90 K/9). Only Chris Sale (13.09 K/9) has a higher strikeout-per-nine rate. Cole’s progression as a strikeout artist is noteworthy when compared to his last season in Pittsburgh.

Cole’s strikeout surge has been driven, partially at least, by an increased reliance on his four-seam fastball in recent seasons, which, by average spin rate, is one of the more interesting pitches in baseball. In fact, the 28-year-old also leads all starters in strikeouts generated by four-seam fastballs with 119. The resurgent Lance Lynn is second in this measure with 91 strikeouts while notable hurlers Sale and Max Scherzer are third and fifth with 87 and 81 results, respectively. Again, Cole’s progression in this area with his four-seam fastball since departing from Pittsburgh continues to impress. Read the rest of this entry »


Nick Madrigal and Baseball Preconceptions

I’ve talked about Nick Madrigal a lot in the last year and a half. There are tons of players in affiliated baseball, but I’ve spent more time on Twitter, in the Baseball Farm GroupMe, doing Google news searches, and just thinking about this diminutive middle infielder than any other player since he came on my radar in the spring of 2018.

Why? His profile is just divisive. The skillset is so strange and unique that he poses a lot of questions without easy answers. Madrigal challenges your preconceptions on what makes a “good” baseball player. He does not pass the eye test. If you feel you can project how he will perform in a future large sample of performance data by watching him swing the bat, you will not project him to do much, as he looks like your nephew playing Cal Ripken Baseball. If you like looking for player comps when evaluating a player, you will find few, as he presents tools that we haven’t seen in this combination in the minor leagues in at least the past 15 years.

If you guess at what his value could be, you will be wrong. It’s too hard to conceptualize, too many moving parts, too much math. I know, because I’ve tried it! Move a guy up “a little bit” because you like the athleticism, down “below those guys” because he plays in an org that “can’t develop anyone.” Squint and think “he could hit 15 home runs,” and then that becomes your mental baseline for how to value Madrigal.

If I’m trying to be accurate with this stuff, I have to admit this basic premise: My initial guess will not be accurate.

But the good part is that there are tools you can use to give you the context. It’s like trying to get a picture level. You don’t have to squint at it and bump it up or down a little bit. You use a level, which is calibrated to be more precise than your eyes. At Baseball Farm, we have a bunch of tools, including a Fantasy FV calculator which can help you evaluate any profile, even one as strange as Nick Madrigal’s. Read the rest of this entry »

