Archive for Player Analysis

Linearization and Fantasy Baseball

Among the astounding phenomena abundant throughout calculus, linearization remains one of the least glamorous. It’s incredibly simple, taught in less than a day, and a more precise (and more complicated) method can often be substituted for it. On the other hand, it’s an incredibly powerful tool and one with weighty implications for fantasy baseball. Because of the concept’s relative simplicity, a reader with even the most basic inkling of what calculus actually is should be able to understand the idea of it, so don’t let a fear of mathematics deter you.

First, let’s think about graphs, functions, and derivatives. Put simply, continuous functions, whether they’re linear, quadratic, or exponential, will generally experience some rate of change — slope. Think of it as the change in the y direction per unit change in the x direction between two points. This is considered a secant line, or the average rate of change between two points. More interesting, however, is the concept of the tangent line, or the instantaneous rate of change at a given point. Note that the tangent line only touches the function at one point rather than two, meaning that we can easily evaluate and analyze the rate of change when comparing two points on a curve. Importantly, the magnitude of the slope of the tangent line tells us the rate by which the function is increasing or decreasing. So the greater the slope, the faster it is increasing (perhaps indicating an exponential function), and the lesser the slope, the more it is decreasing (a negative quadratic).

In calculus, the formula for linearization is:

L(x) = f(a) – f'(a)(x – a)

Here, given some value of a, we get a y-value, or f(a). From there, we subtract the product of the derivative of f(a) and the difference between the value we are estimating, x, and the value we already have, a. This gives the linear approximation and we get a pretty good estimate.

When rendered down to its most basic essence, linearization is a glorified form of estimation that gives credence to gut instinct through a formula. Using the tangent line at a certain point, one can make very incremental estimations, but it’s important to note that they must be very small. The farther from the initial point a that one travels to find an approximation of y, the less accurate the result will be.

It seems that this would have little application to baseball, but that’s incorrect. Recently, I started toying with a couple of formulas that could actually have some importance in the realm of amateur fantasy baseball with the usage of a regression line for an entire player’s career in pretty much any statistic.

L(x) = f(k) – f'(a)(x – a)

Here, f(k) is the actual value at the known point (k), f'(a) is the derivative of the predicted point on the regression line, x is the point for which we are predicting the value, and a is the value we start from.

L(x) = f(a) – f'(a)(x – a)

Differing here, f(a) is the predicted value at the regression line, f'(a) is the derivative of the predicted point on the regression line, x is the point for which we are predicting the value, and a is the value we start from.

I don’t know which would work best, but my guess is that first formula would be most accurate due to its mix of actual and predicted values. Neither of them would be terribly precise, but it’s a heck of a lot better than relying on what you feel might be best.

Regardless of which formula you might prefer, the implications of the linearization idea as applied to fantasy baseball are apparent. Probably best used for 10-day predictions, linearization mixes short-term performance with long-term talent to assess how well a player might perform for a short period of time — whether he’s likely to continue streaking, slumping, or somewhere in between. Rather than having to rely on gut instinct or dated and/or biased statistical analysis, a fantasy player could rely on some concrete math to make short-term decisions. This would be especially helpful in leagues that play for only a month, or can only alter their rosters once a week, or even at the end of a highly competitive season (perhaps making the risky move of dropping a slumping MVP for the streaking rookie).

It’s understandable if it’s unclear how to use one of the formulas at this point. To simplify matters, let’s use formula 1 to demonstrate how this might work in regard to something as simple as batting average. So what you might have is a regression line for a player of rolling 10-game predicted batting averages plotted along with actual values. In this case, x-values are 10-game rolling averages by each 0.01 (the intervals are arbitrary). So 1.1 is the x-value at 110 games played, while 1.2 is the x-value at 120 games. Let’s just say for simplicity that the player has played 110 games in his career, had an actual average of .264 during the last 10-game stretch, and the derivative of the regression line at this point is 0.12. We want to guess his average for the next 10 games, up to career game number 120.

L(1.2) = .264 – (0.12)(1.2 – 1.1)

L(1.2) = .254

We’d expect him to hit .254 over the next 10 games. Hopefully that makes some sense. Obviously it’s still in development and I haven’t done a whole lot of research yet, but expect some to come out later along with some clarifying material if necessary. Confusion is to be expected, but with some explanation applied linearization could potentially help a lot of people out next season in fantasy.


The Giants Don’t Need an Overhaul, But an Upgrade

The Giants started off their 2016 campaign with a 57-33 record before the All-star break, before finishing 87-75. There were plenty of downfalls in the second half of the season, but ultimately the bullpen led the Giants to their fate.

In the first half of the season the combined ERA of the bullpen was 2.27, with 26 saves and a K/9 of 9.7. This being said, they had 42 save opportunities, which means they blew a save 38% of the time. In the second half of the season they combined for a 2.85 ERA, with 17 saves and a K/9 of 8.4. They blew 13 saves in 30 opportunities during the second half, which means they blew a save 43% of the time.

The bullpen was heavily criticized in the second half of the season due to the team’s inability to replicate the same win rate they saw in the first half. However, the bullpen was only slightly better in the first half then it was in the second half.

To me, the Giants were in dire need of acquiring a threat in the bullpen before the trade deadline approached. They went after Will Smith, who came in to the Giants’ pen with a 2.12 ERA, 7.9 K/9 and three blown save opportunities. With the Giants he had an ERA of 2.94, a 12.8 K/9 and a blown save. He was not able to convert a save all season, and although he proved to be a nice piece in the bullpen in hold situations, he was not a guy who could come into the 9th inning and dominate the game.

In the postseason the Giants were 0/2 in save situations and, in their final game against the Cubs, their bullpen collapse was maybe the worst the league has ever seen in the playoffs. However, their rookie Ty Blach came in for 3.2 innings of relief during the postseason and did not allow an earned run. He looked promising at the end of the regular season and pitched well in high-pressure situations during October baseball. It was surprising to see him and Santiago Casilla sit out their final game, as they watched their bullpen drop four runs in the 9th. Furthermore, we saw Clayton Kershaw close the Dodgers’ final game against the Nationals to move on to the NLCS. It would have been interesting to see what kind of performance Madison Bumgarner could have shown the Cubs’ batters in that final inning.

Finally, with the veteran relievers of Javier Lopez, Sergio Romo and Casilla needing new contracts for the 2017 campaign, and the Giants in need of finding someone who can come into a 9th inning and pose a legitimate threat, it will be interesting to see what the team does in the offseason to improve their bullpen. Here are my top five predictions for the Giants’ next closer.


#1:  Kenley Jansen:

It is unlikely that Aroldis Chapman will be looking for a new home this offseason, as he looks comfortable in Chicago and will have a hard time finding a team with that amount of talent. Jansen, however, may flee from the aging Dodgers, especially if someone is willing to pay. The Giants will have a bit of salary space to work with and would benefit greatly from this signing.

#2: Mark Melancon:

Although Melancon is a few steps below the elite Jansen and Chapman, he showed he can work a 9th inning as well as anyone this season. He may be a bit more team-friendly as far as salary space, and that may be intriguing to the Giants who will be looking to add a heavy-hitting left fielder.

#3: Jonathan Papelbon:

Papelbon was replaced by Melancon for the Nationals’ closing position in the second half of the 2016 season. He had a great first half, and showed he is capable of being a dominant closer in the MLB. However, his fight with Bryce Harper in 2015 and his rough second half of the season may make him a risky candidate. This may lower his cost and if the Giants are unable to sign Jansen or Melancon, they would be smart to see what Papelbon could do for their bullpen.

#4: Derek Law:

Derek Law debuted in 2016 and had a pretty good campaign. With a 2.13 ERA in 55 innings of relief, he may have a shot at being the Giants’ closer. However, it would be unlikely for him to start the 2017 season off as the Giants’ closer, unless they are unable to sign someone to fill that duty this offseason. He is an unlikely candidate, but if he can improve from his 2016 season, there is no reason he would not be able to become a legitimate MLB closer.

#5 Aroldis Chapman:

Chapman will likely return to the Cubs, especially if they make it to the World Series this October. However, he has been on three teams in the past two years, and if the Giants are able to show him more money than the Cubs, they might be able to acquire the hard-throwing lefty. If they do, they might lose the power they need to fill left field but they would come into the 2017 season looking stronger than they did a season ago.


Dr. Hendricks and Mr. Gray

Randomness and circumstances are important driving forces in everything that happens in the world. Although they usually work hand in hand with our own actions and decisions, they have the ability to pick you up when you hit the jackpot at the casino, or throw you down when your car gets crushed by a falling tree (hopefully you’re comfortably sleeping in your bed when that happens).  They can also be the difference between a pitcher having an average season on the mound, and having an outstanding one. Such is the case with the seasons Jon Gray and Kyle Hendricks had this year.

I’m not going to make the argument that these two pitchers performed equally well this season, with the main differences being random chance and circumstances, because they didn’t. Hendricks was the better pitcher; it just wasn’t the 2.48-run difference their ERAs show. The similarities between the two performances can be summarized in basically two stats. If we take a look at xFIP and SIERA (two important ERA estimators available here at FanGraphs), Hendricks’ numbers of 3.59 and 3.70, respectively, are eerily similar to Gray’s 3.61 and 3.72. From there on, however, the numbers separate abruptly.

Much like Dr. Jekyll and Mr. Hyde represent the good and the bad within a person, Hendricks’ and Gray’s seasons represent two sides of the same coin. On the one hand, circumstantial factors and good fortune turned Hendricks’ very good performance into a historical season, while a different set of circumstances and some bad fortune turned Gray’s good performance into merely an average one. In this piece, we’ll take a look at the factors that influenced these diametrically opposed results.

I’ll start by saying that Kyle Hendricks had a remarkable and impressive season. He had an average strikeout rate (8.05 K/9), didn’t walk many batters (2.08 BB/9), and allowed very few longballs (0.71 HR/9), which resulted in a really good 3.20 FIP, which ranked 4th in the majors. His ERA, however, ended up all the way down to 2.13; a whopping 1.07 runs less than his FIP. Despite being a big difference, it’s not all that uncommon, as nearly 2% of individual seasons by starters in the history of the game have had an E-F (ERA minus FIP) of -1.07 or lower. Nonetheless, that difference is hardly sustainable through multiple seasons. In major-league history, out of 2259 pitchers with at least 500 innings pitched, only two had a career E-F below -1.00, and both of them were full-time relievers (in case you’re curious, they are Alan Mills and Al Levine).

On the other side of the spectrum, Jon Gray also had a very solid season. He had an outstanding 9.91 strikeouts per 9 innings (that ranked him 9th among qualifying starters), an average walk rate of 3.16 BB/9, and a solid home-run rate (0.94 HR/9), lower than league average despite pitching half of his innings at Coors Field. His performance was good enough for a 3.60 FIP, but his actual ERA rocketed to 4.61. This 1.01 positive difference is just as unusual as Hendricks’ negative one, as about 2% of individual seasons throughout history have resulted in differences of 1.01 or higher. For visualizing purposes, here’s a table summarizing both pitchers’ numbers.

Picture

So the question still remains: what were the determining factors in these two pitchers having such a massive difference in results? Let’s dive right into it.

First of all, I decided to look at the correlation factors between E-F and a wide array of pitching stats, using data from every pitcher in MLB history with 500+ innings. As a general rule of thumb, a correlation factor between 0.40 and 0.69 indicates a strong relationship between the two variables. The following table shows the stats that had at least a 0.40 correlation factor with E-F:

Picture

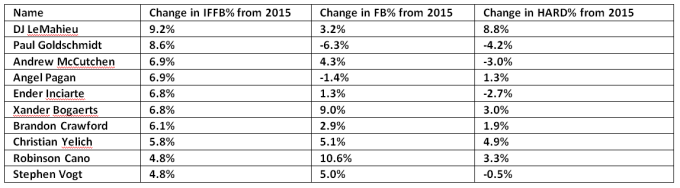
Welp, that’s a pretty lame table. Keep in mind, I analyzed correlations for stats as varied as pitch-type percentages, pitch-type vertical and horizontal movements, and Soft, Medium, and Hard-hit rates, as well as K, BB, and HR per 9, or HR/FB%. None of those had even a moderate relationship with E-F. So let’s stick with the stats presented on the table.

The first two stats are really no surprise. FIP basically assumes league-average BABIP and LOB% to estimate what a pitcher’s ERA should look like. So, if a pitcher has a high BABIP, FIP is going to estimate a lower ERA than the actual one, resulting in a higher E-F; thus the positive correlation. On the other hand, if a pitcher has a higher LOB%, he’ll allow fewer runs than his FIP would suggest, resulting in a lower E-F. This explains the negative correlation shown in the table. The last stat, however, came as a real surprise, at least for me. ERA seems to be positively correlated with E-F, which means that pitchers with higher ERA tend to have higher E-F than pitchers with lower ERA.

The next logical step would be to determine which factors, if any, explain BABIP and/or LOB% among pitchers. Using the same pitching stats than in the previous step, I ran correlations with BABIP and LOB% separately. The following table shows the stats that had a strong (0.40 to 0.69) or moderate (0.30 to 0.39) relationship.

Picture

As was the case in the first table, both of these stats are correlated strongly with E-F, showing factors of 0.58 and -0.42, respectively. It doesn’t come as a shock either, that they are strongly correlated with each other. The negative correlating factor (-0.42) indicates, as you would expect, that a high BABIP leads to a low LOB%, and vice versa. On the BABIP side, a positive strong relationship with ERA is almost too obvious, as more balls in play falling for hits leads to more runs being scored. Also, since fly balls in play (not counting home runs) turn more often into outs than ground balls do, it makes sense that BABIP holds a negative relationship with the former, and a positive one with the latter. This fact, however, goes against a somewhat popular belief that ground-ball pitchers tend to have lower BABIPs.

The factors that correlate to LOB% are more interesting. The first one is not unexpected: a higher strikeout rate seems to lead to more runners getting stranded, and that’s a pretty easy concept to wrap your head around. The second one, however, is really mind-boggling, and I really can’t say I can find a reasonable explanation for it. It indicates that the higher the home-run rate allowed by a pitcher, the more runners are going to be left on base. It is quite possible that this is just a spurious correlation, having no causality at all. Finally, the last factor listed on the table is very interesting and useful in this particular case. It suggests that high percentages of soft contact lead to higher LOB%. We’ll get to that later on in this article.

So let’s go back to our pitchers and check if any of this makes sense. We know that E-F is mainly affected by BABIP and LOB%. Hendricks and Gray had very different numbers in these two stats. The Cubs’ righty had a .250 BABIP and a LOB% of 81.5, while the Rockies’ fireballer had .308 and 66.4%. Considering that the league averages were .298 and 72.9%, respectively, we can say that Hendricks did considerably better than average, while Gray did just the opposite. So far so good, right? These facts go a long way towards explaining the differing outcomes. However, BABIP and LOB% aren’t exactly pitcher-dependent; in fact, they’re the marquee stats for the generic term “luck.”

Looking at the stats from the second table, few of them help out in figuring this out. High strikeout rates, for example, are supposed to increase LOB%, but Gray still managed a really low 66.4% despite a 9.91 K/9. On the other hand, Hendricks’ 81.5% LOB ranked 5th among qualified starters, even though his strikeout rate of 8.05 was right around league average. Similarly, groundball percentage is shown to have a positive correlation with BABIP. Nonetheless, Hendricks’ higher-than-average rate of 48.4% (league average was 44.7%) resulted in a ridiculously low BABIP of .250, while Gray’s below-average rate of 43.5% came with a .308 BABIP. Almost the same thing happens when you look at the fly-ball rates.

The only factor from that second table that does make sense in these particular examples is soft-contact rate. Hendricks ranked 1st in this regard among qualified starters, with an impressive 25.1% (league average was 18.8%), while Gray had a below-average rate of 17.8%, which ranked him 50th out of 73 qualified starters. This stat is very much pitcher-dependent, and it does help explain some of the differences in LOB%. It has, however, a moderate relationship with LOB%, as evidenced by its factor of -0.37. Is that enough to account for the massive difference in the results? Intuitively, I’ll say no. There is one more factor, however, that we haven’t even discussed yet.

FIP stands for Fielding Independent Pitching, so the very thing that FIP is trying to subtract from the equation might hold the key to answering our question. Defensive performances can heavily influence the outcome of the game, and make up a big chunk of what we generally call “luck” in a pitcher’s final results. In order to have a numerical confirmation of this idea, I looked at the correlations between teams’ yearly defensive component of WAR and its staff’s BABIP, LOB%, and E-F. The data I used for this exercise was every individual team season from 1989 (the first year in which play-by-play data contained information on hits and outs location) to 2016.

Picture

We can see here that a team’s defense has a strong correlation with all three of the stats, especially E-F. Higher values of the defensive component of WAR lead to lower BABIP, higher LOB%, and lower E-F, just as you would expect.

Saying that the Cubs had a great defensive performance this year is an understatement. Not only was it the best defense in 2016 by a bunch — it was also the best defense of the last 17 years, according to FanGraphs’ defensive component of WAR. Of the 814 individual team seasons played in MLB since 1989, this year’s Cubs rank 8th. That’ll put a serious dent on opponents’ BABIP. In fact, the Cubs’ average on balls in play of .255 (yes, that is the whole pitching staff’s BABIP) is the absolute lowest since the ’82 Padres. Oh, and also the Cubs pitching staff’s LOB% of 77.5% is tied for 2nd highest since 1989. All of this adds up to a team E-F of -0.62. Wow. Just wow.

The Rockies defense, on the other hand, wasn’t bad, but it also wasn’t great. According to FanGraphs, it was 17.9 runs above average, which ranked 12th in MLB. Again, that’s really not bad at all, just miles away from the 115.5 runs above average the Cubs had. The Rockies’ staff as a whole had a .317 BABIP, and a 68.0% LOB%; not unexpected from a team that plays half their games at altitude. Still, both of these values are worse than league average, resulting in a team E-F of 0.54.

All in all, Kyle Hendricks still had a better season than Jon Gray, and people will remember the 2.13 ERA and not the 4.61. This analysis just puts it a little bit more in perspective, and helps shed some light on the little details that make big differences in the course of a long season.

The old football adage says that “defense wins championships.” That doesn’t really apply to baseball, but in the future, when I think back to the 2016 Cubs, I’ll definitely think about their defense.


Clustering Pitchers With PITCHf/x

At any point, feel free to scroll down to the bottom to see some of the tables of pitcher clusters.

Clustering Pitches

Clustering individual pitches using data from PITCHf/x is a fairly simple task. All you need to do is pick out the important attributes that you believe define a pitch (velocity, movement, etc.) and use a clustering algorithm, such as K-Means clustering.

With K-Means clustering, you decide what K (the number of clusters) should be. For my analysis, I chose K to be 500 (rather arbitrarily). Different pitch clusters can represent the same type of pitch (i.e. fastball) but with varying attributes. For example, clusters 50 and 100 might both correspond to fastballs, but cluster 50 might be a typical Chris Young fastball whereas cluster 100 might be a typical Aroldis Chapman fastball.

One important point to remember is that you, the analyst, must decide what the clusters represent. By looking at attributes of the pitches in a given cluster, you might identity the cluster as “lefty changeups” or “submariner fastballs” (which is actually a category you will discover).

The Problem of Clustering Pitchers

We can identify every pitch that a pitcher throws as belonging to a cluster from 1 to 500. Therefore, we know the distribution of pitch clusters for a given pitcher. The difficult problem, however, is how do we compare two pitchers using this information? Let’s say we have two pitchers:

  • Pitcher A’s pitches are 50% from cluster 1 and 50% from cluster 200.
  • Pitcher B’s pitches are 33% from cluster 1, 33% from cluster 300, and 33% from cluster 139.

The question remains, are Pitcher A and Pitcher B similar pitchers?

The problem of clustering pitchers is a more complicated one than clustering pitches because we now have a collection of pitches instead of just individual pitches to compare. In order to cluster pitchers, I use a model that is typically used for topic modeling called Latent Dirichlet Allocation (LDA).

An Aside on LDA

In LDA for topic modeling, our data is a collection of documents.

Let’s imagine that our collection of documents is articles from the New York Times. There are global topics that govern how these articles are generated. For example, if you think of a newspaper, the topics might be sports, finance, health, politics, etc. Additionally, each article can be a mixture of these topics. We might imagine there is an article in the sports section titled, “Yankees payroll exceeds $300 million”, which our algorithm may discover is 50% about sports and 50% about finance.

Similar to what is mentioned above, the analyst must figure out what the topics actually are. You do not tell the algorithm that there is a sports topic. You discover that the topic is sports by observing that the most probable words are “baseball”, “Jeter”, “LeBron”, “touchdown”, etc. The algorithm will tell you that a particular document is 50% about topic 1 and 50% about topic 20, but you must ultimately infer what topics 1 and topics 20 are.

I am harping on this point mainly just to mention that there is no magic to these clustering algorithms. An algorithm can cluster data, but it cannot tell you what these clusters mean.

Relevance of LDA to Pitchers

Anyway, how can this model be used to analyze pitchers? We just need to use our imagination. Instead of a collection of documents, we now have a collection of pitcher seasons. Whereas each document is made up of a collection of words, each pitcher season is made up of a collection of pitches. We have already discretized each pitch using K-Means clustering in order to create our own “dictionary” of pitches. In our baseball model, we imagine that each pitcher is a mixture of repertoires, whereas in topic modeling, each document was a mixture of topics. We can then cluster pitchers together by figuring out who has the most similar repertoires.

Nitty Gritty Details

If you are not interested in getting into the nitty gritty details, feel free to skip ahead to the next section to just see the cluster groupings.

  • Data used is from 2007-2014.
  • The dictionary of pitches (500 clusters) was created by running K-Means using all of the pitches from 2014. The choice of 2014 is arbitrary, but I used just one year’s worth of data because I thought it might be a sufficient amount and it was much quicker to run K-Means.
  • The PITCHf/x attributes that were used to cluster pitches were start_speed, pfx_x/pfx_z (horizontal/vertical movement), px/pz (horizontal/vertical location), vx0/vz0 (components of velocity).
  • For each pitcher from 2007-2014, each pitch was assigned to its closest cluster (determined by distance to the cluster center). I filtered out pitcher seasons in which the pitcher threw fewer than 500 pitches.
  • I then ran LDA on pitcher seasons, choosing the number of repertoires (topics) to be 5.
  • I used the method from this paper to get a vector representation of each pitcher season. I could have used the inferred repertoire proportions as my vector representations, but for various reasons, this did not produce as nice of clusters.
  • Finally, I ran K-Means (K=100) on these vectors to get clusters of pitchers.
  • Whereas in topic modeling, it is often interesting to interpret what the global topics actually are, I am not really interested in what the global “repertoires” are for the model. I am really using LDA as a dimensionality reduction technique to produce smaller vectors (5 vs. 500) that can be clustered together.

Some Observations

The actual clusters along with some relevant FanGraphs statistics are provided below. Each table is sortable. For brevity, I have only included clusters in which there are 10 or fewer pitchers. Only the first cluster shown (cluster 3) has more than 10 pitchers, which I simply included to demonstrate that a cluster could be quite big.

  • As is probably expected, clusters are almost always entirely righties or lefties even though this is not an input to the model.
  • Guys with similar numbers of batters faced cluster together. This is by design, as the way I determined the repertoire proportions accounts for the number of times a particular pitch is thrown.
  • Sometimes weird clusters can form, such as Cluster 37, which contains both Chapman and Wakefield. Cluster 37 is mostly cohesive with hard-throwing left-handers and I believe Wakefield ends up here simply because he did not fit well into any cluster.
  • This is not to say that the algorithm cannot find clusters of knuckleballers. Cluster 14 is all R.A. Dickey from years 2011-2014.
  • There are also other clusters that contain exclusively one (or almost one) pitcher. Cluster 8 is 5 Kershaw years and one Hamels year. Cluster 68 is 5 Verlander years. I believe these clusters form partially because their stuff is so good. There are other pitchers who fall into almost exclusively one cluster but who are joined by many other pitchers. Another factor is that they might be able to repeat their mechanics so well that they remain in the same cluster because they are always throwing the same pitch types.
  • Clusters of individual pitchers also happens if a pitcher has an incredibly unique style. Justin Masterson has his own cluster because he is such an extreme ground-ball pitcher. Josh Collmenter does as well due to the extreme rise he generates on his “fastball”.
  • Cluster 29 contains just Kershaw’s 2014 season and J.A. Happ’s 2009 season. If you do a Ctrl-F for J.A. Happ, he finds himself in some pretty flattering clusters. This is especially interesting because from 2007-2014, he does not have particularly good seasons, but he has been quite good the last two years. This is not to suggest that these clusters can uncover hidden gems, but it’s not fully out of the realm of possibility.
  • Most clusters produce quite similar ground-ball percentages. One of the factors that goes into clustering pitches (and therefore pitchers) is horizontal and vertical movement, which play a huge factor in a pitcher’s ability to produce ground-balls.
  • Submarine pitchers always end up together. Check out Clusters 9, 60, and 92.

Overall, I think this is pretty interesting stuff. I was honestly surprised that the clusters turned out to be as cohesive as they were. Additionally, besides being a descriptive tool, I have to wonder whether this information can be used for predictive purposes. For example, we often talk about regression to the mean when discussing a player’s performance, whether it be a pitcher of a batter. It is possible that the appropriate mean for many pitchers is the cluster mean that they happen to fall into.

Cluster 3


year Name Team TBF K9 BB9 HR9 GB_pct FB_pct HR_FB WAR
2009 Chris Carpenter Cardinals 750 6.73 1.78 0.33 55.0 28.0 4.6 5.5
2010 Hiroki Kuroda Dodgers 810 7.29 2.20 0.69 51.1 32.1 8.0 4.3
2010 Gavin Floyd White Sox 798 7.25 2.79 0.67 49.9 32.1 7.6 4.1
2008 Hiroki Kuroda Dodgers 776 5.69 2.06 0.64 51.3 28.6 7.6 3.6
2012 Doug Fister Tigers 673 7.63 2.06 0.84 51.0 26.7 11.6 3.4
2011 Josh Beckett Red Sox 767 8.16 2.42 0.98 40.1 42.2 9.6 3.3
2011 Michael Pineda Mariners 696 9.11 2.89 0.95 36.3 44.8 9.0 3.2
2012 A.J. Burnett Pirates 851 8.01 2.76 0.80 56.9 24.3 12.7 3.0
2013 Rick Porcello Tigers 736 7.22 2.14 0.92 55.3 23.7 14.1 2.9
2008 Carlos Zambrano Cubs 796 6.20 3.43 0.86 47.2 34.9 9.0 2.8
2013 Andrew Cashner Padres 707 6.58 2.42 0.62 52.5 28.7 8.1 2.7
2012 Jeff Samardzija Cubs 723 9.27 2.89 1.03 44.6 33.1 12.8 2.7
2010 Scott Baker Twins 725 7.82 2.27 1.22 35.6 43.5 10.2 2.6
2014 Kyle Gibson Twins 757 5.37 2.86 0.60 54.4 26.6 7.8 2.3
2012 Tim Hudson Braves 749 5.13 2.41 0.60 55.5 25.2 8.3 2.1
2014 Henderson Alvarez Marlins 772 5.34 1.59 0.67 53.8 24.3 9.5 2.1
2008 Todd Wellemeyer Cardinals 807 6.29 2.91 1.17 39.3 39.8 10.6 2.0
2010 Rick Porcello Tigers 700 4.65 2.10 1.00 50.3 32.1 9.9 1.7
2011 Luke Hochevar Royals 835 5.82 2.82 1.05 49.8 32.2 11.5 1.7
2008 Jason Marquis Cubs 738 4.90 3.77 0.81 47.6 32.5 8.3 1.7
2014 Charlie Morton Pirates 666 7.21 3.26 0.51 55.7 22.8 8.8 1.6
2012 Luis Mendoza Royals 709 5.64 3.20 0.81 52.1 27.1 10.6 1.5
2009 Aaron Cook Rockies 675 4.44 2.68 1.08 56.5 24.7 14.2 1.4
2014 Doug Fister Nationals 662 5.38 1.32 0.99 48.9 34.2 10.1 1.4
2010 Mitch Talbot Indians 696 4.97 3.90 0.73 47.8 35.3 7.0 1.2
2008 Armando Galarraga Tigers 746 6.35 3.07 1.41 43.5 39.7 13.0 1.2
2008 Carlos Silva Mariners 689 4.05 1.88 1.17 44.0 33.3 10.4 1.2
2009 Ross Ohlendorf Pirates 725 5.55 2.70 1.27 40.6 42.1 11.1 1.2
2008 Vicente Padilla Rangers 757 6.68 3.42 1.37 42.7 38.1 12.5 1.1
2012 Luke Hochevar Royals 800 6.99 2.96 1.31 43.3 35.0 13.5 1.1
2012 Derek Lowe – – – 640 3.47 3.22 0.63 59.2 21.0 9.1 1.0
2013 Edinson Volquez – – – 777 7.50 4.07 1.00 47.6 29.6 11.9 0.9
2011 Chris Volstad Marlins 719 6.36 2.66 1.25 52.3 27.7 15.5 0.7
2010 Jeremy Bonderman Tigers 754 5.89 3.16 1.32 44.7 39.2 11.4 0.7
2010 Brad Bergesen Orioles 746 4.29 2.70 1.38 48.7 36.6 11.9 0.6
2014 Hector Noesi – – – 733 6.42 2.92 1.46 38.0 40.6 12.7 0.3
2009 Armando Galarraga Tigers 642 5.95 4.20 1.50 39.9 38.6 13.3 0.2
2008 Kyle Kendrick Phillies 722 3.93 3.30 1.33 44.3 28.7 14.0 0.1
2014 Roberto Hernandez – – – 722 5.74 3.99 1.04 49.7 29.9 12.2 0.0
2013 Lucas Harrell Astros 707 5.21 5.15 1.17 51.5 27.4 14.3 -0.8


Cluster 5


year Name Team TBF K9 BB9 HR9 GB_pct FB_pct HR_FB WAR
2010 Cliff Lee – – – 843 7.84 0.76 0.68 41.9 40.4 6.3 7.0
2011 Cliff Lee Phillies 920 9.21 1.62 0.70 46.3 32.4 9.0 6.8
2009 Jon Lester Red Sox 843 9.96 2.83 0.89 47.7 34.5 10.6 5.3
2014 Jose Quintana White Sox 830 8.00 2.34 0.45 44.7 33.2 5.1 5.1
2013 Derek Holland Rangers 894 7.99 2.70 0.85 40.8 36.4 8.8 4.3
2012 Matt Moore Rays 759 8.88 4.11 0.91 37.4 42.9 8.6 2.7
2013 Wade Miley Diamondbacks 847 6.53 2.93 0.93 52.0 27.2 12.5 1.8


Cluster 6


year Name Team TBF K9 BB9 HR9 GB_pct FB_pct HR_FB WAR
2007 CC Sabathia Indians 975 7.80 1.38 0.75 45.0 36.6 7.8 6.4
2014 Jake McGee Rays 274 11.36 2.02 0.25 38.0 42.9 2.9 2.6
2014 Tyler Matzek Rockies 503 6.96 3.37 0.69 49.7 30.3 8.3 1.7
2013 J.A. Happ Blue Jays 415 7.48 4.37 0.97 36.5 46.0 7.6 1.1
2010 J.A. Happ – – – 374 7.21 4.84 0.82 39.0 43.4 7.4 1.0
2009 Sean West Marlins 467 6.10 3.83 0.96 40.2 40.8 8.0 1.0
2009 Andrew Miller Marlins 366 6.64 4.84 0.79 48.0 30.0 9.3 0.7
2012 Drew Pomeranz Rockies 434 7.73 4.28 1.30 43.9 35.9 13.6 0.7
2013 Jake McGee Rays 260 10.77 3.16 1.15 42.5 38.8 12.9 0.6
2008 Jo-Jo Reyes Braves 512 6.21 4.14 1.43 48.5 31.8 15.5 0.2


Cluster 8


year Name Team TBF K9 BB9 HR9 GB_pct FB_pct HR_FB WAR
2013 Clayton Kershaw Dodgers 908 8.85 1.98 0.42 46.0 31.3 5.8 7.1
2011 Clayton Kershaw Dodgers 912 9.57 2.08 0.58 43.2 38.6 6.7 7.1
2012 Clayton Kershaw Dodgers 901 9.05 2.49 0.63 46.9 34.0 8.1 5.9
2010 Clayton Kershaw Dodgers 848 9.34 3.57 0.57 40.1 42.1 5.8 4.7
2009 Clayton Kershaw Dodgers 701 9.74 4.79 0.37 39.4 41.6 4.1 4.4
2010 Cole Hamels Phillies 856 9.10 2.63 1.12 45.4 37.9 12.3 3.5


Cluster 9


year Name Team TBF K9 BB9 HR9 GB_pct FB_pct HR_FB WAR
2009 Peter Moylan Braves 309 7.52 4.32 0.00 62.4 19.5 0.0 1.4
2014 Joe Smith Angels 285 8.20 1.81 0.48 59.1 25.9 8.0 1.0
2011 Joe Smith Indians 267 6.04 2.82 0.13 56.6 23.5 2.2 1.0
2009 Brad Ziegler Athletics 313 6.63 3.44 0.25 62.3 19.7 4.4 1.0
2013 Brad Ziegler Diamondbacks 297 5.42 2.71 0.37 70.4 10.8 12.5 0.6
2012 Brad Ziegler Diamondbacks 263 5.50 2.75 0.26 75.5 7.7 13.3 0.6
2012 Joe Smith Indians 278 7.12 3.36 0.54 58.0 24.9 8.3 0.6
2008 Cla Meredith Padres 302 6.27 3.07 0.77 66.8 17.3 15.8 0.3
2010 Peter Moylan Braves 271 7.35 5.23 0.71 67.8 21.3 13.5 -0.3


Cluster 14


year Name Team TBF K9 BB9 HR9 GB_pct FB_pct HR_FB WAR
2012 R.A. Dickey Mets 927 8.86 2.08 0.92 46.1 34.1 11.3 5.0
2011 R.A. Dickey Mets 876 5.78 2.33 0.78 50.8 32.9 8.3 2.5
2014 R.A. Dickey Blue Jays 914 7.22 3.09 1.09 42.0 37.6 10.7 1.7
2013 R.A. Dickey Blue Jays 943 7.09 2.84 1.40 40.3 40.5 12.7 1.7


Cluster 16


year Name Team TBF K9 BB9 HR9 GB_pct FB_pct HR_FB WAR
2013 Max Scherzer Tigers 836 10.08 2.35 0.76 36.3 44.6 7.6 6.1
2014 Max Scherzer Tigers 904 10.29 2.57 0.74 36.7 41.6 7.5 5.2
2011 Daniel Hudson Diamondbacks 921 6.85 2.03 0.69 41.7 39.1 6.4 4.6
2012 Max Scherzer Tigers 787 11.08 2.88 1.10 36.5 41.5 11.6 4.4
2014 Jeff Samardzija – – – 879 8.28 1.76 0.82 50.2 30.5 10.6 4.1
2014 Lance Lynn Cardinals 866 8.00 3.18 0.57 44.3 36.0 6.1 3.4


Cluster 18


year Name Team TBF K9 BB9 HR9 GB_pct FB_pct HR_FB WAR
2008 Brandon Webb Diamondbacks 944 7.27 2.58 0.52 64.4 20.4 9.6 5.5
2013 Justin Masterson Indians 803 9.09 3.54 0.61 58.0 24.2 10.7 3.5
2012 Justin Masterson Indians 906 6.94 3.84 0.79 55.7 25.0 11.4 2.3
2011 Derek Lowe Braves 830 6.59 3.37 0.67 59.0 22.5 10.2 2.1


Cluster 20


year Name Team TBF K9 BB9 HR9 GB_pct FB_pct HR_FB WAR
2010 John Danks White Sox 878 6.85 2.96 0.76 45.4 38.9 7.4 4.4
2010 Brian Matusz Orioles 760 7.33 3.23 0.97 36.2 45.0 7.9 3.0
2009 John Danks White Sox 839 6.69 3.28 1.26 44.2 40.9 11.5 2.7
2013 Felix Doubront Red Sox 705 7.71 3.94 0.72 45.6 34.4 7.8 2.2
2014 J.A. Happ Blue Jays 673 7.58 2.91 1.25 40.6 39.5 11.5 1.0


Cluster 24


year Name Team TBF K9 BB9 HR9 GB_pct FB_pct HR_FB WAR
2008 CC Sabathia – – – 1023 8.93 2.10 0.68 46.6 31.7 8.8 7.3
2011 CC Sabathia Yankees 985 8.72 2.31 0.64 46.6 30.3 8.4 6.4
2010 David Price Rays 861 8.11 3.41 0.65 43.7 39.6 6.5 4.2


Cluster 29


year Name Team TBF K9 BB9 HR9 GB_pct FB_pct HR_FB WAR
2014 Clayton Kershaw Dodgers 749 10.85 1.41 0.41 51.8 29.2 6.6 7.6
2009 J.A. Happ Phillies 685 6.45 3.04 1.08 38.4 42.9 9.5 1.7


Cluster 35


year Name Team TBF K9 BB9 HR9 GB_pct FB_pct HR_FB WAR
2014 Chris Young Mariners 688 5.89 3.27 1.42 22.3 58.7 8.8 0.1
2014 Marco Estrada Brewers 624 7.59 2.63 1.73 32.7 49.5 13.2 -0.1


Cluster 36


year Name Team TBF K9 BB9 HR9 GB_pct FB_pct HR_FB WAR
2011 Justin Masterson Indians 908 6.58 2.71 0.46 55.1 26.7 6.3 4.2
2010 Justin Masterson Indians 802 7.00 3.65 0.70 59.9 24.9 10.0 2.3


Cluster 37


year Name Team TBF K9 BB9 HR9 GB_pct FB_pct HR_FB WAR
2012 Aroldis Chapman Reds 276 15.32 2.89 0.50 37.3 42.9 7.4 3.3
2009 Matt Thornton White Sox 291 10.82 2.49 0.62 46.4 36.3 7.7 2.3
2008 Matt Thornton White Sox 268 10.29 2.54 0.67 53.0 27.4 10.9 1.7
2012 Drew Smyly Tigers 416 8.52 2.99 1.09 39.9 41.3 10.3 1.7
2008 Clayton Kershaw Dodgers 470 8.36 4.35 0.92 48.0 31.3 11.6 1.5
2008 Tim Wakefield Red Sox 754 5.82 2.98 1.24 35.5 48.9 9.1 1.1
2011 Tim Wakefield Red Sox 677 5.41 2.73 1.45 38.4 45.8 10.5 0.2


Cluster 38


year Name Team TBF K9 BB9 HR9 GB_pct FB_pct HR_FB WAR
2013 Cliff Lee Phillies 876 8.97 1.29 0.89 44.3 33.3 10.9 5.5
2008 Johan Santana Mets 964 7.91 2.42 0.88 41.2 36.4 9.4 5.3
2010 Jon Lester Red Sox 861 9.74 3.59 0.61 53.6 29.6 8.9 4.8
2012 CC Sabathia Yankees 833 8.87 1.98 0.99 48.2 30.7 12.5 4.7
2008 Jon Lester Red Sox 874 6.50 2.82 0.60 47.5 31.6 7.0 4.1
2013 Hyun-Jin Ryu Dodgers 783 7.22 2.30 0.70 50.6 30.5 8.7 3.6
2014 Wei-Yin Chen Orioles 772 6.59 1.70 1.11 41.0 37.5 10.5 2.4
2010 Jonathan Sanchez Giants 812 9.54 4.47 0.98 41.5 43.7 9.8 2.3
2014 Wade Miley Diamondbacks 866 8.18 3.35 1.03 51.1 28.0 13.9 1.6


Cluster 44


year Name Team TBF K9 BB9 HR9 GB_pct FB_pct HR_FB WAR
2011 Cole Hamels Phillies 850 8.08 1.83 0.79 52.3 32.6 9.9 4.9
2008 Cole Hamels Phillies 914 7.76 2.10 1.11 39.5 38.7 11.2 4.8
2008 John Danks White Sox 804 7.34 2.63 0.69 42.8 35.4 7.4 4.8
2009 Cole Hamels Phillies 814 7.81 2.00 1.12 40.4 38.7 10.7 3.9
2014 Danny Duffy Royals 606 6.81 3.19 0.72 35.8 46.0 6.1 1.9
2011 J.A. Happ Astros 698 7.71 4.78 1.21 33.0 44.2 10.2 0.6


Cluster 46


year Name Team TBF K9 BB9 HR9 GB_pct FB_pct HR_FB WAR
2010 Roy Halladay Phillies 993 7.86 1.08 0.86 51.2 29.7 11.3 6.1
2013 Lance Lynn Cardinals 856 8.84 3.39 0.62 43.1 34.4 7.4 3.7
2008 Mike Pelfrey Mets 851 4.93 2.87 0.54 49.6 29.6 6.3 3.1
2009 A.J. Burnett Yankees 896 8.48 4.22 1.09 42.8 39.2 10.8 3.0
2010 Roberto Hernandez Indians 880 5.31 3.08 0.73 55.6 30.8 8.3 2.6
2009 Derek Lowe Braves 855 5.13 2.91 0.74 56.3 25.8 9.4 2.5
2010 Derek Lowe Braves 824 6.32 2.83 0.84 58.8 22.6 13.1 2.2


Cluster 49


year Name Team TBF K9 BB9 HR9 GB_pct FB_pct HR_FB WAR
2014 Aroldis Chapman Reds 202 17.67 4.00 0.17 43.5 34.8 4.2 2.8
2014 James Paxton Mariners 303 7.18 3.53 0.36 54.8 22.6 6.4 1.2
2013 Rex Brothers Rockies 281 10.16 4.81 0.67 48.8 32.5 9.3 0.9
2012 Antonio Bastardo Phillies 224 14.02 4.50 1.21 27.7 50.0 12.5 0.8
2012 Tim Collins Royals 295 12.01 4.39 1.03 40.9 42.8 11.8 0.7
2012 Christian Friedrich Rockies 377 7.87 3.19 1.49 42.2 34.6 15.4 0.7
2013 Justin Wilson Pirates 295 7.21 3.42 0.49 53.0 30.0 6.7 0.6
2011 Aroldis Chapman Reds 207 12.78 7.38 0.36 52.7 30.8 7.1 0.5
2014 Justin Wilson Pirates 256 9.15 4.50 0.60 51.3 34.4 7.3 0.2
2011 Mike Dunn Marlins 267 9.71 4.43 1.29 38.5 46.0 12.2 -0.2


Cluster 51


year Name Team TBF K9 BB9 HR9 GB_pct FB_pct HR_FB WAR
2009 Cliff Lee – – – 969 7.03 1.67 0.66 41.3 36.5 6.5 6.3
2009 CC Sabathia Yankees 938 7.71 2.62 0.70 42.9 37.3 7.4 5.9
2010 CC Sabathia Yankees 970 7.46 2.80 0.76 50.7 34.1 8.6 5.1


Cluster 54


year Name Team TBF K9 BB9 HR9 GB_pct FB_pct HR_FB WAR
2014 Hisashi Iwakuma Mariners 709 7.74 1.06 1.01 50.2 28.7 13.2 3.1
2009 Justin Masterson – – – 568 8.28 4.18 0.84 53.6 31.4 10.4 1.5
2014 Justin Masterson – – – 592 8.11 4.83 0.84 58.2 21.6 14.6 0.4


Cluster 58


year Name Team TBF K9 BB9 HR9 GB_pct FB_pct HR_FB WAR
2014 David Price – – – 1009 9.82 1.38 0.91 41.2 38.1 9.7 6.0
2014 Jon Lester – – – 885 9.01 1.97 0.66 42.4 37.0 7.2 5.6
2012 Gio Gonzalez Nationals 822 9.35 3.43 0.41 48.2 30.0 5.8 5.0
2011 David Price Rays 918 8.75 2.53 0.88 44.3 36.9 9.7 4.4
2013 Gio Gonzalez Nationals 819 8.83 3.50 0.78 43.9 33.3 9.7 3.2
2011 Gio Gonzalez Athletics 864 8.78 4.05 0.76 47.5 34.1 8.9 3.1
2010 Gio Gonzalez Athletics 851 7.67 4.13 0.67 49.3 35.3 7.4 3.1


Cluster 60


year Name Team TBF K9 BB9 HR9 GB_pct FB_pct HR_FB WAR
2011 Brad Ziegler – – – 239 6.79 2.93 0.00 68.6 13.4 0.0 1.0
2007 Cla Meredith Padres 342 6.67 1.92 0.68 72.0 13.6 17.1 1.0
2008 Brad Ziegler Athletics 229 4.53 3.32 0.30 64.7 18.8 6.3 0.5
2013 Joe Smith Indians 259 7.71 3.29 0.71 49.1 30.1 9.6 0.5
2008 Chad Bradford – – – 241 2.58 2.28 0.46 66.5 16.0 9.4 0.4
2012 Cody Eppley Yankees 194 6.26 3.33 0.59 60.3 19.1 11.1 0.3
2008 Joe Smith Mets 271 7.39 4.41 0.57 62.6 17.9 12.5 0.3
2009 Cla Meredith – – – 283 5.10 3.44 0.55 62.9 21.1 8.9 0.2
2010 Brad Ziegler Athletics 257 6.08 4.15 0.59 54.4 26.9 8.2 0.1
2014 Brad Ziegler Diamondbacks 281 7.25 3.22 0.67 63.8 18.9 13.5 0.1


Cluster 68


year Name Team TBF K9 BB9 HR9 GB_pct FB_pct HR_FB WAR
2009 Justin Verlander Tigers 982 10.09 2.36 0.75 36.0 42.8 7.4 7.7
2012 Justin Verlander Tigers 956 9.03 2.27 0.72 42.3 35.6 8.3 6.8
2011 Justin Verlander Tigers 969 8.96 2.04 0.86 40.2 42.1 8.8 6.4
2010 Justin Verlander Tigers 925 8.79 2.85 0.56 41.0 40.3 5.6 6.3
2013 Justin Verlander Tigers 925 8.95 3.09 0.78 38.4 38.9 7.8 4.9


Cluster 69


year Name Team TBF K9 BB9 HR9 GB_pct FB_pct HR_FB WAR
2008 Manny Parra Brewers 741 7.97 4.07 0.98 51.6 26.6 13.5 2.3
2014 Drew Smyly – – – 618 7.82 2.47 1.06 36.6 43.4 9.5 2.2
2012 J.A. Happ – – – 627 8.96 3.48 1.18 44.0 38.9 11.9 1.9


Cluster 70


year Name Team TBF K9 BB9 HR9 GB_pct FB_pct HR_FB WAR
2014 Gerrit Cole Pirates 571 9.00 2.61 0.72 49.2 31.8 9.4 2.3
2009 Luke Hochevar Royals 631 6.67 2.90 1.45 46.6 35.8 13.8 1.0
2012 Joe Kelly Cardinals 457 6.31 3.03 0.84 51.7 27.5 11.0 0.9
2008 Sidney Ponson – – – 612 3.85 3.18 0.93 54.5 26.2 10.9 0.9
2013 Joe Kelly Cardinals 532 5.73 3.19 0.73 51.1 28.2 8.9 0.7
2009 Roberto Hernandez Indians 596 5.67 5.03 1.15 55.2 27.0 13.7 0.0


Cluster 71


year Name Team TBF K9 BB9 HR9 GB_pct FB_pct HR_FB WAR
2008 Chris Young Padres 434 8.18 4.22 1.14 21.7 53.4 8.7 1.4
2012 Chris Young Mets 493 6.26 2.82 1.25 22.3 58.2 7.7 1.2
2013 Josh Collmenter Diamondbacks 384 8.32 3.23 0.78 32.7 46.8 6.9 1.0
2012 Josh Collmenter Diamondbacks 375 7.97 2.19 1.30 37.4 43.1 11.5 0.8
2009 Chris Young Padres 336 5.92 4.74 1.42 30.2 51.7 10.0 0.0


Cluster 72


year Name Team TBF K9 BB9 HR9 GB_pct FB_pct HR_FB WAR
2014 Madison Bumgarner Giants 873 9.07 1.78 0.87 44.4 35.8 10.0 4.0
2013 Jon Lester Red Sox 903 7.47 2.83 0.80 45.0 35.4 8.3 3.5


Cluster 77


year Name Team TBF K9 BB9 HR9 GB_pct FB_pct HR_FB WAR
2011 Josh Collmenter Diamondbacks 621 5.83 1.63 0.99 33.3 47.0 7.7 2.3
2014 Josh Collmenter Diamondbacks 719 5.77 1.96 0.90 38.8 39.9 8.3 1.9


Cluster 78


year Name Team TBF K9 BB9 HR9 GB_pct FB_pct HR_FB WAR
2007 Rich Hill Cubs 812 8.45 2.91 1.25 36.0 42.9 11.7 3.1
2014 Tyler Skaggs Angels 464 6.85 2.39 0.72 50.1 30.9 8.7 1.5
2011 Danny Duffy Royals 474 7.43 4.36 1.28 37.5 40.3 11.5 0.5
2010 Manny Parra Brewers 560 9.52 4.65 1.33 47.2 34.5 14.8 0.3


Cluster 79


year Name Team TBF K9 BB9 HR9 GB_pct FB_pct HR_FB WAR
2012 David Price Rays 836 8.74 2.52 0.68 53.1 27.0 10.5 5.0
2011 C.J. Wilson Rangers 915 8.30 2.98 0.64 49.3 31.9 8.2 4.9
2010 C.J. Wilson Rangers 850 7.50 4.10 0.44 49.2 33.5 5.3 4.1
2013 C.J. Wilson Angels 913 7.97 3.60 0.64 44.4 33.4 7.2 3.2
2012 Madison Bumgarner Giants 849 8.25 2.12 0.99 47.9 33.3 11.7 3.1
2011 Derek Holland Rangers 843 7.36 3.05 1.00 46.4 33.6 11.0 3.0
2012 Wandy Rodriguez – – – 875 6.08 2.45 0.92 48.0 31.6 10.1 2.5
2014 Jason Vargas Royals 790 6.16 1.97 0.91 38.3 38.7 8.2 2.2
2012 C.J. Wilson Angels 865 7.70 4.05 0.85 50.3 29.9 10.8 2.2


Cluster 85


year Name Team TBF K9 BB9 HR9 GB_pct FB_pct HR_FB WAR
2012 Cliff Lee Phillies 847 8.83 1.19 1.11 45.0 36.9 11.8 5.0
2014 Cole Hamels Phillies 829 8.71 2.59 0.62 46.4 31.1 8.2 4.3
2009 Wandy Rodriguez Astros 849 8.45 2.76 0.92 44.9 37.1 9.9 4.1
2012 Wade Miley Diamondbacks 807 6.66 1.71 0.65 43.3 33.7 6.9 4.1
2013 Jose Quintana White Sox 832 7.38 2.52 1.03 42.5 37.4 10.2 3.5
2009 Andy Pettitte Yankees 834 6.84 3.51 0.92 42.9 37.8 8.9 3.4
2012 Wei-Yin Chen Orioles 818 7.19 2.66 1.35 37.1 42.1 11.7 2.3


Cluster 86


year Name Team TBF K9 BB9 HR9 GB_pct FB_pct HR_FB WAR
2009 Josh Beckett Red Sox 883 8.43 2.33 1.06 47.2 31.7 12.8 4.2
2010 Max Scherzer Tigers 800 8.46 3.22 0.92 40.3 40.0 9.6 3.7
2014 Nathan Eovaldi Marlins 854 6.40 1.94 0.63 44.8 32.9 6.6 2.9
2012 Lucas Harrell Astros 827 6.51 3.62 0.60 57.2 22.5 9.7 2.8
2013 Jeff Samardzija Cubs 914 9.01 3.29 1.05 48.2 31.4 13.3 2.7
2011 Max Scherzer Tigers 833 8.03 2.58 1.34 40.3 39.5 12.6 2.2
2009 Mike Pelfrey Mets 824 5.22 3.22 0.88 51.3 30.0 9.5 1.7
2011 Roberto Hernandez Indians 833 5.20 2.86 1.05 54.8 26.6 13.0 0.9


Cluster 92


year Name Team TBF K9 BB9 HR9 GB_pct FB_pct HR_FB WAR
2014 Steve Cishek Marlins 275 11.57 2.89 0.41 42.7 31.1 5.9 2.0
2007 Sean Green Mariners 304 7.01 4.50 0.26 60.9 18.8 5.1 0.7
2008 Sean Green Mariners 358 7.06 4.10 0.34 63.3 19.5 6.1 0.7
2011 Shawn Camp Blue Jays 292 4.34 2.98 0.41 53.5 25.7 5.2 0.3
2010 Shawn Camp Blue Jays 298 5.72 2.24 1.00 52.0 31.4 11.1 0.2


Cluster 95


year Name Team TBF K9 BB9 HR9 GB_pct FB_pct HR_FB WAR
2008 Cliff Lee Indians 891 6.85 1.37 0.48 45.9 35.1 5.1 6.7
2012 Cole Hamels Phillies 867 9.03 2.17 1.00 43.4 35.1 11.9 4.6
2013 Cole Hamels Phillies 905 8.26 2.05 0.86 42.7 36.7 9.1 4.5
2008 Scott Kazmir Rays 641 9.81 4.14 1.36 30.8 48.9 12.0 2.0


Cluster 97


year Name Team TBF K9 BB9 HR9 GB_pct FB_pct HR_FB WAR
2011 Jered Weaver Angels 926 7.56 2.14 0.76 32.5 48.6 6.3 5.7
2009 Jered Weaver Angels 882 7.42 2.82 1.11 30.9 50.4 8.3 3.9
2014 Chris Tillman Orioles 871 6.51 2.86 0.91 40.6 39.3 8.3 2.3
2009 Joe Blanton Phillies 837 7.51 2.72 1.38 40.6 39.5 12.9 2.2
2013 Chris Tillman Orioles 845 7.81 2.97 1.44 38.6 39.8 14.2 1.9


Evaluating the Career of Hanley Ramirez

Hanley Ramirez first came up with the Red Sox in 2005, had two plate appearances, and then was dished to the Marlins.  He officially started his regular career in 2006, and didn’t look back for the next five years.  He has often been credited for the many tools that he has or had: speed, hitting for average, and hitting for power.  But rarely has he been credited for doing all at the same time.  This article is to show you, the reader, exactly how rare Hanley Ramirez has been, and how to appreciate him correctly.

Since he came up to the major leagues in 2006 with the Marlins, Hanley Ramirez has wowed us with his skill.  In the early stages of his career, he was a young shortstop with amazing speed, good hit skill, and pop in his bat.  In that rookie season, he hit a solid .292 with an unexpected 17 home runs, and, most surprising of all, he notched 51 stolen bases.  He skipped the dreaded sophomore slump in his next big-league campaign, matching his previous total of 51 swiped bags, while improving almost everything in his stats.  He hit an amazing 29 home runs in 2007, while knocking in 81 runs and accumulating an impressive 5.2 WAR.  The most impressive part about that 2007 season, though, was his amazing .332 batting average.  

At this point in his career, many analysts and fans predicted that this would represent his regular prime stats — and what outstanding stats they were.  Yet it was not to be.  If believable, he got even better the next year, upping his homer total to 33, and improving both his walk rate and his ISO.  In addition, he raised his WAR to an astonishing 7.5.  Somehow, he did all this while dropping his BABIP 24 points, to ‘only’ .329, and stealing 16 less bases than in the previous year.  In his fourth year in the major leagues, his homer total along with that of his stolen bases dropped to below the 30 mark, but his average leaped up 40 points to .341!  His WRC+ also climbed 5 points to 149.  A less amazing year followed in 2010, but he was still impressive, hitting at a .300 clip with 21 homers and a 4.2 WAR.  

In 2011, he ended his streak of incredible campaigns, hitting for only a .243 average with a paltry 10 home runs.  In his first year as a veteran in the major leagues, Hanley picked his homer total up to 24, but his average remained below .260.  Overall, it was a pretty dismal two-year span for Hanley.  He rebounded spectacularly the next year, though, hitting .345 with 20 homers for a new team, the Dodgers.  Unfortunately, Hanley’s homer total dropped to 13 in 2014, but he kept his average up to .288.  He also drove in 71 runs that year, making the year not a complete failure.  

He didn’t keep up his good streak for long, though.  In 2015, with the Red Sox, his average dropped back down to .249, while hitting 19 home runs.  Coming into 2016, Hanley must have tweaked something in his approach, because he had his first solid year in a long while.  With everything complete, he had 30 homers and 111 runs batted in with a .286 average.  That is a comeback.  It’s crazy, though, when looking at the journey he’s been through in the big leagues.  He’s hit for power, has stolen bases, and accumulated 7+ WAR — twice!  He did all this at the plate while playing the middle infield, corner outfield, and corner infield.

So now that the whole length and breadth of Hanley’s career has been touched upon, there is now a base on which his career can be evaluated.  Starting, of course, from the year he came up, it’s obvious from the overview above that Hanley was spectacular.  It’s certainly not normal for a player of his youth (he was 23 when he broke into the majors) to be successful upon immediate entry into the premier baseball league in the world.  So when looking at his statistics from that first year, it’s not too surprising to see that his BABIP in that first year was an unrealistically high .343.  That could mean many things.  The first thought that comes to mind when seeing a BABIP that high is “an extreme overdose of luck.” However, a whole season (700 plate appearances) is long enough that luck would wear off after less than half the season went by.  The luck theory seems even more ludicrous when looking at the next four years of his career.  In those four years, he averaged a BABIP of .345.  

There is another well-documented theory that may be applicable to Hanley’s situation.  He could, like Paul Goldschmidt, have been hitting so many line drives that such a high BABIP is easily achieved.  However, this theory is disproved when his average line-drive percentage is seen.  He averaged a line-drive percentage around 19 percent, compared to Goldschmidt’s idealistic 24 percent.  

This is not a case when the easy way out is taken, and it’s just said “that’s just who he is, he just hits for a high BABIP!”  Indeed, it is not who Hanley is: after those five years, his BABIP dropped to just .275 and .290 for two years afterward.  Thankfully, this question is easily solved by a very simple answer, one that might have slipped through the cracks of many a research team.  Such easy an answer suffices, in a day when complicated statistical analysis-based answers are some of the only answers accepted.  This is one of the few cases in which all statistical-analysis answers are proven to be insufficient, so an old tool is called upon in place of them.  

Simply put, the answer is speed.  For the first five years of his career, Hanley had unbelievable speed, evidenced by his 196 stolen bases in that span.  Of course, speed has a bigger factor than just the occasional slow roller between first and second that was beaten out through pure speed.  Speed means the opposing team pulling in their third baseman in case of a bunt, or pulling in the whole infield so the speedster doesn’t get that aforementioned infield hit (both of these scenarios would result in an easier opportunity to get a hit, because it’s extremely hard to stop a hard-hit ball when fielders are pulled into within 75 feet of home plate).  Speed means getting hittable pitches, so one is not walked, and therefore given a chance to steal a base.  

This theory of speed makes even more sense when it’s seen that as soon as Hanley’s speed began to diminish, he stopped getting a high BABIP.  His lack of speed in the 2011 and 2012 seasons affected his whole offensive output in that span.  In those two years,  he hit for an average of .250, and stole only (for him) 41 bases during those two seasons.  His rebound the next year (.345 avg., .363 BABIP) was due in large part to an uncharacteristic line-drive percentage of 22 percent, and a hard-hit percentage close to 50.  His horrible season in 2015 was most likely because of many reasons.  During that year, he had almost no remaining speed, a chronic inability to hit the ball hard, and an array of injuries.  However, he rebounded this year, accumulating 30 homers while hitting a solid .286.  

How he did that, it’s hard to know.  He barely improved his line-drive and hard-hit percentages, and certainly did not suddenly gain speed.  It’s now safe to say that somehow, someway, Hanley has completely revamped his approach to hitting.  Now that his speed is gone for good, he still is managing to stay extremely productive while not utilizing his speed to make his stats great.  Of course, he’s not even close to being as productive as he was during that five-year stretch, but he has managed to do what almost no speedster has done in the past: stay productive after the age of 31, when speed starts to diminish.  Many a speedster has fallen prey to this ailment called aging, including (but not limited to) Vince Coleman, Carl Crawford, and Scott Podsednik.  Of course, there are many exceptions, mainly Rickey Henderson and Ichiro Suzuki.  So Hanley has joined an elite club, one that definitely does not fit his style of play.

Over his career, Hanley has proven to be able to hit for power, average, and line drives, while also running well for a while.  Out of the five tools in baseball, three are for hitting.  Hanley could be the image of each, from different points in his career.  

Speed: he had two straight 51-steal seasons.  

Average: he has a .295 career average over his 11 year tenure in the major leagues.

Power: he’s accumulated seven seasons of 20+ home runs.  

He truly is and has been one of the most talented players in the major leagues.  Despite this, Hanley remains to be one of the most underappreciated players in the major leagues.  Not many players have done what he has done in his career, yet he is viewed as a good comeback player, not as the personification of the tools in hitting.


Has Tyler Flowers Finally Blossomed?

As expected, it was mostly a miserable season for the rebuilding Atlanta Braves. The team struggled mightily, especially on offense. The Braves scored the second-fewest runs in baseball. They owned an 86 wRC+, third-lowest in the MLB. In fact, they only had two hitters with a wRC+ of 100 or higher. The first is unsurprisingly Freddie Freeman, who sat at a sterling 153 wRC+. In second, there is a modest surprise: it’s Tyler Flowers, who sat at a 111 wRC+.

Rebuilding teams generally strut out their top prospects regularly, but they also play high-upside guys they signed off of the scrap heap. Flowers fits the latter description. Although he was drafted in the 33rd round, he raked in his first three professional seasons:

Season Team G PA HR SB BB% K% ISO BABIP AVG OBP SLG wOBA wRC+
2006 Braves(R) 34 150 5 0 10.70% 20.00% 0.186 0.326 0.279 0.373 0.465 0.389 135
2007 Braves(A) 106 445 12 3 11.00% 16.60% 0.190 0.339 0.298 0.378 0.488 0.387 133
2008 Braves(A+) 122 520 17 8 18.80% 19.60% 0.206 0.342 0.288 0.427 0.494 0.415 154

His first full season in 2007 produced an awesome 133 wRC+ and led to Flowers’ first prospect ranking. Baseball America named him the Braves 12th-best prospect after that year. He didn’t get another chance to be ranked in the Braves system after 2008 though, because he was traded right after the season ended. He headlined a package of prospects that went to the White Sox for Javier Vazquez and reliever Boone Logan. Vazquez went on to pitch 219.1 innings with a 2.87 ERA that season for the Braves, and Boone Logan would go on to become a pretty solid lefty specialist (although he wasn’t effective for the Braves).

The other prospects in the deal (Jonathan Gilmore, Brent Lillibridge, and Santos Rodriguez) were not as highly regarded as Flowers. Soon after the deal was completed, the post-2008 season prospect rankings were released by Baseball America. Flowers was ranked the fourth-best prospect in the White Sox system and the 99th-best prospect in the majors. Lillibridge came in at eighth in the organization, Rodriguez came in at 18th, and Gilmore came in at 21st.

The other prospects would go on to become non-factors. Gilmore and Santos have never reached the majors. Lillibridge has a 60 wRC+ in 784 MLB PAs and a negative defensive value, netting him a career WAR of -1.7.

Meanwhile, Flowers steadily climbed up the organizational ladder. His first season with the White Sox was great in Double and Triple-A:

Season Team G PA HR SB BB% K% ISO BABIP AVG OBP SLG wOBA wRC+
2009 White Sox (AA) 77 317 13 3 18.00% 24.00% 0.246 0.383 0.302 0.445 0.548 0.444 177
2009 White Sox (AAA) 31 119 2 0 8.40% 26.90% 0.152 0.394 0.286 0.364 0.438 0.363 126

That year, he even earned a September call-up. After the season, BA ranked him as the White Sox No. 2 prospect and 60th overall, and FanGraphs ranked him as the White Sox’s best. Unfortunately, in his next season, Flowers only managed a 108 wRC+ in Triple-A in 412 PAs. His strikeout rate escalated to 29.4%. Still only 25, he improved in his next season, garnering a 148 wRC+ in 270 Triple-A PAs (although his strikeout rate was a staggering 31.1%). This warranted Flowers’ first extended look in the majors. He was given over 100 PAs in each of the next five seasons, but he could never quite reach his potential. He showed power at times, with a .199 ISO in 282 PAs in his first two years, boosted by 12 homers. However, with a walk rate below 6% in the next three seasons, coupled with a K-rate of over 30% in two of those three seasons, Flowers could never get on base at a solid clip. To make matters worse, his power bottomed out. His ISO shrank to .118 last year in 361 PAs. Here are his offensive numbers on the White Sox overall:

PA H 2B 3B HR R RBI SB CS BB% K% ISO BABIP AVG OBP SLG wOBA wRC+
1360 279 50 2 46 119 142 2 5 6.30% 33.20% 0.155 0.311 0.225 0.288 0.380 0.295 84

So, despite tallying 27.3 defensive runs above average (according to FanGraphs) in his first five seasons, the White Sox non-tendered Flowers after 2015 because of his poor offensive output. The Braves (again!) scooped him up for a mere $5.3 million guaranteed over two years. That gamble seems to have paid off, because Flowers had his best offensive season in the majors this year. In 325 PAs, his walk rate is back up to 9%, above league average and his second-best in a season. His strikeout rate is down to its lowest ever, at 28%. His ISO, though still below league average, is up 33 points. His BABIP has skyrocketed, at .364, the highest of his career. All of this has led to a .270/.357/.420 triple slash, with a .338 wOBA and a 110 wRC+. What’s going on? Had Flowers made any changes? Is he finally going to reach his potential? Let’s find out.

First, let’s take a look at Flowers’ plate discipline. His O-Swing%, at 27.2%, is his lowest since 2011. That puts him in a tie for 79th-lowest out of the 266 hitters with at least 300 PAs this year. His below-average O-Swing% paired nicely with an above-average Z-Swing% (67.9%). He has the 63rd (out of the 266 hitters) best differential in those two categories (O-Swing minus Z-Swing). Basically, Flowers has been laying off of balls and swinging at strikes.

Possibly because he was swinging at better pitches, Flowers made much more contact. His swinging-strike rate (percentage of swings and misses against all pitches he has seen) dropped to 11.6%, easily the lowest of his career. His contact rate (percentage of contact against all swings) rose to 74.6%, a career best as well. While these two marks are still below average, they represent a significant improvement for Flowers.

Better selection seems to have led to better contact quality for Flowers. This year, he posted easily the lowest Soft% (13%) and highest Hard% (44.3%) contact percentages of his career. Using the sample of 266 hitters from earlier, Flowers tied for the 17th-lowest Soft%, and he had the fourth-highest (!) Hard% (just above teammate Freddie Freeman!). Statcast agrees wholeheartedly that Flowers improved his contact quality. He had the fifth-highest (!) average exit velocity among the 272 hitters with at least 170 batted-ball events this season. He added 3.2 MPH to his average exit velocity since last year. Statcast also says that Flowers tied for the fifth-highest (!) estimated swing speed out of the 294 hitters with at least 150 batted-ball events this year. In addition, he also dropped his popup rate (IFFB%) by more than 50% from last year. Lastly, his Pull% dropped a ton this year. He tied for the 38th-lowest Pull% among the sample of 266 hitters from earlier. Since he doesn’t pull many grounders, it’s harder to shift on him. Therefore, he’ll get more base hits on grounders. These improvements make it look like Flowers can maintain a high BABIP.

While these are all good developments, part of his improving plate discipline may just be because Flowers saw his lowest percentage of pitches in the zone since 2011 (45.8%), so it was easier for him to take more walks. In addition, many of these improvements are so much better than anything Flowers has ever done in the majors, so I’m guessing some regression is in order, especially in these areas:

O-Swing% Contact% SwStr% Soft% Hard% IFFB% Pull%
2016 27.2% 74.6% 11.6% 13.0% 44.3% 5.3% 34.9%
Career 31.0% 69.2% 15.1% 18.6% 33.1% 10.5% 41.8%

Another knock on Flowers: generally, exit velocity leads to more power, but most of the good numbers for Flowers there have come from his exit velocity on grounders, which won’t lead to more power. He had the third-highest average exit velo on grounders, but only the 26th-highest on fly balls plus line drives. However, 26th out of 272 is still good.

Despite the high average exit velocity, Flowers had the 19th-highest rate out of 272 in terms of barrel hits/batted-ball events (which is still good, but not quite as good as the other exit-velo leaders). This is another reason why Flowers may have a lower-than-expected power output.

Overall, there were definitely some encouraging signs from Flowers this year. He was more disciplined and he made more and better contact. His power should improve if he keeps hitting the ball hard and swinging at good pitches. In addition, although he had a negative Defensive Runs Added this year for the first time, his framing has improved tremendously in the last couple of years. He saved over 13 runs this year (fourth-best in the majors) after saving over 22 last year (second-best).

Flowers’ success in the minors supports his success this year somewhat, but then again, this is his first above-average offensive season in the majors (in six tries), and he’s not getting any younger (he’s 30). Furthermore, since BABIP is volatile, even for hitters with great contact quality like Flowers, it will be hard for him to be consistently good, unless his power improves (which it probably should) and he maintains his strides in plate discipline. He’ll probably be given enough at-bats for us to find out, given the Braves’ level of terribleness and his defensive prowess.

Data is from FanGraphs, Baseball America, StatCorner, and Baseball Savant.

Thanks for reading!


Rick Porcello’s Shot at the Cy Young Award

You’ve probably read countless treatises on the reasons that Chris Sale, Corey Kluber, or Justin Verlander would be more deserving of the Cy Young Award this year.

Well, I’m sorry to disappoint, but Rick Porcello is probably going to win the award. It’s going to upset a lot of quantitative purists that adjust for everything. Pick your favourite value-added statistic, and Rick probably doesn’t quite win it, or there is an inherent flaw where you can take something away from him on the stats that he did lead (WHIP and BB allowed). The truth is that this year’s winner will reflect quantitative and qualitative considerations.

Consistency, volume, and increasing difficulty  

He, of the never-meltdown. Rick allowed five runs once, and never failed to give his team 5.0 IP in any start this year. Not to suggest that innings-eating alone should be rewarded — Wade Miley, take a bow — but Porcello has provided a quality start in every start since June 28 (with the exception of one 4 ER, 6.2IP appearance on July 24). Tim Britton captures it well in a recent article for the Providence Journal, noting that every other candidate has been shelled a few times, and Hamels not once, not twice, but fifce! I’m sure it was nice for the boys in the dugout to know that if they played reasonably well offensively, that there was a very good chance to win every time Porcello was on the mound, and with it, a good chance that losing streaks would be rare for the team. A casual observation, much as any season-ticket holder in Boston might note, is that Porcello made one of the worst pitchers’ parks into a graveyard. 13-1, with a 2.88 ERA in Fenway, is no easy task.

With a decent start Friday night, Porcello finished with 223 IP. Both Sale and Verlander just clipped that, but Porcello finished near the highest inning total of the candidates, so workload could also be a consideration.

It also got no easier as the game wore on as he was better each time through the order: .264, .230, .195, and .121. Yes, Kluber has managed to pitch to some of the best soft contact this season, but that alone is not going to win the award, and is a fringy measure that does not have full traction from the press.

Image

Porcello puts in the work, keeps his head down, and would appear to be pretty humble about it. Most people didn’t even notice him over there in Boston. Porcello perhaps did not need to contend with throwback jerseys, but making confetti of your uniform isn’t the spirit of the game, and may well have left a Windy City starter as another man out this year.

Punishing wins & The Contender Effect

While it may be in vogue to punish pitchers for having good teammates, making allowance for consistency, Porcello has still won 22 games. Say what you will, but most people want a winner. A winner in a big market, with big stories, and a big slugger, are good things all-around for the league. Too often pitchers are victimized for the fielders behind them, but what is rarely addressed is that a pitcher can sometimes deploy this to his advantage, and Porcello has certainly made the best use of his team in this regard.

Frequency bias in the awarding of the AL Cy Young

Major League Baseball’s penchant for sharing has been well documented. This is well covered by a certain Managing Editor with a man who hits and walks, and who has been oft-written as being the ‘best-hitting guy’ every year, but who will likely finish second because, gosh, he’d much rather share with a friend from Boston with a winning smile. The writers association hasn’t allowed a repeat AL Cy Young winner since Pedro in the 99 & 00 seasons, and what I will call a ‘gap’ winner since 04 & 06 with Johan Santana. In both those cases, first-place votes were unanimous, and that certainly won’t be the case with this year’s crop. Kluber is ‘too soon’ (2014) and Verlander is too, well, I don’t know what, but he won it in 2011. Since Detroit failed to make the playoffs, I suppose you could pull in the Contender Effect that leaks into the psyche of proletariat, and certainly to some extent, with the voters.

Conclusion

It’s not that Porcello is so much more deserving of the award, but rather, that nobody else has distanced themselves from the pack so as to make themselves most deserving. In addition, he’s made a timely run for it against other guys who have ‘been here before’ or have given other reasons to not vote for them. He’s had some luck, but he has also shone in two of the leading controllable areas — by limiting walks (first among starters) and hits (first among starters in WHIP). There are qualitative factors that will affect the outcome and for these reasons, I think we’ll be crowning someone that has not won the award yet and that’s good for the game.


Paul Goldschmidt Has a Pop-Up Problem

When we were growing up, my dad would sometimes refer to my sister and me as ingrates. I always had a sneaking suspicion that statement was ruthless. I was young and under the assumption that he provided us everything we needed and wanted because that was what he was designed to do. In a sense, that perception of him probably does reflect the “ungratefulness” that young children tend to posses, innocent as it may be, what with a child’s inherently feeble comprehension of interpersonal relationships. I am now the parent of a two-year-old boy and just the other night he saw a commercial for a Power Wheels Jeep Wrangler that elicited the following outburst:

“I want to go in there!”

“I want one!”

Finally he turned to peer into my eyes and, in order to accentuate the severity of his next mandate, he raised his index finger and spoke;

“Daddy, better buy me one.”

His tone became dramatically more somber than it had been for the first two exclamations, and it made me laugh the hardest. I am certain I was the narrator of many statements similar to this as a kid, but the reality is, when kids are given everything they want, it’s up to the parent to understand that if there is a perceived lack of gratitude, it is a direct byproduct of the parent’s efforts to make them happy or even to keep them alive.

Lately I’ve been thinking of how I can be really ungrateful for even truly fine baseball seasons. Even some All-Star seasons disappoint me, and I know I’m not alone. If Mike Trout was in the middle of putting up a 5-win season, we’d all be talking about what could be wrong with Mike Trout. When players set the bar so ridiculously high we tend to hold them to that standard for better or worse. As an actual example, it’s completely understandable to be disappointed by Bryce Harper’s 2016 season after last year’s masterpiece. The reality is, however, that he’s 23 and has currently produced 3.4 WAR. His baserunning and defense have been positives and he’s compiled over 20 home runs and 20 stolen bases while hitting 14 percent better than league average; that’s damn fine and yet it’s still a damn shame.

Paul Goldschmidt, meanwhile, is hitting .301/.414/.494 and has accrued 4.7 WAR and might surpass 30 SB this year. His 136 wRC+ is still great even if it’s not quite the 158 he’s put up over the last three seasons. So why do I feel the loathsome inklings of disappointment bubbling inside of me? Firstly, and admittedly shallow of me, I like my Goldschmidt with more extra-base hits. For the first time in his professional career, at any level, Goldschmidt’s ISO starts with a number under 2. It’s possible he has a nice final week and brings that number up into the .200 range, but there are still some potentially concerning blips in his batted-ball profile that could portend of further decline in production. What I’m referring to most specifically, as the title suggests, is that Paul Goldschmidt has developed a pop-up problem.

From 2011 through 2015, Goldschmidt’s cumulative IFFB% was 4.8%. This year it sits at 14%. He has 17 IFFB this year, which is the same amount he had in the three previous seasons combined. Pop-ups aren’t good as they’re essentially as productive as a strikeout. Here are the 10 players with the biggest increases in IFFB% in 2016 compared to 2015 among qualified hitters in both years.

top-10-chart

I’m not suggesting there’s a positive correlation between popping up and performance, but it’s easy to make sense of some of the names that appear on this list. If you watched Josh Donaldson break down his swing on the MLB Network, you know that a lot of players are thinking about not hitting the ball on the ground because damage is done in the air. Did you know that DJ LeMahieu, at the time of this writing, has a higher slugging percentage than Goldschmidt? That’s bonkers. The league’s slugging percentage last year was .405, and this year it’s .418, but this group of players, minus Goldschmidt, have added, on average, 21 points to their slugging percentage, and part of that, for this group, has to be chalked up to putting more balls in the air.

popupsimprove

What I’m hoping to highlight is that what is even more troublesome for Goldschmidt is that he is the only player in this top 10 who had an increase in their IFFB% while also seeing his fly-ball rate and hard-hit rate drop.

goldschmidtpopsdown

So I have what could be an insultingly obvious hypothesis: since Goldschmidt has long been a quality opposite-field hitter, I am theorizing that pitchers are exploiting him with more fastballs up and in where he can’t quite get his hands extended. A cursory glance at his heat map vs. fastballs in 2015 and 2016 reveals a minor shift in approach by the league.


 goldschmidt-fb-2015goldschmidt-fb-2016

Besides the obvious, which is that pitchers are avoiding the zone even more than they had before, we can see just a bit more red in the specific zone I was referring to. It’s not so glaring or even enough information to make any conclusions, so let’s see if that area is where pitchers are getting Goldy to pop up. On the year, per Brooks Baseball, he has 22 pop-ups, 19 from fastballs and three from offspeed pitches. The 17 that are classified as IFFB by FanGraphs are plotted in the graph below.homemade-heatmap

*the two pitches towards the outside corner (for Goldschmidt) are sliders.

However, it’s not as if pitchers have previously avoided throwing Goldschmidt up and in; it just appears, despite his overall swing rate being at a career-low 39%, he’s upped his swing rate against fastballs by over five percentage points in that specific area just above 3.5 ft. And that area has the largest concentration of his pop-ups.  Looking at the entire area middle/up/and in to Goldschmidt, he has increased his swing rate from 57.2% in 2015 to 60.7% in 2016 while staying away from lower pitches in general. It’s a philosophy that is being echoed throughout baseball right now, and it is not at all a bad plan, but it has caused him, either deliberately or due the effect of swinging at these pitches more often, to go to the opposite field this season less than he ever has. This also is not necessarily a negative shift in regards to a batted-ball profile, but from 2013 – 2015 Goldschmidt was the fifth-most productive hitter in baseball going the other way, and in 2016 he’s 33rd. That represents a drop in wRC+ from 204 to 158, and from a .729 SLG (.329 ISO) to a .647 SLG (.255 ISO). I’ve long since regarded Goldschmidt to be in the same tier of hitters as Trout, Votto, Cabrera, and pre-2016 McCutchen, and it would be a shame for him to move away from a facet of his game that enables him to produce at that elite level.

At the end of this season I don’t think I’ll actually be all that worried about Goldschmidt; I can reconcile a 136 wRC+, even if it would feel a little disappointing. I wrote about Paul Goldschmidt last year and I wasn’t worried then, either. But I do think if I’m going to take a 136 wRC+ for granted I should place that appreciation toward the catalyst for this change in Goldschmidt’s performance, and a lot of that credit has to go to the pitchers who have induced 17 IFFB from a player who only averaged 5.7 over the last three seasons.

Now I know that setting up a pitch has so much more to do with an entire at-bat, game, or even season than the pitch that was thrown immediately before it, but for this exercise I want to look at the pitch that caused Goldschmidt to pop up and how it relates to the pitch thrown immediately before it. It’s crude and does not tell the whole story, but it still shows a definite approach — and, for all intents and purposes, it’s probably a decent representation of a general tactic used across the league for inducing pop-ups. I found all the data I needed using PITCHf/x at Brooks Baseball and I recorded the velocity, horizontal movement, vertical movement, horizontal location, and vertical location of each pitch Goldschmidt popped out on as well as the same data set for each set-up pitch if there was one (which would be in any situation where Goldschmidt did not pop up on the first pitch of an-bat). Below you’ll find a plot that shows the average location and characteristics of each pitch.

poppy-uppies

And here is that data in a table represented as the average difference between the two plot points.

pitchdiff

Doesn’t it make you feel warm when something fits into the shape you had pegged it to be? That’s just really simple and makes a hell of a lot of sense. Or maybe I feel warm for taking something that was disappointing and turning it into something I can really appreciate.  Now if you’ll excuse me, I have a Power Wheels Jeep Wrangler to buy.


Someone Give Juan Uribe a Job

Todd Frazier has 38 home runs this year. That’s probably a strange way to start off a post about Juan Uribe but hang with me.

Todd Frazier has 38 home runs this year. Todd Frazier also has a wRC+ of 100 this year. That is a pretty remarkable combination. According to wRC+ Frazier has been exactly an average hitter this year despite the fact that he is currently 8th in all of baseball in home runs. This interesting and seemingly unlikely union piqued my curiosity and sent me down a statistical rabbit hole in search of home runs and terrible wRC+’s. At the bottom of that rabbit hole is where I ran into Juan Uribe.

Juan Uribe has not played an MLB game since July 30th. In that game he went 0-for-3 and he was released by Cleveland a few days later on August 6th. This probably wasn’t a surprise to most people as A) Most people probably would be more surprised to learn he was still in the league to begin with, and B) he was running a 54 wRC+ over 259 PA with Cleveland this year.

But I’m not here to argue that someone should give Uribe a job because his current talent level deserves one (although you probably could; he was nearly a 2-WAR player as recently as last year). I’m here to argue for someone to give him a job because Juan Uribe is on the cusp of history. Juan Uribe has 199 career home runs.

You might think that 200 career home runs isn’t that much of a milestone and it’s only because humans love round numbers that we even recognize it as a milestone. And you would be absolutely correct in saying that. But much like Todd Frazier’s 38 home runs this year, Juan Uribe’s 200 career home runs would be fairly unique. In fact they would be entirely unlike anyone before him because Juan Uribe would be the worst hitter to ever hit 200 home runs.


table1


That is the board of directors of the Terrible 200 Club (patent pending) and as you can see Juan Uribe is poised to unseat Tony “why the hell am I standing sideways at the plate” Batista as CEO with one more measly home run, and by a pretty decent margin. Obviously though his bid is now under threat because he is 37 years old, has been without a team for over a month now and was absolutely awful when he did have a team. It is entirely possible, maybe even likely, that he never hits another MLB home run. And it’s not like there is another current player who is a slam dunk to make a run at Batista if Uribe never steps into the batter’s box again:


table2


Brandon Phillips will get to 200 but he is sneaky old. He turned 35 in June, so while he is nowhere near what he was earlier in his career it seems unlikely that he plays long enough to see his career wRC+ fall below 90.

AJ Pierzynksi is all but done at this point. At 39 years old and nearly a win below replacement level this year it’s probably more likely that the ghost of Clete Boyer gets signed and hits 38 home runs to get to 200 as it is Pierzynski hits 12 more in his career.

-Which bring us to James Jerry Hardy. Hardy seemed to be doing his best to crater his wRC+, posting a dreadful 50 last year, but he has rebounded (relatively speaking) to post a 93 so far this year. One has to wonder if he can even get to 200 home runs (he still needs 16 more to get there and he has hit only 26 over his past 1404 PAs), and secondly, if he does, will he post a wRC+ low enough to “best” Batista? You could probably argue that any version of Hardy that is good enough to get to 200 homers is probably also good enough to not decimate his career wRC+.

The easiest solution is for some intrepid and/or awful team to just give Uribe a spot so that he can chase history with each swing. Atlanta, Arizona, Minnesota, what have you guys got to lose? Would a Kickstarter or GoFundMe to pay some of his salary help? It would just be such a shame for the baseball public to be denied a potentially marvelous thing when it’s so close to realization. Like teasing a dog by pretending to throw a ball or every season after the first one of Homeland.

Somewhere Tony Batista is sitting in a recliner, probably in some crazy way that no one else sits in recliners because he is Tony Batista, just waiting for the news that Uribe has been picked up by someone so he can hand the crown to the new king of the Terrible 200 (patent pending). He just needs a little help. Let’s make this happen, MLB.


Three Fringe NL Central Prospects Assigned to the AFL

*College stats taken from thebaseballcube.com, minor-league stats taken from fangraphs.com and MLBfarm.com

Last week, Baseball America released their Arizona Fall League (AFL) rosters. For those not familiar with the AFL, read more here. In short: each August, all 30 MLB clubs select six players from their minor-league rosters to participate in the fall league. While the minor-league playoffs wrap up toward the end of September, the AFL serves as a domestic developmental league starting in October.

The AFL is prestigious, bringing together some of the top minor-league talent each year. Aside from well-known names, organizations tend to also invite rising prospects who have flown under the radar. Although these NL Central prospects have gotten little public hype, their recent numbers have impressed enough to earn an invite to the AFL, making them intriguing names to watch in the coming months.

Barrett Astin – RHP 6’1” 200, Blue Wahoos (Reds AA), Age: 24 (Video)

Astin had a strong 2012 season as a closer during his sophomore year at the University of Arkansas, helping a well-staffed Razorback team to the College World Series. However, he started all five of his appearances in the Cape Cod league that off-season, where he posted an underwhelming 6.23 K/9 and 2.91 BB/9 through 21.2 IP. He went back to college to find himself in the rotation for the majority of the year, though scouts questioned his durability as a starter as he continued to struggle to go deep into games, going more than 6 IP in only one start. He was signed in the 3rd round in the 2013 draft at slot value by the Brewers, soon being dealt to the Reds for Jonathan Broxton a year later.

Despite being omitted from MLB.com’s top 30 Reds prospects this season, the Reds chose to send Astin to the AFL after having an impressive season in AA alternating between the bullpen and the rotation. In 103.1 IP, he posted an 8.39 K/9 (his career high) with a 2.18 BB/9 and a strong 65.02 GB%, numbers that would play well at hitter-friendly Great American Ball Park.  His ERA sits at 2.26, which is best in the Southern League and roughly 40% better than the league’s average ERA. His low BABIP (.246) and high LOB% (78.9%) may lead to some regression when it comes to run prevention, but FIP still has him pegged at an above average 3.37. His 11 starts have yielded similar peripherals to his numbers from out of the bullpen. However he still showed durability issues, only averaging 5.1 IP/GS this year.

The question is the same now as it was the day he was drafted: can he stay a starter? Considering the Reds have Homer Bailey, Anthony DeSclafani, and possibly Cody Reed solidified in the rotation with prospects Amir Garrett and Robert Stephenson expecting to be in the rotation as well, my guess is that Astin’s ticket to the big leagues will be as part of the relief corps for the Reds. His inability to show consistent stamina and his better numbers against righties than lefties (all 8 HR allowed this year have been off of lefties) all indicate he is better suited as a bullpen option. Considering the Reds’ well documented bullpen problems this year, Astin could have his MLB debut with a rebuilding Reds team sometime next year if all goes well. His AFL stint should give a good indication on which direction he is trending heading into his 25th birthday.

James Farris – RHP 6’2” 210, Smokies (Cubs AA), Age: 24 (Video)

Another participant in the 2012 College World Series, Farris started and pitched seven innings in Arizona’s World Series-clinching win. He was drafted in the 15th round by the Astros after a below-average junior campaign, only to return to Arizona for his senior year. He was drafted in the 9th round by the Cubs at the end of the his last and best year playing in the Pac-12.

Baseball America’s draft-day scouting report notes that Farris does not have overpowering stuff and transformed into a smart, command-oriented pitcher over the course of his four seasons with the Wildcats (subscription required). His best pitch is his changeup, with a 85-89 mph fastball, which he mixes speeds to add cut to, and a below-average curveball to round out his arsenal. His lack of an average third pitch gave the Cubs reason to put him in the bullpen, where he has spent all 127 innings in the minors thus far, and is part of the reason he is not a top-30 prospect in a highly talented Cubs farm system according to MLB.com.

The Cubs’ decision to put Farris in late-inning situations out of the bullpen has paid dividends thus far. In his minor-league career, he holds a 2.91 ERA with a 10.70 K/9 to a 2.69 BB/9, despite only holding a 6.95 K/9 throughout his four years starting at Arizona. He has an average ground-ball rate and the ability to suppress power (as he also did in college), only yielding 2 HR in his professional career thus far. Because of his high strikeout rate and low HR/FB%, ERA estimators have been lower than his ERA.

Farris’ performance thus far has been a pleasant surprise considering the bargain the senior signed for only $3,000. The question surrounding Farris is whether or not he can sustain the numbers he has put up to this point in his career. His sample size has been relatively small, so tracking Farris’ outings in the AFL should shed more light onto the legitimacy what he has done the past couple years. With key pieces Aroldis Chapman, Pedro Strop, Trevor Cahill, and Travis Wood all free agents to be, there could be some room for Farris sometime next year depending on how the Cubs’ off-season and spring training play out.

Corey Littrell – LHP 6’3” 185, Redbirds (Cardinals AA), Age: 24 (Video)

Littrell was drafted out of high school in the 43rd round by the Nationals, but was too committed to the University of Kentucky to sign. After starting for the Cats for three years, he was drafted in the 5th round by the Red Sox for near slot value in 2013. He was traded the next year to the Cardinals in the deal that brought Joe Kelly and Allen Craig to Boston in exchange for John Lackey, Littrell and $1.75MM in cash.

A lanky pitcher who lost 10 pounds since draft day according to the Memphis Redbirds official roster, Corey has a similar frame to his father and grandfather, who both played professional baseball as well. According to MLB.com, Littrell is the 29th-best prospect in the Cardinals organization. He throws a fastball that sits 88-90 that plays as average because of above-average command down in the zone. He also has three other average offerings: a changeup, a curveball and a cutter with slider-like action. He was a starter until this year, where he has come out of the bullpen in 52/53 appearances between AA Springfield and AAA Memphis.

After a quick and effective stint in AA to start off his 2016 campaign, Littrell struggled with control in AAA with a hefty 5.08 BB/9 paired with a slightly above-average 8.59 K/9 in 51.1 IP. One positive note for Littrell is that he has done well controlling balls in play since his switch to the bullpen. His 2016 ground-ball rate is up to an above-average 51.5%, which is a career high. His run prevention, however, has been subpar due to his high walk rate, yielding a 4.56 ERA and 5.01 FIP in Springfield.

Since the Cardinals bullpen has been average to date according to WAR and the majority of the relievers are controlled through next year, there may not be a spot for Littrell to begin the Cardinals’ 2017 season unless he impresses from here on out. However, if he can regain the control in the AFL that he had before his promotion to AAA and keep it through the beginning of next year, he could become an option for the Cardinals sometime next season.