Archive for Player Analysis

Give a Fat Guy a Chance?

Bartolo Colon has not been good. There is no way to spin things to say that he has been good. Conversely, it is pretty easy to spin things to say he is bad. After another bad outing on Monday, his ERA is 7.78 in 59 innings of work. Masahiro Tanaka and Bronson Arroyo are second- and third-worst among qualified starters, at 6.34 and 6.24 respectively.

However, if you look at other statistics, they are not so bad. By FanGraphs’ measure of WAR, he is a tick above replacement level. His K% and BB% have both trended in the wrong direction by a couple points when compared to recent three-year stint with the Mets. His HR rate is up, though some of that may be attributable to what might be a very homer-friendly home park. Colon has also suffered from some bad batted-ball luck, with a BABIP of .353, only .004 points lower than his 2007 season that ended his tenure with the Angels and made many question if he was finished.

However, above all else, what is hurting Colon is probably his strand rate. As of right now, his LOB% is 48.5%. This is terrible. This is pretty much without precedent. And here is a table to show exactly how unprecedented this is:

Qualified Players with LOB% under 52% (since 1900)
Player Year LOB%
Dolly Gray 1930 51.8
Bartolo Colon 2017 48.5
Mike O’Neill 1903 47.4


When you see charts like this and statistical points like this, one thing that should always pop into your mind is that the 2017 figure represents about one-third of a season. Regression to the mean should make Colon’s LOB% go up over the course of the next year. Unfortunately for Colon, he is on the wrong side of 40 and often times when older players struggle, whether fair or not, it spells the end of the road. However, there is evidence that in cases like this, pitchers do not get the opportunity to play their ways out of struggles, regardless of age.

What I wanted to do here was look up pitchers who had similar LOB% to Colon through a comparable amount of the season, and to see what happened to those players. To me, that would have been ideal. However, I get an error message when I try to do that on the leaderboards, so I’ll have to present some less ideal numbers and invite anyone else who has access to look into this further.

Going back to 2002, using a minimum of 50 innings pitched, Colon still has the very worst LOB%, just ahead of a guy you might have heard of, Roy Halladay, who clocked a 49.4% rate in what was a truly dreadful 2000 campaign. Looking through the bottom 50 LOB% list, you will find a couple interesting trends. First, a lot of these players played for terrible teams. The early-2000 Tigers and mid-2000 Devil Rays have a few entries. Colon joins Williams Perez’ extremely forgettable 2016 season as the recent Braves on this list. Second, aside from Derek Lowe in 2004, none of these pitchers came close to pitching a full season. Lowe, who checks in at #26 on this list, had 10 more starts and 45 more innings than the second-highest total.

What this list does not account for, however, is that there could be pitchers like Colon that do very poorly in the LOB% department early in the season, but then turn things around due to better luck and thus do not end up on this list. In order to do this, I wanted to look at players that were similar to Colon’s 2017 season. Colon sports a 123 FIP-, which is worse than league average by a decent amount, but not close to his 184 ERA-.

Looking at the next 10 worst LOB% ranked players, you see that they were not having good seasons. Here are the players:

2008 Boof Bonser
2007 Dallas Braden
2010 Charlie Morton
2002 Jose Lima
2012 Brian Duensing
2006 Taylor Buchholz
2012 Justin Germano
2011 Charlie Furbush
2014 Yohan Flande
2008 Josh Fogg


And here is how they compare to Colon’s 2017 (numbers as starting pitcher only):

K/9 BB/9 HR/9 ERA- FIP- xFIP- BABIP LOB%
Colon 6.1 2.59 1.68 184 123 113 0.353 48.5
Next 10 5.95 2.82 1.45 166 119 109 0.319 54.3


Finally, a quick rundown of what happened to each of these players during their unfortunate seasons:

Boof Bonser: Bonser was demoted after May 31st to the bullpen, and finished the year there. Bonser was victimized by a horribly unlucky May, where his LOB% was 33.3%. Despite a lack of actual good pitching, the Twins did give Bonser a chance to improve his luck despite him being only 26. He had surgery in the offseason and barely played in the majors after that.

Dallas Braden: Braden actually did a pretty good job of keeping runners from scoring in his 2007 rookie season when he was coming out of the bullpen, but he was awful as a starter. Still, it seems as though the going-nowhere A’s did not hold Braden back as he finished the year as a starter. Braden was fairly successful until injuries cut his career short, most notably pitching a perfect game in 2010. It’s possible that Braden, 23 at the time, was helped by the A’s decision to let him continue in his starting role at the major-league level.

Charlie Morton: After starting with a 9.35 ERA, Morton was disabled, sent to sports psychiatrist, and demoted to the minor leagues on May 27th. He was able to return on August 29th, and had a decent rest of the season. Morton, who was 26 that year, has bounced around as a fringe starter ever since.

Jose Lima: Lima was a bad pitcher in 2000 and 2001 and somehow managed over 50 innings as a starter in 2002 to make this list. He struggled to a 7.77 ERA and famously responded to his release by Detroit by claiming he was “the worst pitcher on Earth.” Twenty-nine at the time, he managed to start 74 more games in the majors after that.

Brian Duensing: Duensing was 29 in 2012 and he makes this list because he managed to make just enough spot starts, despite the fact he was mostly a bullpen guy. For what it’s worth, Duensing’s 11 starts in 2012 were his last, though he still pitches in the majors. The fact that he went into the season thought of as a bullpen guy means you cannot make much out of his trajectory.

Taylor Buchholz: In his 24-year-old rookie season, Buchholz was not bad by peripheral stats when he was demoted to AAA on July 29th. The Astros, with nothing to play for, had given up on him and traded him to the Rockies, where he has two adequate years mostly pitching in relief. While it would be a stretch to say that he could have been wildly successful had he been given a chance, even a team with a new, forward-thinking GM was unwilling to look past the painful on-field results.

Justin Germano: At 29, Germano got a shot to end the year with the Cubs, and performed okay based on peripheral stats. But Germano was a journeyman player who recorded 23 of his career 48 starts in 2007. He was demoted and released, but honestly it would be the toughest sell job to say that he had any real potential.

Charlie Furbush: Furbush was a mediocre reliever in his age-25 rookie season when he was traded to Seattle in the Doug Fister trade, and for some reason the Mariners let him finish the season as a starter. He wasn’t good, but he was also very unlucky in the stranding-runners department. The Mariners held onto him, but put him back in the bullpen, where he was okay.

Yohan Flande: Flande was a 28-year-old rookie in 2014 that only made two starts after mid-August thanks to his struggles. He has barely been heard from since.

Josh Fogg: Fogg was an old man compared to the rest of this list (except of course for Colon) at the age of 33. I can’t find any indication that Fogg was demoted due to his struggles, and he finished the season in the rotation. The Reds were not playing for anything. After the 2008 season, he barely played.

Conclusion: Players with poor LOB% generally are not pitching very well, and generally are not given a chance to recover. It is likely that extremely poor strand rates are correlated with pitching poorly. Colon’s stint with the Braves and his time in baseball may be coming to an end, and he has likely been the victim of some historically bad luck. But the bad luck can only explain so much. Most of the pitchers who have pitched like Colon in the past were young guys who ended up converting to relievers or guys that were on their way out of the game. Only Braden and Morton remained starters for a significant amount of time afterwards, and Morton has been below average. They were also both almost 20 years younger than Colon is now. In other words, considering all of the bad numbers Colon has, even when taking into consideration his bad luck, there is probably not a good case to be made for giving a fat guy a chance. And he probably won’t get one.



Marco Estrada Might Be Getting Better

Marco Estrada has a .302 BABIP. If you don’t know, Estrada has been one of the best pitchers at limiting batting average on balls in play. Of the 41 qualified pitchers who have at least 750 innings pitched throughout their career, Estrada has the sixth-worst BABIP difference this season relative to his career.

Despite this increase, Estrada has managed a 3.86 ERA. It’s not great but it ranks 43rd among qualified pitchers (90) this season. Marco’s 3.59 FIP ranks 25th, one of the more intriguing developments of this season. From 2015-2016, Estrada had the second-largest difference between his FIP and ERA, behind only Dan Haren, who did not pitch in 2016.

One of the game’s better contact managers, Marco Estrada looks to be adapting. The Blue Jays ace has the best strikeout-to-walk ratio of his career thus far. Estrada has the thirteenth-best strikeout percentage this season, sandwiched between Cardinals ace Carlos Martinez and Nationals pitcher Stephen Strasburg. There are 45 pitchers who qualified for the leaderboards for the past two seasons, only six of which had a greater K/9 increase. Driving this increase looks to be the change.

Estrada’s changeup is one of the best in the league. It’s not a hard change like Stephen Strasburg’s; rather the second-slowest in the league, ahead of only Jered Weaver. There are a couple of factors that make Estrada’s changeup one of the best. Foremost, it comes with an 11 MPH separation between his fastball, making it great for generating whiffs. Furthermore, his release points allow him to deceive batters. The pitch comes from a similar angle as the fastball but travels 10+ MPH slower, making it more difficult to pick up. If you’re thinking the fastball is coming, and a split-second later you realize it’s much slower, by then you’ve already swung as the ball goes right by you. Lastly, the pitch gets little drop. Estrada’s vertical movement on the changeup was 2.56 inches higher than the next right-hander, Chase Anderson. This is another problem for the hitter as the pitch barely drops relative to a major league pitcher’s average changeup.

In the end, you’ve got a pitch that might look like a fastball from the arm slot, is going quite slow, and doesn’t drop much. You can see how the batter faces a tough quandary. The fastball-changeup combo play off each other well. Deception is a key part of Estrada’s arsenal. To get even better, Estrada began to utilize his best pitch more. Using your best pitch isn’t a novel concept. We’ve seen Rich Hill and Lance McCullers Jr. have success in this mold.

Decreasing the usage of the cutter has brought better performance thus far. The cutter is inducing more swinging strikes, and less contact, as hitters have swung more often when he throws it. In 2016, Estrada threw 625 cutters leading to a .352 wOBA, the worst of his four pitches. In 2017, Estrada has thrown 93 cutters, to the tune of a .272 wOBA, currently the best of his repertoire. Why the change? The cutter has seen a massive drop in vertical movement, likely the reason for its reduced usage. While the results have been better, the process might not be. Marco has been unable to get sufficient rise on the cutter. Moreover, the increased effectiveness might simply be due to small sample size. Or perhaps throwing it less brings its own added value.

ACEstrada, as he is affectionately known as to Jays fans, has ramped up usage of his four-seam fastball as well. The pitch is still strong and it’s traveling a mile faster. It won’t keep a 31% strikeout rate but it should continue to induce lots of infield fly balls. On the downside, the average launch speed on the fastball on line drives and fly balls is up 1.5 MPH from last season, to 94.7 MPH. This would explain part of the .316 BABIP it currently sports, up 52 points compared to his career. With a first-pitch-strike rate the highest since his last season with the Brewers, and his best walk rate since 2013, Estrada’s not making it tougher than it has to be. Pitches inside the strike zone are at the highest rate of his career. Once again, it’s because of a changeup he’s commanding very well. It’s practically 50/50 whether the change will make it in the zone, up 8 percentage points relative to his career average.

Looking at Estrada’s batted-ball profile, the big one that jumps out is the decrease in popups. He’s inducing more than 50% fewer popups this season relative to last year. The main culprit: the changeup.  Given Estrada has an 18.2% popup rate on his changeup compared to the changeup generating popups at a 34% clip during his career, it’s likely this issue sorts itself out as the season progresses. With good command, Estrada is capable of finding those easy outs through strikeouts or pop-outs.

To counteract a cutter not moving like it usually does and some BABIP regression, Estrada turned to his two best pitches. The ERA should improve as the season progresses. Being a two-pitch pitcher isn’t an easy task; Estrada has the command of his two primary pitches to pull it off. The key during the rest of the season will be to hold his strikeout and walk gains while continuing to be one of the league’s better contact managers.  Combined, the Blue Jays ace might be getting better. Marco Estrada will play a key role down the stretch; whether it be with the Jays or for a contender in a contract year.


Dallas Keuchel’s Pitch Mix Is Different but Beautiful

Dallas Keuchel has reemerged as an ace for the Houston Astros this season, as he has posted a 1.71 ERA thus far and is yet to lose a game. He has an absurd 67.4% ground ball rate while still maintaining an 8.21 K/9 innings. Keuchel’s performance has been impressive, but his brilliant pitch repertoire may be even more impressive. Starters in the MLB essentially need at least three pitches. However, a lot rely on two pitches, while sprinkling in a third out of necessity. Possessing confidence in three pitches can be a commodity. But not only does Keuchel have three weapons, he has four pitches that he can effectively use.

It all starts with the two-seam fastball for the bearded ace, which he is throwing almost exactly 50% of the time this year. Hitters are slashing .179/.252/.291 against the pitch, and it’s drawing a GB% of 80.8%. Watch the pitch in live action:

The pitch sinks at the last second, dropping from Joey Rickard’s knees as it crosses the plate to nearly hitting the dirt. Rickard may not be the poster child for hitting, but there isn’t much you can do with that pitch. Even if it doesn’t have the ridiculous late sink, it puts hitters in a bind. It’s perfectly located down and away, so hitters have to reach to get the ball. Maybe you can send it to the opposite field, but Keuchel’s two-seam generally comes in below 90 mph, so a hitter is gonna have to put a hard swing on that to get a solid line drive. And with they way it keeps guys off balance, hard swings usually aren’t finding that pitch.

But that is just one pitch, you say. Keuchel can’t replicate that perfection often. Well…

Keuchel rarely misses his spot with the two-seam, making it a dangerous ground ball/strikeout weapon for him. The two-seam is Keuchel’s most commonly seen fastball, but it is not his only one. He actually throws a cutter to accompany his fastball. The cutter is his least thrown pitch of the repertoire, but he still throws it 10.8% of the time. What’s rare here is the two-seam and cutter combo, as Keuchel is one of only four starters that throws the two-seam at least 25% of the time and the cutter at least 10% of the time.

His cutter is quite effective too, as hitters have a .174 average against it. Similar to the two-seam, Keuchel has great command of the pitch. He knows where he wants to throw it and, usually, he puts it right there. The cutter isn’t quite the ground-ball pitch that the two-seam is, but rather Keuchel uses it jam righties inside. The cutter has the highest infield fly-ball rate (20.0%) of his four-pitch arsenal.

Next is Keuchel’s slider, which he throws 22.2% of the time. Hitters are slashing just .125/.143/.208. His slider is incredibly effective, but it is also different than most sliders. In terms of vertical and horizontal movement, below is your average slider from a lefty:

Blake Snell’s slider breaks down and in, but now look at Keuchel’s slider:

Keuchel’s slider has a ton of horizontal movement, but has almost no downward break. It averages only half an inch of vertical movement. His command of the pitch isn’t nearly as pretty as the fastballs, but that makes sense considering it’s a breaking ball.

Last not but not least, Keuchel’s changeup, which he throws 12.7% of the time. The pitch has limited hitters to just a .233 slugging in 2017. And, like with any of his other pitches, Keuchel throws it where he wants to. Keuchel also kind of has a four-seam fastball, but the pitch is used very rarely and isn’t really part of repertoire.

But back to why I’m writing this in the first place. If you look back at the heat maps for all of Keuchel’s pitches, it’s pretty clear that, aside for elevating his changeup on occasion, Keuchel keeps everything low. All of his pitches consistently land across one plane at the bottom of the strike zone, covering every part of the plate from left to right. When you consider his slider is what it is, Keuchel essentially doesn’t have a true breaking ball. Why this is so odd is because every one of his pitches, in terms of vertical movement, moves in a straight line and lands in the same place every time.

However, every one of his pitches is moving side to side, so Keuchel never gives you anything straight up. They are always going to be cutting or fading. But Keuchel throws all of his pitches relatively slow, so they are not easy to discern based off velocity. If you combine that with the fact that all of his pitches are landing across the same plane and not breaking, it makes it incredibly hard to recognize his pitches.

Just to make it even harder on hitters, here is Keuchel’s pitch mix by count. It’s always going to be a heavy dose of two-seam fastballs, but any of his secondary pitches can be thrown at any time.

So, Keuchel can throw you four different pitches, that all look similar, at any time he wants and exactly where he wants to throw them. That sounds like a recipe for success. Keuchel’s pitch mix may be different, but it is about as effective as anybody’s. Despite extremely limited velocity and stuff, Keuchel remains one of the top pitchers in the game because his command and ability to mix pitches is truly beautiful.


Ichiro Might Have Been Able to Be a Power Hitter

Earlier this month, Eno Sarris posted an article called “Could Ichiro Have Been a Power Hitter?,” which began with a launch angle and exit velocity analysis of Ichiro himself, and developed into a wider examination which led to the interesting proposition that “players may have their own ideal launch angles based on where their own exit velocity peaks.”  In this article, I’ll look at a larger sample of players whose fly-ball rates increased from 2015 to 2016 and see if their peak exit velocity range changed or stayed constant.  First I’ll re-examine Elvis Andrus, then I’ll look at Jake Lamb, Xander Bogaerts and Salvador Perez.

Elvis Andrus

As mentioned by Eno, Andrus’ average launch angle went from 8.1 in 2015 to 8.6 in 2016, but his fly-ball rate actually decreased.  It seems like he started the change in 2015, but was only able to translate it into results (a 112 wRC+) in 2016.  Regardless, let’s look at the data again, and see what we can find.

Instead of just qualitatively looking at the distribution and giving an approximate range of maximum exit velocity, I split the data set into launch angle buckets, and found the bucket with the highest median exit velocity.  For example, if I set the bucket size at 5 degrees and applied it to Elvis Andrus in 2015, I got a range (-2°, 3°) (I’ll omit the degree symbol from now on).  If I set the size at 10 degrees, I got a range (-2, 8).  For the rest of the article, I’ll keep it set at a range of 5 degrees.

The peak range for Andrus’ 2016 was (-3, 2).

Using the method outlined, the peak range for 2015 was (-2, 3), and for 2016 it was (-3, 2), so Andrus’ peak exit velocity range did not change much from 2015 to 2016, just as Eno pointed out, and as we can see with the two years overlaid.

Jake Lamb

Comparing 2015 and 2016, Jake Lamb raised his average exit velocity from 89.7 to 91.3 MPH, and his fly-ball rate from 32.4% to 36.7%.  His adjustments were chronicled by August Fagerstrom during his breakout (http://www.fangraphs.com/blogs/jake-lambs-revamped-swing-made-him-an-all-star-snub/).

The peak 5 degree range for Jake Lamb’s 2015 was (3, 8).

The peak 5 degree range for Lamb’s 2016 was (15, 20)!

Unlike Andrus, Jake Lamb’s peak exit velocity range increased along with his launch angle distribution!  This seems to be the kind of effective swing change that players attempting to join the fly-ball revolution strive for.  Lamb managed to revamp his swing to not only elevate the ball more, but to hit the ball harder at high launch angles, and actually increase the angle at which he hit the ball the hardest.  However, as the next two cases show, this is far from a guaranteed outcome.

Salvador Perez

Perez’s peak 2015 range: (9, 14).

Perez’s peak 2016 range: (0, 5).

From 2015 to 2016, Perez increased his fly-ball rate from 37.4% to 47.1%, and increased his average exit velocity from 87.3 to 88.8 miles per hour.  He also increased his average launch angle from 13.7° to 19.1°.  But curiously, his peak exit velocity range actually went down from (9, 14) to (0, 5)!  When I saw this, I thought I’d have to change my methods, because it didn’t make sense to me at first.  But if you look at Perez’s exit velocity vs. launch angle graphs for 2015 and 2016, these ranges actually seem to qualitatively fit.  Somehow, the Royals backstop managed to hit the ball harder and higher, but become more effective at lower launch angles.  This could be a rising tide lifts all ships situation, whereby his swing adjustments let him hit tough low pitches hard at lower angles, or it could just be a sample size issue.  By splitting the data set into buckets, the sample size gets dangerously small, and prone to strange results.  But I think the results fit the picture, and either Sal Perez needed to hit more balls for us to get reliable results, or he just had a strange batted-ball distribution.  We have a similar, more extreme situation with Xander Bogaerts next.

Xander Bogaerts

Bogaerts’ peak 2015 range: (5, 10).

Bogaerts’ peak 2016 range: (-6, -1).

Bogaerts, like the other three players here, hit the ball harder in 2016 than in 2015.  He raised his fly-ball rate and his average launch angle, and was rewarded with a 113 wRC+, a slight improvement on his 109 wRC+ from 2015.  But his peak exit velocity range for 2016 was, like Perez, lower than in 2015.  Looking at his plots, it looks like he hit his ground balls harder in 2016, while not changing the exit velocity of his line drives and fly balls as significantly.  I’m not sure what else to say about Xander, other than that he’s kind of a weird player, as already noted by Dave Cameron (http://www.fangraphs.com/blogs/xander-bogaerts-is-a-very-weird-good-player/).

Summary

The following table summarizes the findings for each player.

Avg EV Fly Ball % Avg Launch Angle Peak EV range wRC+
2015 2016 2015 2016 2015 2016 2015 2016 2015 2016
Elvis Andrus 85.2 86.9 31.8% 28.5% 8.1 8.4 (-2, 3) (-3, 2) 78 112
Jake Lamb 89.7 91.3 32.4% 36.7% 11.4 10.4 (3, 8) (15, 20) 91 114
Salvador Perez 87.3 88.8 37.4% 47.1% 13.7 19.1 (9, 14) (0, 5) 86 88
Xander Bogaerts 87.6 88.8 25.8% 34.9% 6.6 11.3 (5, 10) (-6, -1) 109 113

It seems like Andrus improved by simply hitting the ball harder and staying within his peak exit velocity range of launch angles (which fits Eno’s hypothesis), whereas Jake Lamb improved by hitting the ball harder, raising his average launch angle, and shifting his peak exit velocity range (which runs contrary to Eno’s hypothesis).  Perez and Bogaerts didn’t really improve, and their Statcast data yielded some strange results, which suggests that this method is far from foolproof, and that there may have been better choices of players to investigate.

Many thanks to Eno for the inspiration for this article, and to Baseball Savant for all of the Statcast data.


Anthony Rizzo Has Changed, Man

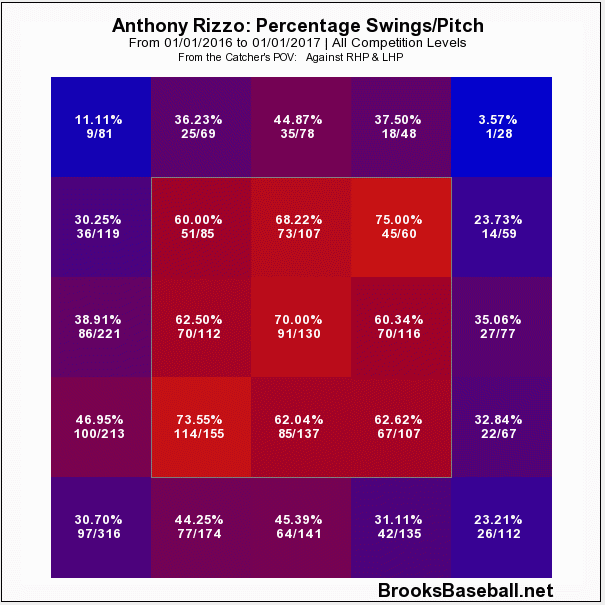
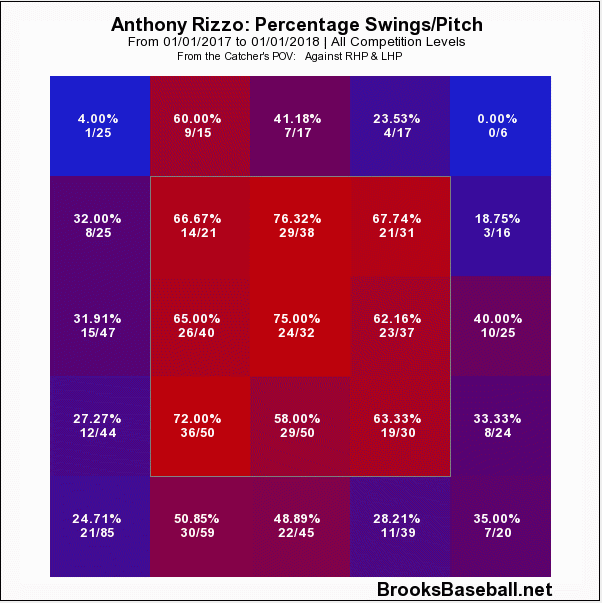
For the last three years, Anthony Rizzo has been one of the most consistent hitters in baseball. His wRC+ from 2014-2016: 155, 145, 145. His wOBA: .397, .384, .391. He consistently draws a walk in about 11% of his plate appearances and strikes out in less than 20% of his plate appearances. So far this year? It has been a much slower start, as he’s slashing .231/.371/.448. Though the OBP and SLG aren’t bad, the batting average is tougher to stomach. He’s been just above average with a wRC+ of 114, hardly the numbers the Cubs were expecting from their perennial All-Star. Still, there’s some explanation for all this. For comparison’s sake, we will only be looking at 2016 and 2017. Here’s some charts from Brooks Baseball:

There isn’t an obvious change in approach. He’s swinging at about the same amount of pitches and really is staying inside the zone. In 2017 it seems like he’s swinging more at the low and in pitches but otherwise, same approach. The stats from Baseball Info Solutions and PITCHf/x back this up. He’s in line with his career swing% by both metrics; the difference is in the contact he’s making. By Baseball Info, his O-Contact% is 71.1% up from 68.1%. PITCHf/x also has him at 71.1% up from 66.1%.

This makes me think the quality of the contact is the issue. Here are two videos showing at bats in 2017 and 2016. The focus here is what Rizzo is doing with outside pitches. First 2016, then 2017:

https://baseballsavant.mlb.com/videos?video_id=730449083

https://baseballsavant.mlb.com/videos?video_id=1383639883

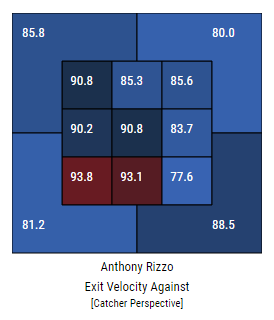
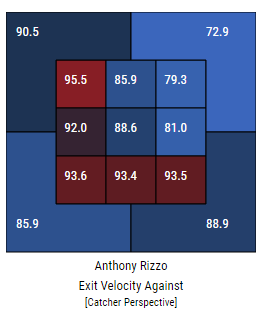
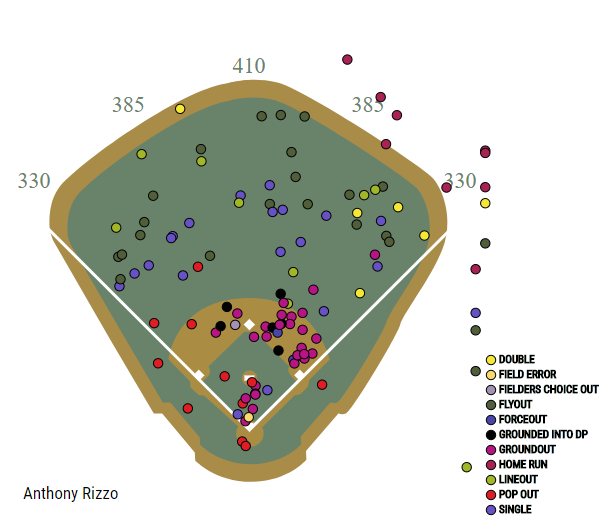
In 2016, Rizzo lets that outside pitch get deep to poke it to left field. The 2017 version is early and rolls it over into a shift. Baseball Savant has limited video for 2017 but I’ve seen the same thing and the numbers back it up. Here are two charts showing his exit velocities, 2016 is on the bottom, 2017 is on the top.


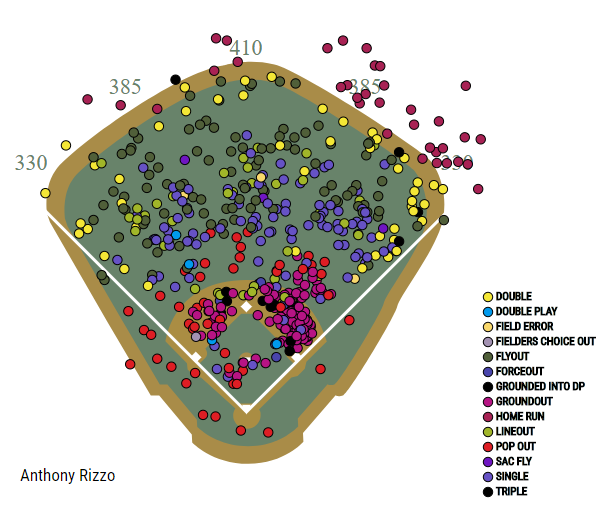
It would be easy to say Rizzo needs to do a better job going the other way with the outside pitch, but that’s the main difference I’m seeing this year. Overall, Rizzo’s hard contact is down to 30.4% from last year’s 34.3%, and from his career rate. His pull rate is also the highest in his career, at 53%, vs. 43.9%. Rizzo has been pulling a decent amount of grounders, specifically at a rate of 68.1% with about 78.2% being characterized as soft or medium contact, higher than in 2016. Rizzo faces a shift quite a bit, so pulling grounders isn’t going to help him. He’s hitting line drives at the lowest rate since he was first called up, and down to 15% from his career 20% rate. Take a look at the spray charts below. The first chart is 2017 and the second is 2016. It’s the classic small sample vs. large sample but you can definitely see that Rizzo is not using all fields like he has in the past.


This what confounds me. Despite all this, he still is producing better than average, because his walk rate and strikeout rate are the best rates of his career. So just imagine if his BABIP currently wasn’t .212? I don’t want to say that’s going to raise for sure, but I believe it will get closer to his career rate of .285. This is probably a long-winded way of saying small sample size, so here’s one last thing. This has happened with Rizzo before. In 2016 he had a similar start in March through May, but turned it on for the rest of the year.

Still, this isn’t a simple “It’s been 50 games and he’s been unlucky” that would imply that he’s the same player doing the same things but getting different results. The concern I have is that Rizzo’s doing things differently this year. He’s not using all fields, and he’s hurting his performance by trying to pull pitches and generating weaker contact (his EV is down this year). Using all fields might lead to more line drives and would drive his batting average up to his career norms. Maybe he’s putting pressure on himself after last year’s championship? He’s had success before and I believe he can get back to where he was.


Kris Bryant’s Wacky 2017

The Chicago Cubs have been immensely disappointing in 2017, not quite living up to the dynastic expectations that were forced upon them. Kyle Schwarber is struggling (if you haven’t heard that, I don’t know where you have been). Addison Russell is struggling. The pitching rotation is struggling. Star third baseman Kris Bryant, however, has managed to avoid being dragged down with the rest of the team.

In his MVP season last year, Bryant put up a .402 wOBA and a 149 wRC+, ranking 8th and 9th in the league, respectively. Through 50 games in 2017, he has posted a .402 wOBA and a 147 wRC+. The results are almost identical, but the two ways they have been achieved are not quite as similar.

40.3% of Bryant’s contact was considered hard in 2016, good for 13th in the league. But visit the Statcast exit velocity leaderboard for 2017, and you won’t be seeing Bryant anywhere near the top. Bryant’s Hard% is down all the way to 29.6% in 2017 and his average exit velocity of 86.21 mph this year is actually worse than the MLB Average 87.83 mph. The wOBAs for each season are the same, but the xwOBAs tell a much different story. Bryant was a bit lucky in 2016, as his xwOBA of .383 indicated a performance a little worse than his numbers. But it did not change the fact that Bryant still put up an MVP season, and it doesn’t look as worse if you consider Wrigley Field had a park factor of 90.2 in 2016. This year, Bryant’s .349 xwOBA pales in comparison to the .402 wOBA, especially with Wrigley’s 110.2 park factor this year. Bryant, unlike other Cubs, has managed to dodge the criticism this year with the help of a whole lot of luck.

The 2016 and 2017 launch angles are quite similar, so a change in swing path likely isn’t causing the weaker contact. And with the 2016 Bryant put up, one would hardly expect that he was quick to adjust his swing. The change is strange, but there may be an explanation.

Like with most power guys, Bryant was a heavy pull hitter in 2016, hitting 46.7% of his balls to left field. That number has taken a massive drop to 38.7% this season. Balls in play are likely to find more gaps if they are sprayed all over the field, but that still cannot come close to accounting for the difference in Bryant’s xwOBA and wOBA. Hand in hand with that, his contact rates have gone up. He is connecting on 65.3% of his swings on pitches outside the zone, up from 59.8% last year. His swinging strike rate is down from 13.0% to an impressive 9.7%. Perhaps Bryant, like Giancarlo Stanton also recently did, decided to give up some power for a more balanced plate approach.

The problem, though, is that Bryant hasn’t altered his strikeout rates. His K% is only down to 20.5% this year from 22.0% last year. Bryant is chasing less, though, lowering his O-Swing% from 30.8% to 28.6%. He is chasing less now, and even when he is chasing, he is making more contact. He’s also making a whole lot more contact in general. Those should add up to fewer strikeouts, but, oddly, they aren’t. Again, there may be an explanation. Bryant is still whiffing a whole lot with two strikes, as his swinging strike with two strikes with rate is still at 24.5%, compared to last year’s 26.8% mark. You can’t strike out without two strikes, so even if he is whiffing less with one or zero strikes, he’s not making more contact when there is an actual punch-out opportunity.

If you are going to refine your plate approach and lose some of the aggressive hacks, you need to strike out less, as Stanton did. Guys like (younger) Stanton have to offset lots of misses by doing something with the ball on the times they don’t miss.

But there is one thing that has really confused me. Why is a former MVP giving up the approach that got him the award? Everyone can and should make adjustments to get better, even Mike Trout, but it is odd to see Bryant stray this far from what he did last year.

There is some good news, though. Bryant is posting a 15.5% walk rate, ranking 11th in the league. His Zone% has actually slightly increased from this year to last, so perhaps Bryant’s improved eye is forcing pitchers to attack him in the zone. Or maybe they are catching on to his weak contact.

Overall, this has been a weird season for Bryant and the Cubs. The Cubs are loudly scuffling, while Bryant is quietly putting together a mysterious season. He won the MVP in 2016, but then seemingly decided to make big adjustments to his plate approach. His new approach isn’t working, but his production isn’t falling. I honestly don’t know what to make of this right now, and maybe no conclusions need to be drawn at this time. But one thing that can be taken away is that we should start monitoring Bryant a little more closely.


The Reinvention of a Yankee You Aren’t Hearing About

gary-sanchez-aaron-judge-14.0.jpg

“Funny things happen in baseball” was what one former major-league GM had to say regarding the Yankees’ unexpected success thus far. 2017 was supposed to be a rebuilding year for this club, but after winning 30 games before the end of May, the Bronx Bombers have established themselves as one of the best teams in baseball. As Henry Druschel writes, the Yankees are not only good, but fun!

Baseball is a team game, so it’s impossible to give credit to one or even a few players. But in a season that was supposed to be focused on the development of prospects — Judge, Bird, and Sanchez — it has become impossible to ignore the surprising production from some of the established veterans on the team. Starlin Castro is having the best season of his career. Jacoby Ellsbury is having more success in a Yankee uniform than ever before. And Matt Holliday is on pace to produce the highest power numbers of his career since he played 81 games a year at hitter-friendly Coors Field.

All of these players deserve credit for the early success of this team. But one player who has not received enough praise, especially after reinventing himself, is Brett Gardner.

For years, Gardner was nothing more than a slap hitter. He would get on base at a decent clip, where he was a real threat, stealing almost 100 bases between 2010 and 2011. He was never, by any stretch of the imagination, a power hitter — in the first five years of his career, his ISO never topped .110. And that was okay. By many accounts, he was a good player. Not great, but good enough to average almost 5 WAR from 2010-2014.

Flash-forward to 2017 and Brett Gardner is a different hitter. Aaron Judge, the heir-apparent to Jeter’s throne in New York, commented on the 33 year-old leadoff hitter’s changed approach: “He’s a little ball of muscle. I’m just glad he’s finally using it now.” He sure is. There are clear trends in Gardner’s “medium” and “hard” contact numbers.

Hlp9BwD.0.png

Gardner is hitting with hard speed at a rate of 34.8%, markedly higher than his career average of 23.6%. His medium-speed percentage is 10 points lower than it has been at almost any point in the last three years. And his soft-speed percentage is also below his career average. His approach has changed.

Notably, Gardner is not clenching his teeth and swinging for the fences a la Chris Davis or Chris Carter. His walk rate and strikeout rate are both in line with his career averages. He’s not chasing balls out of the zone, either.

uupSxGq.0.png

Almost a third of the way through the season, Gardner is more disciplined now than in the past. His O-Swing% is in the top 10 with players like Joey Votto (who has stopped striking out) and Matt Carpenter, who is tied for first in non-intentional walks drawn.

With this new approach, Gardner is hitting for more power than ever before.

TYVPd1h.0.png

As you can see, his average has remained relatively constant. In other words, his slugging percentage didn’t skyrocket because he started to hit a bunch of singles. Gardner really is driving the ball, leading to more extra-base hits. As a result, his isolated power numbers have risen dramatically. Isolated power (ISO) shows how often a player hits for extra bases.

7EcLSdx.0.png

For just the second time in his career, Gardner’s ISO has risen above the league average. And in 2017, his numbers put him in the same ballpark as Kris Bryant and Giancarlo Stanton.

During a period where the Yankees have gone from rebuilding to contending, Brett Gardner has evolved from a slap hitter into someone who drives the ball remarkably well. Aaron Judge is having a tremendous season, and with Trout’s injury he may well be the AL MVP.

But Gardner’s transformation shouldn’t go unnoticed. His ISO won’t stay at .259 all year. In fact, with only 200 plate appearances, this number doesn’t have much predictive value on its own. It’s clear, however, that Gardner has changed his approach. He is no longer the speedy, slap-hitting leadoff guy expected to steal 30 bases. Although Girardi still pencils him in at the top of the lineup, Gardner has reinvented himself to hit for power.


Matt Moore and the Terrible Schedule

Not much has gone right for the San Francisco Giants in 2017. Everyone knows about the dirt bike accident and the consistent inconsistency that they call a bullpen. However, the 2017 struggles of Matt Moore have largely flown unnoticed, probably because of all the other issues facing the team. To say that Matt Moore has underperformed the Giants’ expectations since they traded Matt Duffy for him last summer feels like an understatement. To this point in the year Moore has amassed an inflated 5.28 ERA with a 1.53 WHIP. He is on one of the statistically worst offenses in the league and is currently getting out-pitched by both Matt Cain and Ty Blach.

Next comes the point of the story where FanGraphs authors write about how the underlying numbers show that Matt Moore is actually closer to Carlos Carrasco than Adam Conley. They entertain you with tales of a .400+ BABIP and a <60% strand rate. They serenade you with increased velocity and changes in spin rate.

Except I can’t do any of that. Moore has pretty much been just as bad as his stats show. He has the highest qualified walk rate and the lowest qualified strikeout rate of his career. His hard-hit rate sits at 40.6%, good for seventh-worst in the league (out of 91 qualified starters). His team currently sits 11 games out of the division lead, doesn’t provide sufficient run support, and could be in complete sell mode by the end of June.

This raises the question, why would anyone want to spend hours researching and writing about such an underwhelming pitcher? Giants fans certainly don’t enjoy the self-inflicted pain that Moore causes each time he pitches. However, there is something interesting when examining the Giants schedule from the start of the season through the end of May.

Screen Shot 2017-05-26 at 11.37.36 PM

This is about what you would expect for the Giants. Very heavy against the NL West to start the year, while beginning to adventure outside of the division as they work their way through May. Look at what happens when highlighting the series that Moore has pitched or is scheduled to pitch in (green) vs. the ones that he hasn’t (red).

Screen Shot 2017-05-26 at 11.41.14 PM

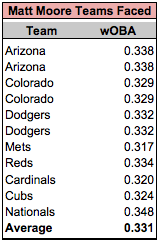
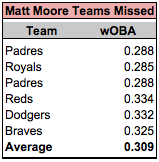
At first glance, it seems like Moore has pitched against better offenses or hitter-friendly ballparks (ARI, COL, LAD, CHC, WAS) while missing entire series against weaker offenses in pitcher-friendly stadiums (SD, KC). To see if this claim is actually supported, I used wOBA as a proxy for opponent offensive firepower to weigh each of the opponents.

Screen Shot 2017-05-26 at 11.57.41 PM

Screen Shot 2017-05-26 at 11.57.23 PM
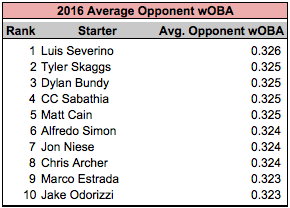
The average wOBA for teams that Moore has faced is .331 while the average wOBA for the teams he has missed is .309. A difference in wOBA of .022 is the exact difference between the wOBA of the 2017 Cubs and 2017 Pirates. The team with the wOBA closest to .331 so far in 2017 is the Dodgers, meaning that on average Moore has faced the Dodgers caliber of offense in each start throughout the season. The team with the wOBA closest to .309 is a mix between the White Sox and the Phillies, two weaker offenses. This doesn’t even take into account that Moore isn’t allowed to face the team with the lowest wOBA due to pitching for them. To obtain some historical context, I compared Moore’s .331 average opponent wOBA against all 2016 starters (min. 10 starts).

Screen Shot 2017-05-27 at 12.19.56 AM

Out of all starters with 10 starts in 2016 (185 total pitchers), Moore’s current average opponent wOBA would rank as the highest. Even the .005 difference in wOBA between 2017 Moore and 2016 Severino is a significant margin (the exact difference between the 2017 Rockies and 2017 Rays). Let’s look at how the .309 wOBA of the matchups Moore has missed would rank out of the 2016 starters.

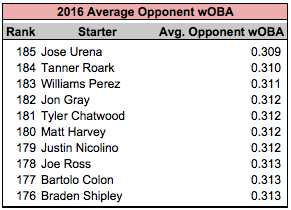
Screen Shot 2017-05-27 at 12.26.52 AM

Weighing all of the starts that Moore has missed, he would have been tied for the easiest average opponent wOBA of 2016. The difference between the offensive caliber of the teams that Moore has and hasn’t faced on the Giants schedule is not only steep; it’s the difference between the toughest and easiest pitcher schedules of 2016.

To be clear, none of this is suggesting that Matt Moore is or will be a good pitcher this season. In fact, the signs of a good pitcher is one who can toe the rubber against even the toughest teams. However, Moore’s schedule has not provided any favors. Before the Giants and their fans pass judgement on Moore, they should take a close look at who Moore has (and hasn’t) faced. Moore’s next assignment? The Washington Nationals on Monday. (Ed. note: that was Memorial Day)


Statistical Analysis of a Few College Hitters

As the 2017 MLB Draft quickly approaches, I thought it may be fun to analyze some of the best college hitters available.  On May 23, Eric Longenhagen released the 2017 Sortable Draft Board on FanGraphs.  This article looks at the statistics of each college hitter on the list.  In this article, I tried to not lean on literature and scouting reports of the players.  Rather, I decided to calculate some statistics to use as guides in building an outsider’s perspective of their offensive profiles.  This body of work does not include much information about attributes or skills not published on a school’s statistics page on their website.

Nobody real cares about the counting statistics of college players.  So, for my table of numbers to fit on a page, I left them out.  The statistics I focused on are a hitter’s slash line (AVG, OBP, and SLG), OPS, BABIP, ISO, RC, K% and BB%.  These are relatively easy to calculate and provide some sort of worth when evaluating prospects.  AVG, OBP, and SLG are simple and widely understood.  OPS provides a good gauge of a hitter’s overall offensive ability.  BABIP is an important indicator of a hitter’s talent at the plate, but can be inflated or deflated depending on the talent level of the different defenses faced by the hitter.  ISO is a good indicator of how well each hitter demonstrated their power and XBH ability.  Runs Created (RC) is a crude but effective measurement of total, individual offensive output.  K% and BB% give us some idea of how well the batter demonstrated their understanding of the strike zone and discipline at the plate.  For more information on each statistic, as well as how to apply it, I suggest checking out the Glossary tab.

Below is the table of numbers I made.  Even further below is where you will find a quick summation of each hitter discussed.

Name

AVG OBP SLG OPS BABIP ISO RC K%

BB%

Jeren Kendall

.306 .379 .570 .949 .333 .264 50.31 18.9%

20.8%

Adam Haseley

.400 .498 .688 1.186 .393 .288 70.21 7.7%

38.8%

Keston Hiura

.419 .556 .672 1.228 .486 .253 67.80 14.5%

40.3%

Pavin Smith

.348 .433 .581 1.013 .311 .233 53.78 3.2%

42.7%

Logan Warmoth

.336 .410 .562 .972 .374 .226 53.10 15.3%

20.8%

Jake Burger

.343 .459 .686 1.145 .319 .343 63.50 12.0%

35.1%

Evan White

.380 .454 .654 1.108 .414 .274 51.08 13.5%

17.3%

Brian Miller

.336

.412 .504 .917 .365 .168 49.78 11.7%

28.1%


Jeren Kendall (#9 on FanGraphs Sortable Draft Board)

Vanderbilt                   OF                   (B- L/ T- R)

Jeren Kendall is considered by many to be the best college hitter, outside of Louisville two-way player Brendan McKay.  Kendall showed some impressive pop out of center field this past year, knocking 15 balls over the fence in 235 at bats.  However, he also managed to record 50 strikeouts.  Kendall did manage to produce an excellent walk rate and ISO, but his total output was “middle of the pack” as far as the guys on this list go.  He should go off the board within the first 20 picks this upcoming draft.

Adam Haseley (#15 on FanGraphs Sortable Draft Board)

Virginia                       OF                   (L/L)

Hitting from the left side of the plate, Virginia outfielder Adam Haseley managed to put up the best statistical profile of any hitter on this list.  He comes into June’s draft with an impressive OPS (1.186) and an even more entertaining strikeout rate — a board-best 7.7% (only 19 punch outs in 205 ABs).  While Haseley’s power numbers may not translate at the next level, his affinity for driving the ball into deeper parts of the ballpark should make for a high doubles count at the next level.

Keston Hiura (#17 on FanGraphs Sortable Draft Board)

UC Irvine                     2B                    (R/R)

While Keston Hiura’s .486 BABIP may be a good indicator as to why his batting average is north of .400, it is also a good indicator of just how good he is with a bat in his hand.  He did not just hit singles — his 21 doubles come in second on the list.  He displayed an excellent walk rate, which contributed to the highest on base percentage on the shortlist.  While some teams may elect to take a prep shortstop over a college second baseman, Hiura still plays a premium position with solid presence at the plate and would fit in nicely in any class as a second to third-round pick.

Pavin Smith (#18 on FanGraphs Sortable Draft Board)

Virginia                       1B                    (L/L)

The second UVA Cavalier on our list slashed an impressive .348/.433/.581 this past season, and posted an impressive 3.2% strikeout rate.  While his numbers do not match those of his teammate Adam Haseley, Pavin Smith could very well be the first college first baseman off the board, assuming you do not count Brendan McKay as a first baseman.  His demonstrated knowledge of the strike zone, coupled with a list-best walk rate, are both very good indicators of a first baseman with a high ceiling.

Logan Warmoth (#20 on FanGraphs Sortable Draft Board)

North Carolina            SS                    (R/R)

Tar Heel shortstop Logan Warmoth, when compared to the rest of this list, does not really stand out.  However, he should be taken early, as he still has the best odds of being the first college shortstop off the board.  He hit well in the ACC this past season, compiling 18 doubles, 4 triples, and 9 home runs.  Though his demonstrated power will likely not follow him up the minors, any team would love to have a strong bat such as his at the most premium of all premium positions.

Jake Burger (#22 on FanGraphs Sortable Draft Board)

Missouri State            3B                    (R/R)

Our only hot corner prospect on the list is a power threat through and through, according to his numbers.  While his average will continually drop as he climbs the minors, Burger’s 20 homers showcased his raw power.  Although there may be some questions about his tendency to punch out, plus power paired with an excellent walk rate at a corner position are a recipe for success.  Everybody loves a little yak sauce on their Burger every now and then.

Evan White (#29 on FanGraphs Sortable Draft Board)

Kentucky                      1B                    (R/L)

A first baseman who hits from the right side is very common.  A First Baseman who hits from the right side but throws left is very uncommon.  A first baseman who hits from the right side but throws left with plus speed is downright unique.   Evan White legged out a list leading 23 doubles this past year, and posted all-around great offensive numbers.  He will be a very interesting draft choice, and his excellent statistics project a demonstrate a solid offensive background.

Brian Miller (#49 on FanGraphs Sortable Draft Board)

North Carolina            OF                   (L/R)

Rounding out our list is North Carolina outfielder Brian Miller.  Miller slashed a very impressive .336/.412/.504 line this past year, and should be a good mid-grade prospect in the upcoming draft.  His statistics do not lean to one type of offensive profile over another, but his high BABIP and excellent walk rate generate some reasons to believe his bat will continue to develop at the next level.

Again, this article is meant to simply provide a statistical overview of a few college prospects in the upcoming draft.  It should be looked at as a tool for anybody who cares enough to concern themselves with college statistics.


Theodore Hooper is an undergraduate student at the University of Tennessee in Knoxville.  He can be found on LinkedIn at https://www.linkedin.com/in/theodore-hooper/ or on Twitter at @_superhooper_


Fastball Confidence a Focal Point for Harvey

To express the extent of a player’s confidence is difficult, and using numbers to back up this assertion is even harder. When a player lacks confidence, it can be seen through a slew of on-field mannerisms that don’t always present themselves inside statistics. Instead, the numbers tell us the story of a pitcher, once of dominant form, who is struggling to get outs and display any sort of consistent performance. The statistics paint this picture about Matt Harvey. They tell us a tale of dominance, hindered and erased by injury and ineffectiveness. Although this story is told, it seems to be far from the truth. I believe in an alternate story. A story that displays a human being struggling with the confidence to throw his pitches and retire hitters. A lack of confidence stemming from a large set of off-field hindrances and a set of recent on-field struggles. A problem that will be moved past and put behind in the months to come, making it only a distant memory to both Matt and Met fans.

If we rewind back to September of 2015, we can see that Harvey is no stranger to hardships or headlines. After Tommy John surgery following his stellar 2013 campaign, he seemed back to form throughout 2015, culminating in an impeccable playoff start against the Cubs and a World Series game 1 nod. Throughout the season, questions about Harvey’s innings limit hovered around the Mets clubhouse, reaching its climax in early September. After a start against the Philadelphia Phillies where Harvey exited early due to dehydration, agent Scott Boras spoke about the doctor’s indication that Matt should not exceed 180 innings pitched that season. With Matt already at 166 1/3 innings, it seemed like the Mets organization was directly ignoring these suggestions.

This back and forth between the front office and Boras propelled Matt into the spotlight preceding his next start against Washington, who had become their rival in the midst of a pennant race. He pitched poorly, to the tune of 7 R (4 ER) in only 5 1/3 innings. This tough outing doesn’t hold a torch to his current struggles, but the difference in approach between this start and his recent starts form an interesting comparison.

Throughout this start in particular, and the entirety of the 2015 season, Matt Harvey was unafraid to throw his fastball to any hitter. He challenged hitters like Bryce Harper, in the midst of an MVP season, with fastball after fastball. In Harvey’s most recent start, he wouldn’t even challenge Manuel Margot with the same. Of his 74 pitches in that 2015 start, he threw 51 fastballs 95 and above, constantly pounding the zone. In his most recent start, Harvey nibbled around corners, he never challenged hitters, and he relied on his breaking ball (usually out of the zone) even when behind in the count. This tendency showed a lack of confidence to throw his fastball and challenge hitters, something that Harvey needs desperately to be successful. Overall, the dichotomy in approach between 2015 and 2017 for Matt is striking. Here are some of the numbers based on his position in the count:

2015, 2017
AHEAD
CU, CH: 22.3%, 19.7%
SL: 15.5%, 23.4%
FA, FT: 62.2%, 56.9%
BEHIND
CU, CH: 19.0%, 25.3%
SL: 16.5%, 21.7%
FA, FT: 64.6%, 53.0%
TOTALS
AHEAD% 32.6%, 20.8%
BEHIND% 20.8%, 25.9%

In 2015, when ahead in the count, Matt threw 62.2% fastballs. When behind, he threw even more, to the tune of 64.6% of the time. Because of his ability to pound the zone with his fastball, he spent 32.6% of his time ahead in the count while only 20.7% behind. This allowed him to control the pace of the at-bat and the expectations of the hitter. When he wanted to break off a curveball or a slider it became much more effective in relationship to his established fastball.

So far in 2017, he’s been unable to get ahead in the count or develop any rhythm with the pitch. His inability to challenge hitters has left him nibbling around the plate, leaving him ahead in the count only 20.7% of the time. This problem grows when behind in the count, as Harvey continues to throw off-speed pitches 47% of the time. His inability to command these pitches leads to even worse counts, and compounds the problem. Throughout his most recent start again San Diego, Harvey continued to nibble around the corners of the zone, seemingly afraid to challenge hitters with his fastball or throw off-speed pitches consistently in the zone.

This tendency, pointed out by Ron Darling during the SNY Broadcast, can be evidenced by his complete change in pitch usage as shown above. Although diminishing fastball usage is occurring league round, Harvey has to use his fastball more consistently to be more effective this season. By establishing his fastball early, he can play off of it, creating more effective offspeed pitches as well as more powerful fastballs. To be a Cy Young caliber pitcher, you have to trust your stuff and believe in your ability to dominate. As of now, Matt doesn’t believe in either.