Matt Moore and the Terrible Schedule
Not much has gone right for the San Francisco Giants in 2017. Everyone knows about the dirt bike accident and the consistent inconsistency that they call a bullpen. However, the 2017 struggles of Matt Moore have largely flown unnoticed, probably because of all the other issues facing the team. To say that Matt Moore has underperformed the Giants’ expectations since they traded Matt Duffy for him last summer feels like an understatement. To this point in the year Moore has amassed an inflated 5.28 ERA with a 1.53 WHIP. He is on one of the statistically worst offenses in the league and is currently getting out-pitched by both Matt Cain and Ty Blach.
Next comes the point of the story where FanGraphs authors write about how the underlying numbers show that Matt Moore is actually closer to Carlos Carrasco than Adam Conley. They entertain you with tales of a .400+ BABIP and a <60% strand rate. They serenade you with increased velocity and changes in spin rate.
Except I can’t do any of that. Moore has pretty much been just as bad as his stats show. He has the highest qualified walk rate and the lowest qualified strikeout rate of his career. His hard-hit rate sits at 40.6%, good for seventh-worst in the league (out of 91 qualified starters). His team currently sits 11 games out of the division lead, doesn’t provide sufficient run support, and could be in complete sell mode by the end of June.
This raises the question, why would anyone want to spend hours researching and writing about such an underwhelming pitcher? Giants fans certainly don’t enjoy the self-inflicted pain that Moore causes each time he pitches. However, there is something interesting when examining the Giants schedule from the start of the season through the end of May.
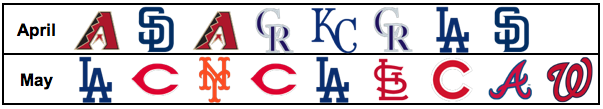
This is about what you would expect for the Giants. Very heavy against the NL West to start the year, while beginning to adventure outside of the division as they work their way through May. Look at what happens when highlighting the series that Moore has pitched or is scheduled to pitch in (green) vs. the ones that he hasn’t (red).
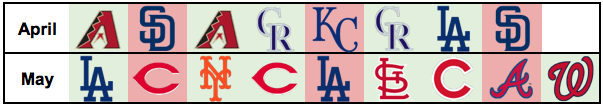
At first glance, it seems like Moore has pitched against better offenses or hitter-friendly ballparks (ARI, COL, LAD, CHC, WAS) while missing entire series against weaker offenses in pitcher-friendly stadiums (SD, KC). To see if this claim is actually supported, I used wOBA as a proxy for opponent offensive firepower to weigh each of the opponents.
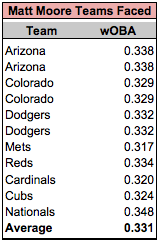
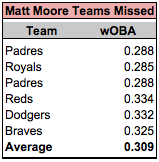
The average wOBA for teams that Moore has faced is .331 while the average wOBA for the teams he has missed is .309. A difference in wOBA of .022 is the exact difference between the wOBA of the 2017 Cubs and 2017 Pirates. The team with the wOBA closest to .331 so far in 2017 is the Dodgers, meaning that on average Moore has faced the Dodgers caliber of offense in each start throughout the season. The team with the wOBA closest to .309 is a mix between the White Sox and the Phillies, two weaker offenses. This doesn’t even take into account that Moore isn’t allowed to face the team with the lowest wOBA due to pitching for them. To obtain some historical context, I compared Moore’s .331 average opponent wOBA against all 2016 starters (min. 10 starts).
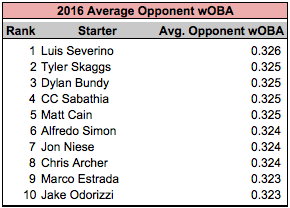
Out of all starters with 10 starts in 2016 (185 total pitchers), Moore’s current average opponent wOBA would rank as the highest. Even the .005 difference in wOBA between 2017 Moore and 2016 Severino is a significant margin (the exact difference between the 2017 Rockies and 2017 Rays). Let’s look at how the .309 wOBA of the matchups Moore has missed would rank out of the 2016 starters.
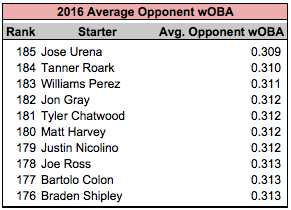
Weighing all of the starts that Moore has missed, he would have been tied for the easiest average opponent wOBA of 2016. The difference between the offensive caliber of the teams that Moore has and hasn’t faced on the Giants schedule is not only steep; it’s the difference between the toughest and easiest pitcher schedules of 2016.
To be clear, none of this is suggesting that Matt Moore is or will be a good pitcher this season. In fact, the signs of a good pitcher is one who can toe the rubber against even the toughest teams. However, Moore’s schedule has not provided any favors. Before the Giants and their fans pass judgement on Moore, they should take a close look at who Moore has (and hasn’t) faced. Moore’s next assignment? The Washington Nationals on Monday. (Ed. note: that was Memorial Day)
Great post! I’ve been wondering about Moore. It seems his excellent stuff has never produced the results one would expect. While the tough schedule certainly has played a role, it’s worth noting that his struggles are also in part due to the Giants upping his cutter (a pitch that has a -3.4 pVal this year and a mere 6% swinging strike rate) usage by a ton (from 4.4% last year to 27.2% this year). He has also pitched much better at home this year–4.04 FIP at home, 5.64 FIP away, so maybe there is a glimmer of hope there.
Thanks! The strikeouts that he was able to collect in the minors certainly never translated. Agree about the cutter and his inability to pitch on the road. Interesting that he has pitched for two teams that seem to be big on promoting entire rotation philosophies (Giants using a cutter, Rays using high fastballs).
Thanks for this. Do you have the full list posted somewhere?
Perhaps even more interesting would be wOBA+ faced last year vs. this year (for pitchers who are on the same team).
No list that I have published anywhere. I can look into trying to hosting it somewhere.
I also wanted to compare his wOBA to all pitchers in 2017, but was unable to find raw data for all game logs for this year. Had to resort to only using 2016 data. If you do know where to find this data, it would be great if you could send it over this way and I can take a look.
I did a quick ‘n’ dirty look at ’16 vs ’17 OPS-against for SPs with 80+ IP in 2016 and 40+ IP this season:
Source was BP’s Quality of Opposing Hitters report. The problem is I am not sure if they are using point in time OPS or end-of-season OPS for batters faced.
Anyway, the list I made shows the most favorable change from last year to this year in terms of ease of schedule. Luckier picthers this season have negative, green-shaded numbers, and vice versa in red. I.e., Kershaw has faced a much easier schedule this season than he did last year, which was already quite easy btw. Also, poor Ubaldo.
The last column is the estimated impact on ERA the schedule difference should cause.
Also, I made an adjustment that assumes the offensive environment is 10 pts of OPS higher this season vs. last season. So a listed change of “zero” is actually a raw change of +10.
This is a great post! Certainly doesn’t help that he’s on a team that is mediocre at best.
Thank you! Definitely not looking good in the bay area so far this year.