Archive for Lineups

Confounding: Are the Rockies Rebuilding?

In the 2014 Hardball Times Baseball Annual, Jeff Moore analyzes six teams undergoing some form of “rebuilding.” He correctly notes that the concept has become a platitude in sports media, but that it still has explanatory value. In order to highlight the utility of “rebuilding,” he parses the concept to represent different forms of practice implemented by a variety of organizations. Moore covers the “ignorance” of the Philadelphia Phillies who continue on as if their core of players wasn’t aging and Ryan Howard was ever a reliable contributor; the “recognition” of the New York Mets that they have to be patient for one or two more years before the pieces come together and, they hope, work as well as Matt Harvey’s new elbow should; the “overhauling” of the Houston Astros evident in their fecund farm system and arid big league squad; the “perpetual” rebuilding of the Miami Marlins in a different key from anyone else, most recently using the public extortion and fire sale method; the Kansas City Royals’ “deviation” by trading long-term potential for a short-term possibility; and the “competition” exemplified by the 2013 Pittsburgh Pirates as they seemingly put everything together in 2013, though it remains to be seen whether or not they will need to rebuild again sooner rather than later.

Although the Colorado Rockies are not on Moore’s radar, I think they fall into an altogether different category. They appear to be in a confoundingly stagnant state of non-rebuilding. The mode of rebuilding can be as stigmatizing as it is clichéd, and it is as if the Rockies are avoiding the appellation at the cost of the foresight it might bring. Or, I don’t know what the hell is going on, and I’m not convinced there is a clear plan.

That might sound unfair. But if we, like Moore, take the definition of rebuilding to essentially mean identifying a future window of opportunity and working towards fielding a competitive team to maximize that opportunity, but with the acceptance of present limitations, then I don’t think I’m far off. General Manager Dan O’Dowd is, inexplicably, the fourth-longest tenured general manager in all of baseball, despite overseeing just four winning clubs in 14 full seasons. The only GMs who have held their current job longer are the dissimilarly successful Brian Sabean of the San Francisco Giants, Brian Cashman of the New York Yankees, and Billy Beane of the Oakland Athletics. The possible moves that have been rumored suggest that Dan O’Dowd and de facto co-GM Bill Geivett are frozen by anything more than a one-year plan.

Let’s look at some of the possible moves that are garnering notice. Beat writer Troy Renck reports that the Rockies are eying first baseman Justin Morneau to replace the retired Todd Helton. Of all of the speculative deals, this one is most likely to happen. But what would this accomplish in the short and long-term? In the short term, it would provide a replacement for Todd Helton and possibly provide a bridge for either Wilin Rosario or prospect Kyle Parker to take over full-time at first. The long-term effects are not as easy to identify, as his contract probably wouldn’t exceed two years.

It might sound just fine, until you realize that Morneau would be a “replacement” in more than one sense. Per FanGraphs’ Wins Above Replacement (WAR), Morneau hasn’t accrued an average major-league season since the half-season he played in 2010. Hayden Kane over at Rox Pile notes that he slashed .345/.437/.618 before a concussion ended his 2010 season and most of the next, but those numbers were inflated by a .385 Batting Average on Balls in Play (BABIP), over .100 points higher than his career average. He was still well on his way to a successful season, but the effects the concussion had on his productivity cannot be overstated. Morneau accrued 4.9 war in the 81 games he played in 2010, and 0.4 since. Optimistically, if Morneau out-produces his projected line next year (.258/.330/.426, per Steamer projections), which he likely would do playing half of his games in Coors Field (except against lefties, who he can’t hit), he would at best be a league-average hitter to go along with his average defense. Sure, it would be an improvement from the lackluster production from first base in 2013, but not enough to build beyond current listlessness.

Fundamentally, I believe that the Rockies do need a bridge before easing Rosario into a defensive position where he is less of a liability or seeing what the team has in Parker. But they already have the link in Michael Cuddyer. While he’s unlikely to reproduce the career year he had in his age 34 season in 2013, having Cuddyer play out his contract sharing time at first seems to be the better allocation of resources in the short-term. In January of 2013, Paul Swydan characterized the Rockies as an organization on a “quest for mediocrity.” Signing Morneau would go a long way toward realizing that goal.

In addition to possible additions via free agency, trade rumors are aren’t helping to clarify where the team is. It has been rumored that the Rockies are interested in trading for Anaheim’s Mark Trumbo, which would also fill the hole at first base that I don’t think actually exists yet. Trumbo, a power hitter, is misleadingly tantalizing. As opposed to Morneau, Trumbo is at least on the right side of 30; similarly though, Trumbo doesn’t get on base enough to provide the offense the boost it needs, especially on the road. He’d be a virtual lock to hit 30+ home runs, but he would also be sure to have an OBP hovering around .300. It’s unclear who would be involved in such a deal, as the Angels wouldn’t be interested in the Rockies’ primary trading piece, Dexter Fowler.

Speaking of Fowler, he’s going to be traded. In an interview with Dave Krieger, O’Dowd said that the organization has given up on him. Not in those words of course—rather, he noted that Fowler lacks “edge,” which is a bullshit baseball “intangible” that doesn’t tell us anything about the player in question, but rather that the front office seeks amorphous traits that can only be identified retrospectively. Reports have the Rockies in talks with Kansas City that would result in the teams swapping Fowler for a couple of relievers, likely two of Aaron Crow, Tim Collins, and Wade Davis. This, too, would maintain organizational stagnation.

The Rockies are practicing a confounding type of non-rebuilding, wherein veterans are brought in not with the idea that they can be valuable role players (like Shane Victorino, Mike Napoli, and Stephen Drew were for the Boston Red Sox last off-season), but as immediate solutions to problems that should be viewed in the long-term. I’m not as pessimistic as I might sound. The Rockies finished in last place for the second straight season in 2013, but with just two fewer wins than the Padres as Giants, and a true-talent level of about a .500 team. The thing about teams with a win projection of about 80 is that they can reasonably be expected to finish with as much as 90 wins—and as few as 70. If the Rockies are competitive in 2014, it will likely be due to health and a lot of wins in close games. I do, however, think they can be competitive starting in 2015. That’s the rebuilding window of opportunity the team should be looking at. If they are, it won’t be because of who is playing first base or right field, or even an improvement in hitting on the road, but progress in the true source of their problems: run prevention.

Last year, only the Twins and the lowly Astros allowed more runs per game. Despite this, for the first time in a while Rockies’ fans can be optimistic about the engine of run prevention, quality starting pitching. This is an area where the team can build a clear agenda for the future. Tyler Chatwood and Jhoulys Chacin should be reliable starters for the next few years. It’s unclear how many good years Jorge de la Rosa has left in him, and it’s also unclear whether or not Juan Nicasio can be a legitimate starter. But the Rockies have two polished, nearly big-league-ready pitching prospects in Jonathan Gray and Eddie Butler—Rockies’ fans should be really excited about these two—so long as one of them is not one of the “young arms” rumored to be in play for Trumbo. If Gray and Butler can be shepherded to the big leagues in a timely manner and learn to pitch to major leaguers quickly, they could join Chatwood and Chacin for possibly the best rotations in Rockies history. And if the front office really wants to make a big free-agent splash, the answers aren’t in the Brian McCanns or Jose Abreus of the world, but in splitter-throwing, ground-ball inducing, 25-year-old starting pitcher Masahiro Tanaka. His presence would likely push a rotation in 2015-2016 and possibly beyond from dependable to exceptional. Of course, it won’t happen. The Rockies, if they bid, will be outbid, and it’s precisely starting pitchers in demand that tend to stay away from Colorado.

In a sense, every major-league team is always in some stage of rebuilding, whether they admit it or not. My point is that I think there can be power in the admission of it. De-stigmatizing the “rebuilding process” might contribute to the recognition that it’s not necessarily a multiyear process, and that being in the process is not an acknowledgement of failure. Recognition of this, which by itself should provide more foresight, should lead the organization and armchair observers like myself from a state of confusion due to the team’s pursuit of stagnation, to one of encouragement where progress can be visualized.


The Dodgers and Jacoby Ellsbury

Before we start, I want to get a few things clear:

-Yes, I know the whole “Jacoby Ellsbury to the Dodgers” thing was probably a product of Scott Boras and the media.

-Yes, I know Matt Kemp should be ready by the start of 2014 to play center field.

-Yes, I know the Dodgers already have four outfielders, three of which have massive contracts, and three of which are injury prone.

-Yes, I know Ellsbury is injury prone. This example is operating in a vacuum.

-No, I don’t think the Dodgers will end up signing Ellsbury. There are just too many things that need to happen in order for the signing to make sense. And even then, depending on contracts, the signing STILL might not make sense due to Ellsbury’s injury history, along with how much money the Dodgers would have to eat on the contracts of their traded outfielders, and how badly that money would hamstring them for the future.

Okay. Now that we’ve gotten that cleared up, let’s begin.

The Los Angeles Dodgers, when healthy, have one of the best offensive outfields in the league. But, despite having a couple gold glove winners out there, they lack something when it comes to the fielding department, specifically in center field.

In 2013, the Dodgers trotted out five different players for a combined total of 1450.1 innings in center field, with Andre Ethier (645.1) and Kemp (576.1) getting the lion’s share of playing time. Now, Kemp hasn’t looked awful in center field (besides running into walls, which we’ll cover in a second), but UZR has less-than-friendly reviews on him. With Ethier, he looked somewhat usable while healthy in center, but just looked bad in the NLCS while trying to play with one good ankle. For the record, UZR gives Ethier a -1.8 for his efforts this season. The other three that played center for the Dodgers this season were Skip Schumaker (167 IP, -1.3 UZR), Yasiel Puig (55.1 IP), and Nick “Chili” Buss (6.1 IP). Schumaker shouldn’t be a starter, Puig’s natural position is right field, and I’m not even going to talk about Buss being in there as a viable option.

So, that brings us to comparing UZR for Kemp and Ellsbury.

Year Kemp (IP, UZR) Ellsbury (IP, UZR)
2009 1355.1, 3.2 1302.2, -9.7
2010 1346, -25.8 104.2, 1.3
2011 1380, -4.8 1358.1, 16.0
2012 911, -9.0 611.1, 3.0
2013 576.1, -16.2 1188.1, 10.0

If we take the three seasons with the greatest sample size, Ellsbury is clearly the optimal choice in the field. Granted, he doesn’t have the arm strength that Kemp has, but UZR factors that into its ratings as well. The signing of Ellsbury to play center field would likely move Kemp to left, and would make Ethier and Carl Crawford expendable. Moving Kemp to left field also saves him from the rigors of center field that have plagued him over the past couple years.

Offensively, the acquisition would be relative. Yes, Ethier would probably hit more home runs, but Ellsbury would offset that with stolen bases. In 2013, Ethier posted a wRC+ of 120 without being able to hit lefties at all (wRC+ of 73 vs LHP) and Ellsbury wasn’t far behind with a 113 RC+ and troubles against lefties of his own (w RC+ of 78 vs LHP). Ellsbury represents more of an upgrade in speed over both Crawford and Ethier, and would give the offense a new dynamic to go with Puig atop the order in front of Hanley Ramirez, Adrian Gonzalez, Kemp, and newly-signed Alexander Guerrero.

Given what a healthy Kemp has meant to this team in the past (which was just as recently as April, 2012), he is arguably the most important piece in their lineup. If moving him out of center field and into left field can save him from some of the numerous hamstring and shoulder injuries that he has experienced, it would be a huge win for the Dodgers to finally acquire a proper center fielder without giving up any value on offense.


A Review of Lineup Optimization in 2013: AL

Warning: Very long post ahead.

At some point in time, maybe you’ve complained about the lineup your favorite team’s manager used. Maybe you’ve heard of or considered the concept of lineup optimization. Maybe you’ve heard that an optimized lineup, over the course of a full season, wouldn’t make that big of a difference.

It really doesn’t, but that doesn’t make it any less interesting.

In elementary school I spent precious class time attempting to optimize kickball lineups. I suppose that was my first foray into the world of sabermetrics and general baseball nerdiness.

Now, I tend to visit BaseballPress on a daily basis to check the lineups of every team, just because. Even more now, I am writing a long post regarding lineup optimization in the MLB.

Sky Kalkman wrote a great piece on his interpretation of The Book’s findings on lineup optimization. He summed it up with this:

“…we want to know how costly making an out is by each lineup position, based on the base-out situations they most often find themselves in, and then weighted by how often each lineup spot comes to the plate. Here’s how the lineup spots rank in the importance of avoiding outs:

#1, #4, #2, #5, #3, #6, #7, #8, #9

So, you want your best three hitters to hit in the #1, #4, and #2 spots. Distribute them so OBP is higher in the order and SLG is lower. Then place your fourth and fifth best hitters, with the #5 spot usually seeing the better hitter, unless he’s a high-homerun guy. Then place your four remaining hitters in decreasing order of overall hitting ability, with basestealers ahead of singles hitters.”

Following the conclusion of the Major League Baseball regular season, I took to the task of finding each team’s most common starters and lineups, hypothetically optimizing them and comparing the results by which team theoretically cost themselves the most runs by straying from optimization.

I sorted each team’s hitters by plate appearances, made sure there was a representative of every position and used Baseball-Reference’s batting order archive to find the most common order those eight/nine players appeared in to find each team’s hypothetical “most common” lineup.

Then I plugged that lineup into Baseball Musing’s lineup optimization tool, along with their 2013 OBP and SLG to find the optimized lineup for each team.

It’s far from a perfect science, especially with teams like Oakland who often change their lineup by utilizing platoons, but it’s good enough and I wanted an opportunity to tell people much smarter and more qualified than me how to better do their job.

Behold, the results (where rpg is runs per game, season difference is the amount of runs “lost” from a season’s worth of theoretical lineups to optimized lineup, and rank is the most optimized to least optimized lineups):

Boston Red Sox

Common rpg: 5.448. Optimized rpg: 5.547. Season difference: -16.038 runs.

Rank: 10th AL, 24th overall

2013 OBP SLG Optimal OBP SLG
CF Ellsbury .355 .426 LF Nava .385 .445
RF Victorino .351 .451 DH Ortiz .395 .564
2B Pedroia .372 .415 RF Victorino .351 .451
DH Ortiz .395 .564 1B Napoli .360 .482
1B Napoli .360 .482 C Saltalamacchia .338 .466
LF Nava .385 .445 SS Drew .333 .443
C Saltalamacchia .338 .466 CF Ellsbury .355 .426
3B Middlebrooks .271 .425 3B Middlebrooks .271 .425
SS Drew .333 .443 2B Pedroia .372 .415


Oh, man. Off to a rocky start. Bear with me, folks, they aren’t all this jarring. This is probably the wackiest one that got spit out. The Red Sox obviously would never hit Dustin Pedroia ninth. The Book likes the nine-hitter to be a high OBP, low SLG guy so the top-of-the-order hitters have guys on base when they come to bat. And to be fair, Dustin Pedroia pretty much had the batting profile of a slap-hitter this season. He had the lowest SLG on the team, and his ISO puts his power production below guys like Brandon Crawford and Chris Denorfia. While his great .372 OBP is likely being put to waste in this lineup, Pedroia’s 2013 numbers fit the bill of an optimal #9 hitter when the rest of the lineup is this good.

Tampa Bay Rays

Common rpg: 4.689. Optimized rpg: 4.779. Season difference: -14.580 runs.

Rank: 8th AL, 17th overall

2013 OBP SLG Optimal OBP SLG
CF Jennings .334 .414 2B Zobrist .354 .402
DH Joyce .328 .419 RF Myers .354 .478
2B Zobrist .354 .402 DH Joyce .328 .419
3B Longoria .343 .498 1B Loney .348 .430
1B Loney .348 .430 3B Longoria .343 .498
RF Myers .354 .478 CF Jennings .334 .414
LF Johnson .305 .410 SS Escobar .332 .366
C Molina .290 .304 LF Johnson .305 .410
SS Escobar .332 .366 C Molina .290 .304


I always like Joe Maddon’s lineups. He mixes things up a lot and isn’t afraid to push the envelope. He’s batted catchers high in the order. He’s led off Ben Zobrist, an excellent – but unconventional – leadoff hitter. For a while this year he batted Evan Longoria second, which is quite smart and probably never would have been considered a decade ago. However, Desmond Jennings isn’t an ideal leadoff hitter with a .330 career OBP and Matt Joyce’s .252 BABIP left him with the lowest OBP of his career. Zobrist is the Rays best leadoff hitter and Wil Myers, arguably the Rays most productive hitter, should be higher in the order.

Baltimore Orioles

Common rpg: 4.724. Optimized rpg: 4.814. Season difference: -14.580 runs.

Rank: 9th AL, 19th overall

2013 OBP SLG Optimal OBP SLG
LF McLouth .329 .399 LF McLouth .329 .399
3B Machado .314 .432 1B Davis .370 .634
RF Markakis .329 .356 SS Hardy .306 .433
CF Jones .318 .493 CF Jones .318 .493
1B Davis .370 .634 3B Machado .314 .432
C Wieters .287 .417 DH Flaherty .293 .390
SS Hardy .306 .433 2B Roberts .312 .392
DH Flaherty .293 .390 C Wieters .287 .417
2B Roberts .312 .392 RF Markakis .329 .356


Chris Davis started the season out as the Orioles #5 hitter, because no one yet knew he would transform into some sort of robot humanoid. Once the transformation was well underway, Buck Showalter continued batting Davis fifth and a struggling Nick Markakis third, likely because “if it ain’t broke, don’t fix it,” and the idea that moving a hot batter to a different spot in the order could somehow throw him out of his groove. It took the Orioles until the middle of August to move Davis into the three-hole and by then Davis’ low spot in the order relative to his production likely cost them a handful of runs. Given the disparity of his OBP compared to his teammates, he’s even better suited for the two-hole.

New York Yankees

Common rpg: 3.978. Optimized rpg: 4.077. Season difference: -16.038 runs.

Rank: 1th AL, 25th overall

2013 OBP SLG Optimal OBP SLG
CF Gardner .344 .416 CF Gardner .344 .416
RF Suzuki .297 .342 2B Cano .383 .516
2B Cano .383 .516 1B Overbay .295 .393
DH Hafner .301 .378 DH Hafner .301 .378
LF Wells .282 .349 SS Nunez .307 .372
1B Overbay .295 .393 RF Suzuki .297 .342
SS Nunez .307 .372 3B Nix .308 .311
3B Nix .308 .311 LF Wells .282 .349
C Stewart .293 .272 C Stewart .293 .272


This isn’t the Yankees lineup we’re used to after the last couple months, or really after the last decade. But as Yankees fans well know, it is the lineup we saw for the majority of the season. Sorry you had to see this again, Yankees fans. The Yankees did hit Robinson Cano in his more deserved second-position for a period of time, but it was basically out of necessity as they had no other real hitters to work with. Instead, Ichiro Suzuki spent the majority of the time in the two-hole seemingly on reputation alone, despite being the third-worst candidate for the spot on a team full of Jayson Nix, Eduardo Nunez and Lyle Overbay’s.

Toronto Blue Jays

Common rpg: 4.791. Optimized rpg: 4.914. Season difference: -19.926 runs.

Rank: 14th AL, 29th overall

2013 OBP SLG Optimal OBP SLG
SS Reyes .353 .427 SS Reyes .353 .427
LF Cabrera .322 .360 DH Encarnacion .370 .534
RF Bautista .358 .498 CF Rasmus .338 .501
DH Encarnacion .370 .534 RF Bautista .358 .498
1B Lind .357 .497 1B Lind .357 .497
C Arencibia .227 .365 3B Lawrie .315 .397
CF Rasmus .338 .501 LF Cabrera .322 .360
2B Izturis .288 .310 C Arencibia .227 .365
3B Lawrie .315 .397 2B Izturis .288 .310


Like the Rays and Yankees, the Blue Jays experimented for a bit this season and batted Jose Bautista #2. Like the Rays and Yankees, this was very smart. Like the Rays and Yankees, they inexplicably stopped their experiment and reverted to a more traditional lineup. Melky Cabrera was not a good hitter this year, yet there he sits in the most important spot of our hypothetical lineup, while the Blue Jays have three great #2 candidates in Edwin Encarnacion, Bautista and even Adam Lind, who was basically “slow Jose Bautista” this season. Burying Colby Rasmus‘ .500 SLG in the seven-hole also didn’t help. And, no, that isn’t a typo. J.P. Arencibia really finished with a .227 OBP this year.

Detroit Tigers

Common rpg: 5.375. Optimized rpg: 5.510. Season difference: -21.870 runs.

Rank: 15th AL, 30th overall

2013 OBP SLG Optimal OBP SLG
CF Jackson .337 .417 DH Martinez .355 .430
RF Hunter .334 .465 3B Cabrera .442 .636
3B Cabrera .442 .636 2B Infante .345 .450
1B Fielder .362 .457 1B Fielder .362 .457
DH Martinez .355 .430 SS Peralta .358 .457
LF Dirks .323 .363 CF Jackson .337 .417
SS Peralta .358 .457 C Avila .317 .376
C Avila .317 .376 RF Hunter .334 .465
2B Infante .345 .450 LF Dirks .323 .363


OK, this one is actually kind of genius. Although OBP is far more important than speed in regards to a leadoff hitter, speed still kind of matters. You probably don’t want your slowest player batting leadoff, especially if you have a burner in the two or three spot. But the Tigers already have the slowest team in baseball, by far, and Miguel Cabrera is their ideal two-hitter. Since Victor Martinez won’t be holding Miggy up on the basepaths, putting his .355 OBP in front of Miggy is actually really smart, especially considering Miggy hits a first-inning homer like half the time anyway. Austin Jackson’s baserunning ability is better suited towards the bottom of the lineup for singles hitters like Alex Avila, Torii Hunter and Andy Dirks. Because of this wildly unconventional lineup, the Tigers ranked last in the study, and I would really love to see this lineup actually get played out.

Cleveland Indians

Common rpg: 4.456. Optimized rpg: 4.509. Season difference: -8.586 runs.

Rank: 2nd AL, 7th overall

2013 OBP SLG Optimal OBP SLG
CF Bourn .316 .360 C Santana .377 .455
1B Swisher .341 .423 2B Kipnis .366 .452
2B Kipnis .366 .452 LF Brantley .332 .396
C Santana .377 .455 1B Swisher .341 .423
LF Brantley .332 .396 SS Cabrera .299 .402
SS Cabrera .299 .402 DH Reynolds .307 .373
DH Reynolds .307 .373 RF Stubbs .305 .360
3B Aviles .282 .368 3B Aviles .282 .368
RF Stubbs .305 .360 CF Bourn .316 .360


As an Indians fan who was constantly frustrated by Terry Francona’s lineups, their rank in the study surprised me. However, the Indians problem was more with player selection, not lineup order, which isn’t reflected in the study. The Indians best statistical hitter, Ryan Raburn, amassed only 277 PA’s and didn’t make the cut. Yan Gomes, the Indians second best hitter, eventually began receiving his well-deserved playing time, but still finished with just 322 PA’s and missed the cut. To start the season, the Indians buried Carlos Santana‘s great OBP in the six-hole and wouldn’t move Asdrubal Cabrera’s putrid OBP out of the top of the order. But Francona fixed his mistake early enough for it not to be reflected in the years end most common lineup. And in that lineup, the Indians did a good job by having their top five hitters be their highest OBP guys. Michael Bourn was not the leadoff hitter the Indians thought they were signing, and was actually a pretty bad one with a .316 OBP. Santana and Jason Kipnis are much more deserving choices to lead off, though in real life I would likely flip-flop them, considering speed.

Kansas City Royals

Common rpg: 4.094. Optimized rpg: 4.204. Season difference: -17.820 runs.

Rank: 13th AL, 27th overall

2013 OBP SLG Optimal OBP SLG
LF Gordon .327 .422 DH Butler .374 .412
1B Hosmer .353 .448 1B Hosmer .353 .448
DH Butler .374 .412 LF Gordon .327 .422
C Perez .323 .433 C Perez .323 .433
CF Cain .310 .348 RF Lough .311 .413
3B Moustakas .287 .364 SS Escobar .259 .300
RF Lough .311 .413 CF Cain .310 .348
2B Getz .288 .273 3B Moustakas .287 .364
SS Escobar .259 .300 2B Getz .288 .273


Despite performing poorly in the study, the Royals two lineups were actually pretty close, and theoretically they could have earned themselves a handful more runs by simply swapping Billy Butler and Alex Gordon’s spots in the lineup. I have always loved Gordon as an unconventional leadoff hitter, but this season he stopped taking walks and getting hits on 35% of his balls in play, leading to a pedestrian .327 OBP after posting marks of .376 and .368 the last two seasons. Butler had a weird year, too, as he started walking all the time and lost all his power, posting a lower isolated slugging percentage than David Lough. But Butler is one of the slowest players in baseball and Eric Hosmer is a pretty good baserunner, especially for a first basemen, so swapping their orders in the optimized lineup might make more sense.

Minnesota Twins

Common rpg: 4.301. Optimized rpg: 4.379. Season difference: -12.636 runs.

Rank: 5th AL, 12th overall

2013 OBP SLG Optimal OBP SLG
2B Dozier .312 .414 LF Willingham .342 .368
C Mauer .404 .476 C Mauer .404 .476
LF Willingham .342 .368 DH Doumit .314 .396
1B Morneau .315 .426 1B Morneau .315 .426
DH Doumit .314 .396 2B Dozier .312 .414
3B Plouffe .309 .392 3B Plouffe .309 .392
RF Arcia .304 .430 SS Florimon .281 .330
CF Thomas .290 .307 RF Arcia .304 .430
SS Florimon .281 .330 CF Thomas .290 .307


Blame slugging percentage for this one. Joe Mauer should really be the Twins leadoff hitter. But, since slugging percentage is flawed in its attempt to represent power by including singles – something Mauer hits a ton of – Mauer has over 100 points of SLG on Josh Willingham, leading the generator to believe Willingham is a more ideal leadoff hitter despite Mauer’s .404 OBP. We all know that Willingham is more of a power hitter than Mauer, which is why we should always use ISO to measure power, where Willingham edges Mauer .159 to .156 even on a down season. Other than the mistake of batting Brian Dozier leadoff, though, the Twins real-life lineup does a pretty great job, with their OBPs falling in descending order after Dozier. If this lineup generator used ISO instead of SLG like I wish it would, flip-flopping Mauer and Willingham at the top would likely be the optimal order for the Twins.

Chicago White Sox

Common rpg: 3.950. Optimized rpg: 4.030. Season difference: -12.960 runs.

Rank: 6th AL, 14th overall

2013 OBP SLG Optimal OBP SLG
CF De Aza .323 .405 CF De Aza .323 .405
SS Ramirez .313 .380 RF Rios .328 .421
RF Rios .328 .421 3B Gillaspie .305 .390
1B Dunn .320 .442 1B Dunn .320 .442
DH Konerko .313 .355 LF Viciedo .304 .426
3B Gillaspie .305 .390 SS Ramirez .313 .380
LF Viciedo .304 .426 DH Konerko .313 .355
2B Keppinger .283 .317 C Flowers .247 .355
C Flowers .247 .355 2B Keppinger .283 .317


Alejandro De Aza isn’t a great leadoff hitter with a .323 OBP, but when you have the fourth worst team OBP in baseball, .323 will do. The main problem with the White Sox order is their two-hole, as is the problem with most MLB lineups. Alexei Ramirez’s offensive skill set is basically the exact one that MLB managers are beginning to move away from in the 2-hole, with his .313 OBP, complete disappearance of power and newfound penchant for stealing bases. Contrary to conventional wisdom, good base stealers are better suited for the 6/7 spots in the lineup. Risking outs with your best hitters at the plate, who are more likely to drive you in with extra base hits anyway, is not a good idea. With that aside, the White Sox did well by choosing the correct leadoff hitter and keeping their worst hitters at the bottom of the order.

Oakland Athletics

Common rpg: 4.933. Optimized rpg: 4.989. Season difference: -9.072 runs.

Rank: 3rd AL, 8th overall

2013 OBP SLG Optimal OBP SLG
LF Crisp .335 .444 3B Donaldson .384 .499
SS Lowrie .344 .446 SS Lowrie .344 .446
CF Cespedes .294 .442 DH Smith .329 .391
1B Moss .337 .522 1B Moss .337 .522
3B Donaldson .384 .499 C Norris .345 .409
DH Smith .329 .391 CF Cespedes .294 .442
RF Reddick .307 .379 LF Crisp .335 .444
C Norris .345 .409 RF Reddick .307 .379
2B Sogard .322 .364 2B Sogard .322 .364


Surprise! The Oakland Athletics scored well in a SABR-slanted study. And this doesn’t even take into account how well the A’s optimize their lineup on a daily basis by correctly utilizing platoons. But either way, in this theoretical lineup, the A’s do a good job by getting their second and fourth hitters correct. Though breakout player and MVP-candidate Josh Donaldson is better suited to lead off, Coco Crisp was still a good option. And whether incidental or not, Yoenis Cespedes‘ low OBP in the three-hole doesn’t hurt them too much, as OBP isn’t as important in the three-hole as conventional wisdom would tell you. The A’s do well in this study with the lineup provided for them, and do even better in real life by putting the right guys on the field every day.

Texas Rangers

Common rpg: 4.481. Optimized rpg: 4.582. Season difference: -16.362 runs.

Rank: 12th AL, 26th overall

2013 OBP SLG Optimal OBP SLG
2B Kinsler .344 .413 2B Kinsler .344 .413
SS Andrus .328 .331 3B Beltre .371 .509
RF Cruz .327 .506 1B Moreland .299 .437
3B Beltre .371 .509 RF Cruz .327 .506
C Pierzynski .297 .425 C Pierzynski .297 .425
1B Moreland .299 .437 CF Martin .313 .385
LF Murphy .282 .374 DH Profar .308 .336
DH Profar .308 .336 LF Murphy .282 .374
CF Martin .313 .385 SS Andrus .328 .331


Ian Kinsler is another guy who doesn’t scream “prototypical leadoff hitter,” basically in the sense that he’s not a speed-first centerfielder, but he is a pretty great one and easily the Rangers best option. So you have to give them credit for sticking with him instead of going to the more conventional, “easy” choice of Elvis Andrus or Leonys Martin. However, the Rangers lose a lot of value by keeping the speedy Andrus in the two-hole, a spot he really wasn’t suited for this season with a career-worst .327 OBP. Adrian Beltre is the perfect fit for the Rangers #2 hitter, and Andrus is better suited for the bottom of the order. With Andrus’ basestealing abilities, I think it would be wiser to switch his spot with Jurickson Profar’s in this optimized lineup, giving Andrus the opportunity to attempt steals with the 8th and 9th hitters up, rather than the 1st and 2nd.

Los Angeles Angels of Anaheim

Common rpg: 4.864. Optimized rpg: 4.945. Season difference: -13.122 runs.

Rank: 7th AL, 15th overall

2013 OBP SLG Optimal OBP SLG
LF Shuck .331 .366 C Iannetta .358 .372
CF Trout .432 .557 CF Trout .432 .557
1B Pujols .330 .437 RF Hamilton .307 .432
RF Hamilton .307 .432 1B Pujols .330 .437
DH Trumbo .294 .453 2B Kendrick .335 .439
2B Kendrick .335 .439 SS Aybar .301 .382
3B Callaspo .324 .347 LF Shuck .331 .366
C Iannetta .358 .372 DH Trumbo .294 .453
SS Aybar .301 .382 3B Callaspo .324 .347


This one is similar to Detroit’s, but unlike Detroit’s, this one probably only works in theory. When Miggy is batting second and the entire team is slower than molasses in an igloo, I think you can get by with a slow-running, high-OBP guy like Victor Martinez leading off. When your #2 hitter is Mike Trout, you’re probably costing yourself extra bases on would-be Trout doubles and triples by having Chris Iannetta on first in front of him, likely having just drawn a leadoff walk. If Iannetta weren’t so slow and Trout weren’t so fast, Iannetta would actually be a pretty great leadoff hitter. Of all players with 350+ PA this season, only Joey Votto posted a higher BB% (18.6) than Iannetta (17.0). The Angels did do the right thing by putting Trout where he belongs in the two-hole, though. A .432 OBP is great for leadoff, but when you hit for more power than Giancarlo Stanton and Adam Dunn, some of those extra base hits go to waste leading off.

Seattle Mariners

Common rpg: 4.382. Optimized rpg: 4.439. Season difference: -9.234 runs.

Rank: 4th AL, 9th overall

2013 OBP SLG Optimal OBP SLG
SS Miller .318 .418 3B Seager .338 .426
2B Franklin .303 .382 DH Morales .336 .449
3B Seager .338 .426 RF Saunders .323 .397
DH Morales .336 .449 1B Smoak .334 .412
LF Ibanez .306 .487 LF Ibanez .306 .487
1B Smoak .334 .412 2B Franklin .303 .382
RF Saunders .323 .397 C Zunino .290 .329
C Zunino .290 .329 SS Miller .318 .418
CF Ackley .319 .341 CF Ackley .319 .341


The Mariners began the season with Dustin Ackley at second base and Brendan Ryan at shortstop. By the beginning of June, Ackley had hit himself back to AAA and not much later, the Mariners cut ties with Ryan’s offensive deficiencies in favor of rookies Brad Miller and Nick Franklin. Both held their own with the bat from the get-go, earning themselves the top two spots in the Mariners everyday lineup. However, despite holding their own, neither are really top of the order hitters with sub-.320 OBPs and just average power. Better suited for the top spots are the Mariners best player, Kyle Seager and most productive hitter, Kendrys Morales. Still, the Mariners performed well in the study, likely due to the similar profiles of most of their hitters.

Houston Astros

Common rpg: 4.133. Optimized rpg: 4.176. Season difference: -6.966 runs.

Rank: 1st AL, 3rd overall

2013 OBP SLG Optimal OBP SLG
LF Grossman .332 .370 LF Grossman .332 .370
2B Altuve .316 .363 C Castro .350 .485
C Castro .350 .485 2B Altuve .316 .363
1B Carter .320 .451 1B Carter .320 .451
DH Pena .324 .350 3B Dominguez .286 .403
RF Martinez .272 .378 CF Barnes .289 .346
CF Barnes .289 .346 DH Pena .324 .350
3B Dominguez .286 .403 RF Martinez .272 .378
SS Villar .321 .319 SS Villar .321 .319


The Astros place third in the study basically by default. It’s not hard to identify your best players and construct a near-optimal lineup when you’ve only got two league-average bats. Just put your best hitter, Jason Castro, in the two-hole, bat Chris Carter fourth to drive in runs and lead off your next highest OBP guy, who believe it or not is a one “Robbie Grossman” and the rest basically doesn’t matter because none of them are very good. Robbie Grossman is actually the most deserving leadoff batter on a real team in the Major League of Baseball. #Astros

Coming soon: Part 2, with National League lineups and conclusion.


A Case Study in Lineup Construction

Controversy and speculation have surrounded the Texas Rangers’ lineup for the better part of a year.  First, Michael Young was a consistent presence in the middle of the Rangers’ order despite lackluster performance.  More recently, the departure of Josh Hamilton and Mike Napoli have led many to speculate the Rangers’ offense would take a step back in 2013.  But how did Ron Washington’s lineups compare to an optimized lineup? How will the loss of Hamilton and Napoli affect the Rangers’ run production?

To find out, I wrote a Monte Carlo program which simulated 50 seasons of games for all 362,880 (9!) lineup combinations. It takes as input the percentage of singles, doubles, triples, home runs, walks, and strikeouts with respect to their number of plate appearances for each batter in the lineup. The outcomes of each at bat is determined by a random number generator as if each batter faces a league average pitcher, and base runners advance according to the league averages for taking extra bases. While not including all the variations of pitcher quality, player speed and defensive quality, it allows for an adequate picture of the effectiveness of various lineups.

Let’s first look at the effect of moving Young from the 5th spot to the 9th spot. We’ll start with the most frequently occurring lineup from 2012:

Ian Kinsler
Elvis Andrus
Josh Hamilton
Adrian Beltre
Micheal Young
Nelson Cruz
David Murphy
Mike Napoli
Mitch Moreland

We’ll plot a histogram of the runs per game (labeled rpg in the plots, always full 9 innings games) scored by all 362,880 possible lineup combinations, all 40,320 lineup combinations with Young batting 5th, and all 40,320 lineup combinations with Young batting 9th (y-axis is frequency of occurrence, note the logarithmic scale).

2012 Lineup distribution, Young in 5 slot vs 9 slot

Most possible lineup combinations produce the same number of runs to within a 0.1 runs per game. No matter the lineup combination, the variation of runs scored is around 16 runs a year. For the Rangers’ lineup, lineup optimization is a relatively small effect. Lineups with different hitters may show a greater or lesser dependence of lineup construction on run scoring.

The difference between moving Michael Young from 5th in the order to 9th in the order is smaller; 0.02 runs per game, or 3 runs over the course of a year. Given the hitters in the Rangers lineup, batting Young 5th in the order did not make a significant difference. But there was another option, Ron Washington could have substituted Craig Gentry for Michael Young. We again plot a histogram of the runs per game scored for all possible lineup combinations with Gentry batting (red) or Michael Young batting (blue).

Rangers Lineup Distribution, Young vs. Gentry

Again, we find the difference to be minimal; this time roughly 0.01 runs per game, or a mere 1.6 runs per season. While it was painful to watch Young batting 5th in 2012, the increased production at the bottom of the lineup largely offset the loss of production in the middle of the lineup. So what happens now that the Rangers’ lineup has lost Hamilton, Napoli and Young in exchange for AJ Pierzynski, Lance Berkman, and Leonys Martin/Craig Gentry? Based on Ron Washington’s lineups in spring training, a likely common lineup for the Rangers in 2013 is as follows:

Ian Kinsler
Elvis Andrus
Lance Berkman
Adrian Beltre
Nelson Cruz
AJ Pierzynski
David Murphy
Mitch Moreland
Leonys Martin

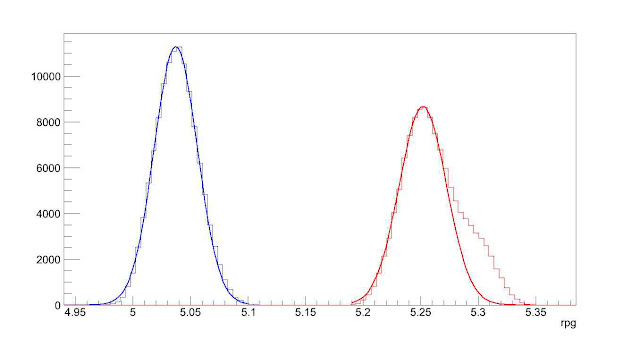
I ran all possible lineup combinations in which Adrian Beltre batted 2nd, 3rd or 4th for both the 2012 and likely 2013 Rangers’ lineup. For the 2013 Rangers’ lineup, I used projections (ZiPS, Steamer, Oliver, Bill James) for the upcoming season to seed the simulation with the hitters’ likely production. Again, a histogram of runs scored per game for all these lineup combinations, with 2012 in blue and 2013 in red.

2013 Rangers Lineup Distribution vs 2012 Lineup Distribution

The peaks as fit predict a 0.22 runs per game increase for the Rangers in 2013, or roughly 36 runs over the course of the year. The non-Gaussian (or normal distribution) tail of the 2013 distribution indicates it might be possible to improve even more.

We will finish with comparisons of the optimized lineups for 2012 and 2013 to the most usual/expected lineups for those years.

2012 Lineup 2012 Optimized 2013 Lineup 2013 Optimized
5.03 rpg 5.11 rpg 5.29 rpg 5.34 rpg
Ian Kinsler David Murphy Ian Kinsler Ian Kinsler
Elvis Andrus Adrian Beltre Elvis Andrus Lance Berkman
Josh Hamilton Josh Hamilton Lance Berkman Leonys Martin
Adrian Beltre Mitch Moreland Adrian Beltre Adrian Beltre
Micheal Young Nelson Cruz Nelson Cruz Nelson Cruz
Nelson Cruz Mike Napoli AJ Pierzynski Mitch Moreland
David Murphy Ian Kinsler David Murphy AJ Pierzynski
Mike Napoli Micheal Young Mitch Moreland David Murphy
Mitch Moreland Elvis Andrus Leonys Martin Elvis Andrus

We’ll start with the big picture. While moving/substituting for Michael Young in 2012 would have made little difference in run production, an optimized lineup would have increased the Rangers’ run total by 13 runs over the course of the year. Not much, but it would likely have been enough to have won the division instead of losing to the A’s. Of course, it is much easier to optimize a lineup when you already know how everyone is going to perform; using an optimized lineup based on 2012 projections wouldn’t have netted the 13 run increase. Most notably, leading off with Murphy (in his breakout year) instead of Kinsler (in his down year) to increase production is not a move one could expect an organization to predict before any games had been played in 2012.

Second, the probable lineup for the Rangers in 2013 is projected to score 8 runs a year less than an optimized lineup. Given the large variance in the production of a hitter as compared to his projections, these lineups seem virtually equivalent.

The optimized lineups show different characteristics than the lineups generated by Ron Washington. The optimized lineups forego Elvis Andrus batting second in preference for a power hitter with good average. Elvis Andrus is instead relegated to the 9th spot. The 2013 optimized lineup puts a lot of faith in rookie Leonys Martin, due entirely to some very respectable projections for the coming year (and not knowing he’s a rookie). Given the uncertainty of how much offense Martin will produce in 2013, have Martin bat in the bottom of the order, as in Ron Washington’s lineup, seems prudent. Finally, Mitch Moreland is preferred in the middle of the lineup in the optimized lineups instead of the bottom of the order as in Washington’s lineups.

If the Rangers are looking to optimize their lineup for 2013, this simulation indicates the two main points to consider: moving Moreland to the middle of the order, and considering batting Andrus 9th.


Plugging the Cardinals’ Shortstop Hole

It’s been nine months since the trade that brought Ryan Theriot to St. Louis, and the shortstop picture for the Cardinals is no clearer today than it was then. With their playoff hopes all but officially extinct, the prospect of another offseason spent looking for up-the-middle help looms large.

The trio of players who have garnered playing time at short for the Cards this season have been unimpressive, producing a combined 0.4 WAR in approximately a season’s worth of plate appearances. Theriot is an obvious non-tender candidate, while newly acquired Rafael Furcal will almost certainly have his $12 million option declined and become a free agent at the end of the season. This leaves the Cards with only Tyler Greene as an internal option, and the free agent market for shortstops is about as thin (the obvious exception being Jose Reyes, who the Cardinals have almost no hope of signing if they expect to keep Chris Carpenter and/or Albert Pujols). While the Cardinals will likely either give Greene a shot to hold down the job, or pick up another bargain during the free agency period, I’d like to propose that the Cardinals consider a radical alternative that could provide the team with a definitive edge: Albert Pujols.

Read the rest of this entry »


Do Catchers Influence Pitcher Performance? The Story of Spanky and Sluggo

From Opening Day to April 20th, Red Sox pitchers posted a 7.14 ERA when Jarrod Saltalamacchia was behind the plate versus a 2.40 ERA when Jason Varitek started. The resulting hubbub about this split made one fact extremely clear, when comparing the influence of different catchers, sample size is really really important.

Already by June 24th, Varitek and Salty’s split has been greatly reduced, with pitchers now throwing a 3.44 ERA to the veteran captain and a 4.36 ERA to the new guy. I would bet that these numbers will continue to converge as the season drags on, but even after 182 games it’s unlikely that either catcher will have enough innings to statistically test whether one is calling a better game. This is the difficulty of assessing catcher performance: comparing catchers between teams is near impossible (because the pitching staffs are different), and comparing catchers within teams is difficult (because sample sizes are small and different pitchers use different catchers). Nevertheless, many still believe that catchers do influence pitcher performance. Where can we find the data to support this hypothesis?

Read the rest of this entry »


2011 Cleveland Indians Lineup by The Book

Last year, Manny Acta made a splash by dropping Grady Sizemore to second in the batting order. This year, he’s considering moving him back to leadoff. Is either the right move? And how should the rest of the lineup look?

Read the rest of this entry »


Cleaning Up Kenny Williams’ Mess

In spite of a questionable off-season approach to their designated hitter situation and a deadline deal that didn’t fill that vortex of suck, the Chicago White Sox are in first place on the backs of Alex Rios, Alexei Ramirez, Paul Konerko, and most of the pitching staff. After facing Baltimore for one more tonight, they will be going into a critical 3 game series against division rival Minnesota. It doesn’t get us anywhere to look at the past, so the question is what can the White Sox do to maximize the value of the players they have going forward?

The most glaring weakness is still the DH spot. Mark Kotsay has received the majority of the playing time here, and he has also been the team’s least valuable hitter. Kotsay has posted a slash line of .228/.305/.378, with a wOBA of .299. Kotsay’s –0.7 WAR is not only the worst on the team, but tied for fourth worst in the MLB among players with 280 or more PAs. It’s clear that Kotsay isn’t getting the job done, but who is the most viable choice to replace him?

Young Cuban slugger Dayan Viciedo is an interesting option. He’s posting a .361 wOBA (.310/.310/.521) in his first 71 PAs. On the surface, that looks great, but his .333 BABIP is unsustainable for someone as… um… husky as Viciedo. Also, his walk rate of 0% is going to be exploited soon enough (Viciedo’s already swinging at 39.8% of balls outside of the strike zone). It’s clear that even with his incredible power, he’s just not ready for the Majors, and would likely be eaten alive in the playoffs.

Mark Teahen is nearing the completion of his rehab stint in Charlotte, and could be back with the club in the next week. The .255/.340/.387 (.317 wOBA) line he put up while starting at third base isn’t the most stunning, but against RHP he’s hitting .287/.376/.444 (.363 wOBA).

Andruw Jones has played in the DH role some, while also serving as the fourth outfielder. Andruw’s .204/.312/.444 line gives him a .336 wOBA, placing him in the neighborhood of being a league average hitter. Jones benefits from facing lefties, against whom he posts a line of .235/.350/.515 (.376 wOBA).

So based on those numbers, the answer to the DH scenario appears to be a Teahen/Jones platoon, right?

Wrong.

Well, half right. The White Sox currently have a right fielder who, while being a good hitter, is just terrible defensively. I’m of course referring to Jermaine Dye Carlos Quentin. Quentin’s line of .232/.328/.488 (.352 wOBA) is solid in it’s own right, but Quentin’s a great candidate to improve that line, thanks to the impending regression of his .213 BABIP. Quentin’s defense in the past two seasons has been quantifiably terrible. Back to back UZR/150s of –25.2 and –34.2 (the former in LF) have shown that Quentin can’t get the job done, and that he’s a DH (or maybe a first baseman, but that’s a discussion for 2011).

Teahen, meanwhile, has a UZR/150 of just –2.0 in 261 games in right. Jones, in 42 games this year, has a UZR/150 of 8.6. A platoon of these two players also would help the oft-injured Quentin stay healthy, keeping his dangerous bat in the lineup.

The White Sox are in a position that most didn’t think they could be in after the first two months of the season. The team has had some breaks, but if they’re going to compete with a very good Twins team, they have to utilize their players effectively. Getting Quentin out of the outfield and Mark Kotsay out of the lineup? Well, that’s just smart baseball.


The Braves’ Leadoff Situation

I decided to do a little research after watching the Braves lose to the Mets last night in a game in which the Braves’ offense had a) four extra-base hits to the Mets’ two; b) four singles to the Mets’ three; c) four walks to the Mets’ three; and d) five strikeouts to the Mets’ seven.  After grounding into three more double plays, the Braves are now second in the Majors in GIDP with 36 on the year.  One of the culprits was Yunel Escobar, who I seem to recall GIDP-ing an awful lot.  So I looked into it.

I was right.  After I read that Escobar grounded into 21 double plays in 2009 and 24 in 2008, which was the highest total in the N.L. for those two years, I decided to examine the batted ball data on Fangraphs, and my findings were telling (click on the link and then click on GB% to sort by that).  In 2009 Yunel was one of the most prolific groundball hitters in all of baseball.  More than 50% of his balls in play were on the ground, good for 23rd in all of MLB.  And he hit the ball on the ground at an even higher rate in 2008.

Here’s the interesting thing: If you look at the folks ahead of him on this list, every single one of them are top-of-the-order hitters for their teams.  In fact most of them are leadoff men.  It makes sense for Scott Podsednik, Jacoby Ellsbury, Michael Bourn, Elvis Andrus, Denard Span, Emilio Bonifacio, or Carl Crawford to hit the ball on the ground because of their speed.  Not only are they attempting to get infield hits, but also if there is a man on base in front of them, there’s very little danger in them grounding into a double play.  Bonifacio, for example, only grounded into 5 DP’s all year last year in 509 plate appearances, despite a high GB%.  But Yunel Escobar is no burner, and he’s also batting with men on base a whole lot more than those guys due to his position in the batting order.

Yunel has been very successful at the plate the last two years (especially last year), and he may yet improve in his age 27 season.  There’s no need to try to change his swing or his approach at the plate just because of the GIDPs.  That kind of tinkering is almost always counter-productive.  OK, so he hits a ton of groundballs and gets on base a lot, without much power.  Perfect, let’s hit him leadoff!  Those are precisely the qualities we look for in a leadoff man.  If he repeats his .377 OBP from last year while grounding into 25 DP’s and hitting in the 6 or 7 hole in the lineup, it’s such a total waste.  The kid has major on-base skills, but not run-producer skills (career slugging%: .416).  So, he should hit at the top of the lineup where he’ll get more plate appearances, where him getting on base is a bigger asset, and where he’s less likely to bat with as many runners on base and thus less likely to GIDP.  It’s a win-win-win.

If that isn’t a strong enough case to move Escobar up in the batting order in Atlanta, then add this: Nate McLouth has hit .237/.342/.386 in 514 plate appearances as a Brave.  And Jordan Schafer, who is the long-term solution in center field for Atlanta barring a major trade, is currently regaining his form in AAA as he comes back from wrist surgery, and isn’t ready to play every day in the big leagues, much less to hit leadoff.  Regardless of what the Braves do with CF as the year goes on, it doesn’t appear that their CF will be their leadoff man.  So based on that and the aforementioned batted ball data, why not try their shortstop?