A Case Study in Lineup Construction
Controversy and speculation have surrounded the Texas Rangers’ lineup for the better part of a year. First, Michael Young was a consistent presence in the middle of the Rangers’ order despite lackluster performance. More recently, the departure of Josh Hamilton and Mike Napoli have led many to speculate the Rangers’ offense would take a step back in 2013. But how did Ron Washington’s lineups compare to an optimized lineup? How will the loss of Hamilton and Napoli affect the Rangers’ run production?
To find out, I wrote a Monte Carlo program which simulated 50 seasons of games for all 362,880 (9!) lineup combinations. It takes as input the percentage of singles, doubles, triples, home runs, walks, and strikeouts with respect to their number of plate appearances for each batter in the lineup. The outcomes of each at bat is determined by a random number generator as if each batter faces a league average pitcher, and base runners advance according to the league averages for taking extra bases. While not including all the variations of pitcher quality, player speed and defensive quality, it allows for an adequate picture of the effectiveness of various lineups.
Let’s first look at the effect of moving Young from the 5th spot to the 9th spot. We’ll start with the most frequently occurring lineup from 2012:
| Ian Kinsler |
| Elvis Andrus |
| Josh Hamilton |
| Adrian Beltre |
| Micheal Young |
| Nelson Cruz |
| David Murphy |
| Mike Napoli |
| Mitch Moreland |
We’ll plot a histogram of the runs per game (labeled rpg in the plots, always full 9 innings games) scored by all 362,880 possible lineup combinations, all 40,320 lineup combinations with Young batting 5th, and all 40,320 lineup combinations with Young batting 9th (y-axis is frequency of occurrence, note the logarithmic scale).

Most possible lineup combinations produce the same number of runs to within a 0.1 runs per game. No matter the lineup combination, the variation of runs scored is around 16 runs a year. For the Rangers’ lineup, lineup optimization is a relatively small effect. Lineups with different hitters may show a greater or lesser dependence of lineup construction on run scoring.
The difference between moving Michael Young from 5th in the order to 9th in the order is smaller; 0.02 runs per game, or 3 runs over the course of a year. Given the hitters in the Rangers lineup, batting Young 5th in the order did not make a significant difference. But there was another option, Ron Washington could have substituted Craig Gentry for Michael Young. We again plot a histogram of the runs per game scored for all possible lineup combinations with Gentry batting (red) or Michael Young batting (blue).

Again, we find the difference to be minimal; this time roughly 0.01 runs per game, or a mere 1.6 runs per season. While it was painful to watch Young batting 5th in 2012, the increased production at the bottom of the lineup largely offset the loss of production in the middle of the lineup. So what happens now that the Rangers’ lineup has lost Hamilton, Napoli and Young in exchange for AJ Pierzynski, Lance Berkman, and Leonys Martin/Craig Gentry? Based on Ron Washington’s lineups in spring training, a likely common lineup for the Rangers in 2013 is as follows:
| Ian Kinsler |
| Elvis Andrus |
| Lance Berkman |
| Adrian Beltre |
| Nelson Cruz |
| AJ Pierzynski |
| David Murphy |
| Mitch Moreland |
| Leonys Martin |
I ran all possible lineup combinations in which Adrian Beltre batted 2nd, 3rd or 4th for both the 2012 and likely 2013 Rangers’ lineup. For the 2013 Rangers’ lineup, I used projections (ZiPS, Steamer, Oliver, Bill James) for the upcoming season to seed the simulation with the hitters’ likely production. Again, a histogram of runs scored per game for all these lineup combinations, with 2012 in blue and 2013 in red.
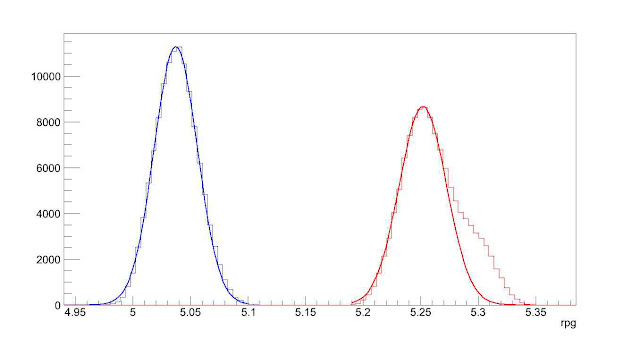
The peaks as fit predict a 0.22 runs per game increase for the Rangers in 2013, or roughly 36 runs over the course of the year. The non-Gaussian (or normal distribution) tail of the 2013 distribution indicates it might be possible to improve even more.
We will finish with comparisons of the optimized lineups for 2012 and 2013 to the most usual/expected lineups for those years.
| 2012 Lineup | 2012 Optimized | 2013 Lineup | 2013 Optimized |
| 5.03 rpg | 5.11 rpg | 5.29 rpg | 5.34 rpg |
| Ian Kinsler | David Murphy | Ian Kinsler | Ian Kinsler |
| Elvis Andrus | Adrian Beltre | Elvis Andrus | Lance Berkman |
| Josh Hamilton | Josh Hamilton | Lance Berkman | Leonys Martin |
| Adrian Beltre | Mitch Moreland | Adrian Beltre | Adrian Beltre |
| Micheal Young | Nelson Cruz | Nelson Cruz | Nelson Cruz |
| Nelson Cruz | Mike Napoli | AJ Pierzynski | Mitch Moreland |
| David Murphy | Ian Kinsler | David Murphy | AJ Pierzynski |
| Mike Napoli | Micheal Young | Mitch Moreland | David Murphy |
| Mitch Moreland | Elvis Andrus | Leonys Martin | Elvis Andrus |
We’ll start with the big picture. While moving/substituting for Michael Young in 2012 would have made little difference in run production, an optimized lineup would have increased the Rangers’ run total by 13 runs over the course of the year. Not much, but it would likely have been enough to have won the division instead of losing to the A’s. Of course, it is much easier to optimize a lineup when you already know how everyone is going to perform; using an optimized lineup based on 2012 projections wouldn’t have netted the 13 run increase. Most notably, leading off with Murphy (in his breakout year) instead of Kinsler (in his down year) to increase production is not a move one could expect an organization to predict before any games had been played in 2012.
Second, the probable lineup for the Rangers in 2013 is projected to score 8 runs a year less than an optimized lineup. Given the large variance in the production of a hitter as compared to his projections, these lineups seem virtually equivalent.
The optimized lineups show different characteristics than the lineups generated by Ron Washington. The optimized lineups forego Elvis Andrus batting second in preference for a power hitter with good average. Elvis Andrus is instead relegated to the 9th spot. The 2013 optimized lineup puts a lot of faith in rookie Leonys Martin, due entirely to some very respectable projections for the coming year (and not knowing he’s a rookie). Given the uncertainty of how much offense Martin will produce in 2013, have Martin bat in the bottom of the order, as in Ron Washington’s lineup, seems prudent. Finally, Mitch Moreland is preferred in the middle of the lineup in the optimized lineups instead of the bottom of the order as in Washington’s lineups.
If the Rangers are looking to optimize their lineup for 2013, this simulation indicates the two main points to consider: moving Moreland to the middle of the order, and considering batting Andrus 9th.