Author Archive

All Your Bases are Belong to Brian Dozier

Taking a look at last year’s most valuable baserunners, not a lot jumps out as being unusual. You’ve got Jacoby Ellsbury, who stole 52 bases. You’ve got Eric Young and Elvis Andrus, who each stole at least 40. You’ve got Mike Trout, who stole 33 and, like, isn’t a human. And then you’ve got Alcides Escobar, who has stolen 35 in the past and still managed to swipe 22 despite having the lowest on-base percentage in baseball.

Thing is, baserunning value doesn’t come solely from successful and unsuccessful steal attempts. That is a big part of it, yes, but there is something to be said about the ability to take the extra base that a less aggressive or less aware baserunner might not take. Matt Carpenter only stole three bags last year and was more valuable on the bases than speedster Alejando De Aza, who stole 20.

Take a look at this year’s early most valuable baserunners and, unsurprisingly, Dee Gordon and his eye-popping 24 steals tops the list. The name after that, though, stands out as a little unusual.

Brian Dozier.

When you think of Brian Dozier, you probably don’t think of a burner. You probably think more along the lines of “non-prospect middle infielder with surprising power and mediocre on-base skills.” Now, Dozier did steal 23 bases in his first season-and-a-half in the big leagues and his 12 steals already this year are tied for fourth. However, that’s half as many as Gordon and they have nearly identical baserunning values. That’s only one more steal than Andrus , and Dozier’s baserunning value is nearly double Andrus’. Dozier clearly is doing something besides stealing bases that is making him the most valuable baserunner in the American League.

Using the incredible, amazing Baseball-Reference Play Index, I was able to identify 25 instances this season in which Brian Dozier took an extra base. Some of them were ordinary, but some were not. Let’s take a look at some of the ones that were not:

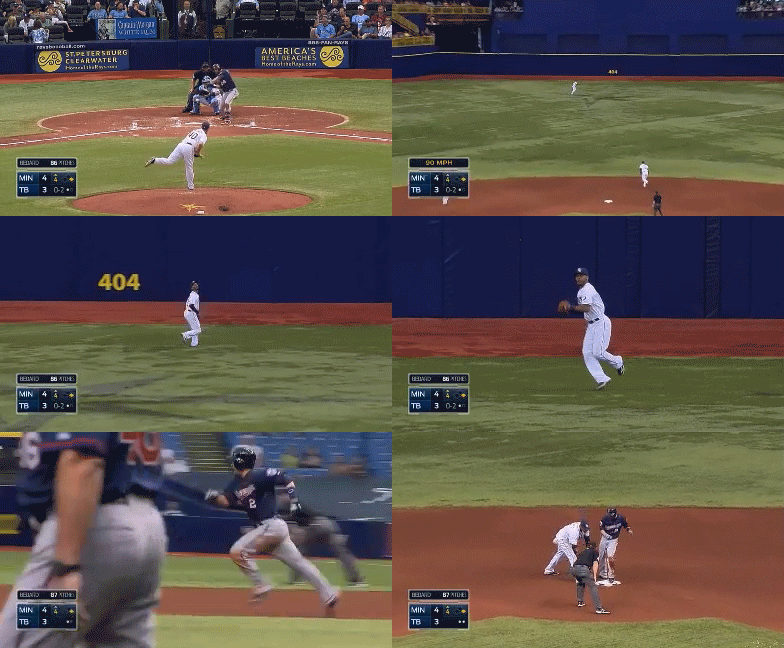
OK, this one’s not really out of the ordinary, but that’s why I’m getting it out of the way now. Brian Dozier does this, like, all the time. It’s one thing to go first-to-third on singles to right field. Dozier goes first-to-third on singles to center, regularly. I could have put five or six examples of this exact thing happening, but that would just be silly. Just trust me when I say if someone hits a single to the outfield and it’s not a hard liner to left, Brian Dozier is probably going to just put his head down and go first-to-third.

Again, it’s one thing to tag and advance when the ball is hit to the opposite side of the field. Far less often do you see a guy tag and advance to the base which is closest to the outfielder that caught it. Now, to be fair, the ball hit to Desmond Jennings was pretty deep in center and Michael Brantley was moving back when he caught his. But it’s more about the fact that Dozier is able to recognize these things and know his speed well enough to take the extra base.

Here we have a couple of ground ball singles to left field in which Dozier scored from second. These are the type of things that, when they happen in the midst of a game, can easily go unnoticed. But when they happen repeatedly over the course of a season, they really add up. Neither of these are super aggressive displays of baserunning, but they were hit to corner outfielders, who are closer to home plate than the center fielder, and not everyone scores these runs that Brian Dozier scored for the Twins.

Now for the fun stuff:

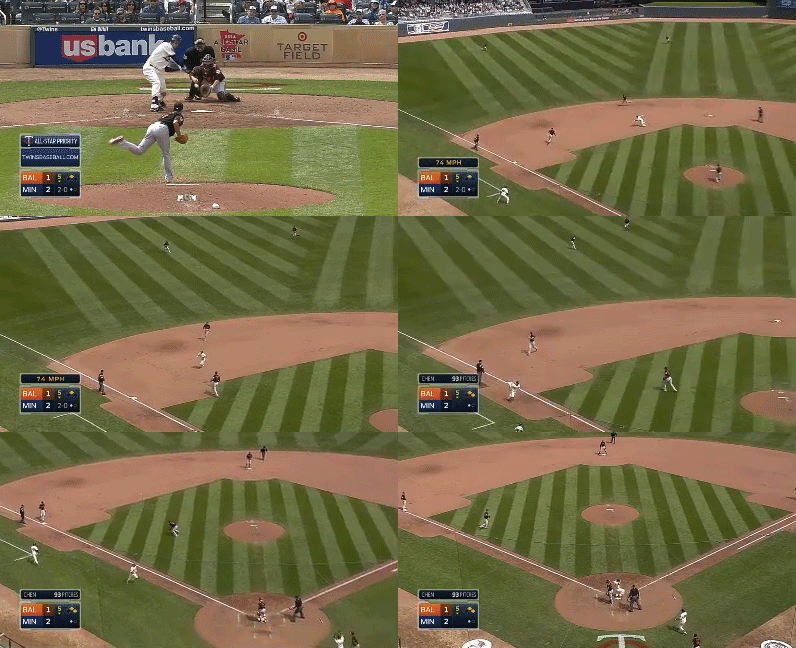
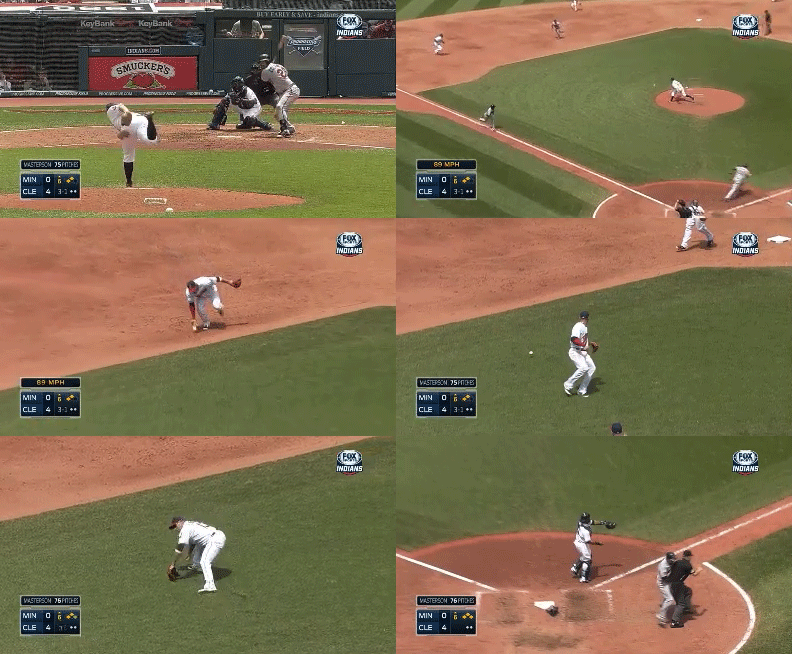
Here, Manny Machado almost makes an incredible play at third base to prevent a Brian Dozier infield hit. However, “almost incredible” sometimes become troublesome when you have to stretch the limitations of your physical ability to do so. That was the case for Machado on this play, and the ball skips away from the first basemen, though just barely. I don’t know if Dozier didn’t realize how little the ball actually skipped away, or if he just felt like being aggressive. Either way, it worked out and he turned a slow chopper to third into a double.

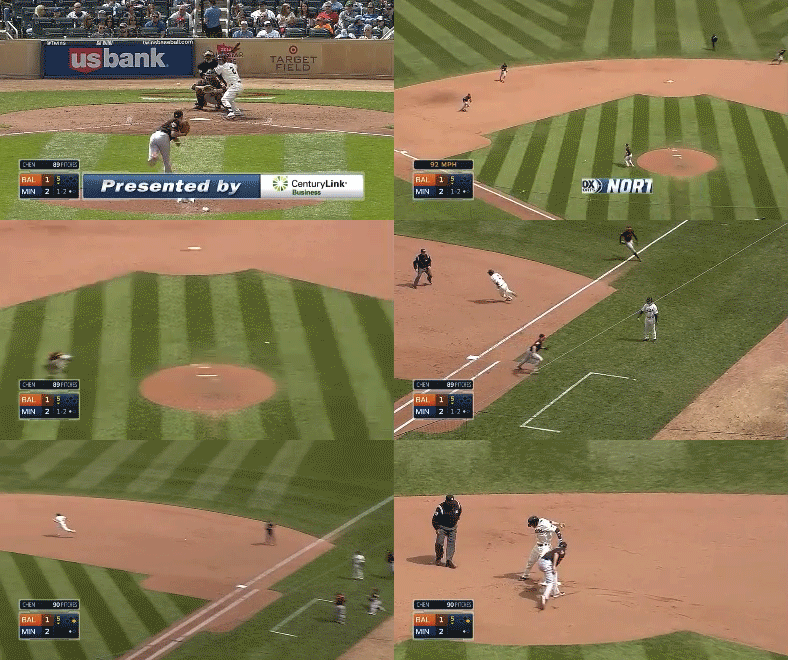
Here, Wade Davis decidedly did not have to stretch the limitations of his physical ability to make this play, yet it still resulted in an error. Again, the ball really didn’t skip that far away. Again, Brian Dozier didn’t care and took the extra base anyway. This one resulted in a run that he scored from second base when the ball barely made it to the pitchers mound.

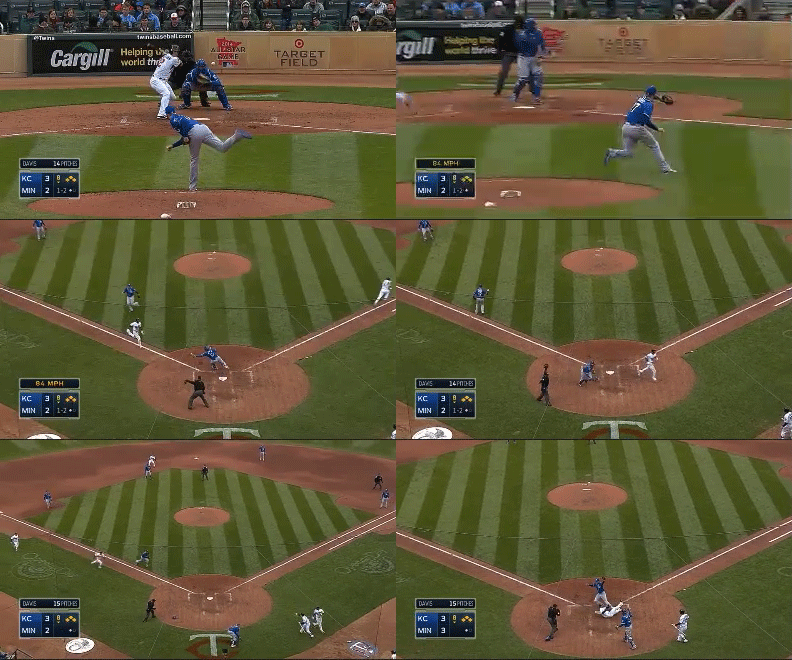
Here we find, again, Brian Dozier scoring from second on a ball that never left the infield. This one happened just last week. Now, I don’t know how much baserunning goes into pre-series scouting reports, but if it does, Asdrubal Cabrera should have known that one of the most aggressive – and successfully aggressive – baserunners in the league was on second base. Either way, Cabrera gave up on the play and turned his back on home plate just long enough for Dozier to manufacture a run with his legs.

*BONUS* BONEHEAD YASIEL PUIG GIF:

This one doesn’t say much about Dozier, as pretty much anyone in baseball would have scored from third on that. What’s humorous is Puig, in the first inning of a 0-0 ballgame, bypassing the cutoff man and throwing all the way home, nearly from the warning track, allowing every runner to advance in the process.

So what about the times Dozier has been thrown out? Surely, with a baserunner as aggressive as Dozier, he is bound to misjudge a ball or his own speed every now and then and cost his team an out. Let’s look at all the times Dozier has made an out on the bases this year:

And that’s it. The first one, Dozier was originally called safe until Don Mattingly successfully overturned the call with a challenge. Either way, it wasn’t the fault of Dozier being overaggressive or really Dozier’s fault at all. Nothing you can really do in that scenario. The second one, Dozier got a little aggressive, but the Twins had just taken a 1-0 lead in the 10th and he was likely running on any ground ball contact. It was a mistake, but it wasn’t an entirely costly mistake given the situation.

So there you have it. That’s how a guy like Brian Dozier can be among the most valuable baserunners in the MLB despite not being a premier base-stealer. There is being aggressive, and there is being smart with your aggression. Dozier has been able to take the extra base as often as any player in baseball and only has one real mistake to show for it. Last season, Dozier impressed with his surprising power. This season, the power has continued, but what he has done on the bases may be even more impressive.


Danny Salazar, Not According to Plan

Last season, Danny Salazar was among a wave of hard-throwing young pitchers that made electrifying debuts down the stretch, falling upon the national eye during the postseason.

Salazar threw 52 regular season innings over 10 starts in 2013, posting a 3.12 ERA and 3.16 FIP while striking out more than 11 batters per nine innings. His 30.8 K% was second of all starting pitchers who threw at least 50 innings, putting him behind only Yu Darvish and right ahead of Max Scherzer. His 2.75 xFIP was third in that same pool of pitchers, trailing only Matt Harvey and Felix Hernandez. His 14.6% swinging-strike percentage was tops in baseball, beating Francisco Liriano’s second-place rate by more than a full percentage point.

For 1/3 of the 2013 MLB season, 23-year-old Danny Salazar was among the most dominant starting pitchers in baseball. But with that kind of performance comes high expectations, and thus far, unlike young peers Sonny Gray, Michael Wacha and Alex Wood, Salazar is not living up to expectations.

Through his first four starts, Salazar sports a 7.85 ERA and a 5.70 FIP. Strikeouts are down, walks are up, and he has allowed five home runs in 18 innings.

Despite how good Salazar was in 2013, those who follow him and/or the Indians will likely remember his season by two big swings from two big men in two big games.

To wit:

Miggy

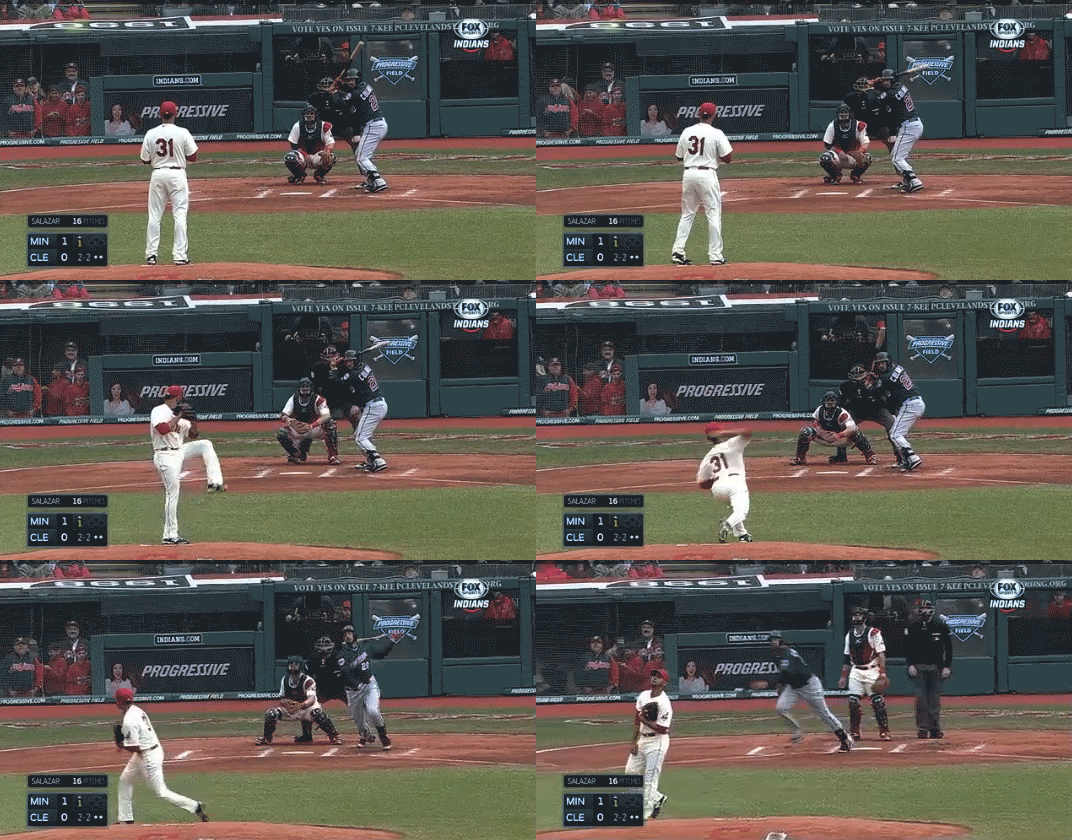
Miguel Cabrera hit that on the first pitch with two outs in the eighth inning of a late season game between two divisional rivals battling for first place. It gave the Tigers a one-run lead, they went on to win and it was a key momentum shift in the American League Central race. Salazar had been dynamite that evening, striking out 10 Tigers and fanning Cabrera in his first three trips to the plate, until the best hitter in the MLB ultimately came out on top. It was a “welcome to the big leagues” moment right out of a screenplay.

Delmon

Here, Delmon Young got a first pitch fastball in the third inning of an AL Wild Card play-in game and hit a no-doubter as no-doubty as any no-doubter could be. The Rays went on to win and Cleveland’s first playoff appearance in six years was gone as quickly as it came.

These two blemishes on an otherwise stellar 2013 campaign foreshadowed what Danny Salazar would struggle with early in the 2014 season.

Both these pitches were left up in the zone and Salazar paid for them. Elevated pitches are nothing out of the ordinary for Salazar. He works up in the zone often, as pitchers who can throw 100 miles per hour tend to and should do.

salazarzone

It contributed to some of his success last year, but it’s also contributing to his failures this year. There were two red flags in Salazar’s 2013 numbers that were concerning to begin with and are now trending in the wrong direction. The first was his inability to generate ground balls. Salazar’s ground ball rate of 34.4% would have ranked in the bottom 10 of qualified starting pitchers last season. To make matters worse, 13.7% of Salazar’s fly balls left the yard, also a bottom-10 figure. It’s tough for any pitcher to sustain success without generating ground balls or while giving up a lot of home runs. Combine the two and you’ve got a problem on your hands.

Danny Salazar knows he needs to get more ground balls. In spring training he was working on “being a little more consistent with keeping the ball down.”

That’s not exactly happening. Salazar’s ground ball rate has plummeted to 25.9%. His HR/FB is up to 18.5%. Let’s take a look at the home runs that Salazar has conceded through his first four starts of 2014.

No. 1 – Chris Colabello

hr1

86 mph slider, elevated and left over the heart of the plate.

No. 2 – Alexei Ramirez

hr2

85 mph split finger changeup that was thrown right down the middle of the plate and stayed up for too long.

No. 3 – Jose Abreu

hr3

88 mph slider, left way up in the zone and over the heart of the plate. Can’t hang a slider much worse than that and Salazar knew it immediately.

No. 4 – Ian Kinsler

hr4

This one was a fastball. Flat and elevated. It was a 3-1 count and Kinsler knew the fastball was coming. 18 times in Danny Salazar’s young career has he found himself in a 3-1 count. All 18 times he has come back with a fastball. Kinsler knew Salazar couldn’t trust his offspeed stuff, sat on the fastball and put it in the left field seats to give the Tigers a 4-3 lead.

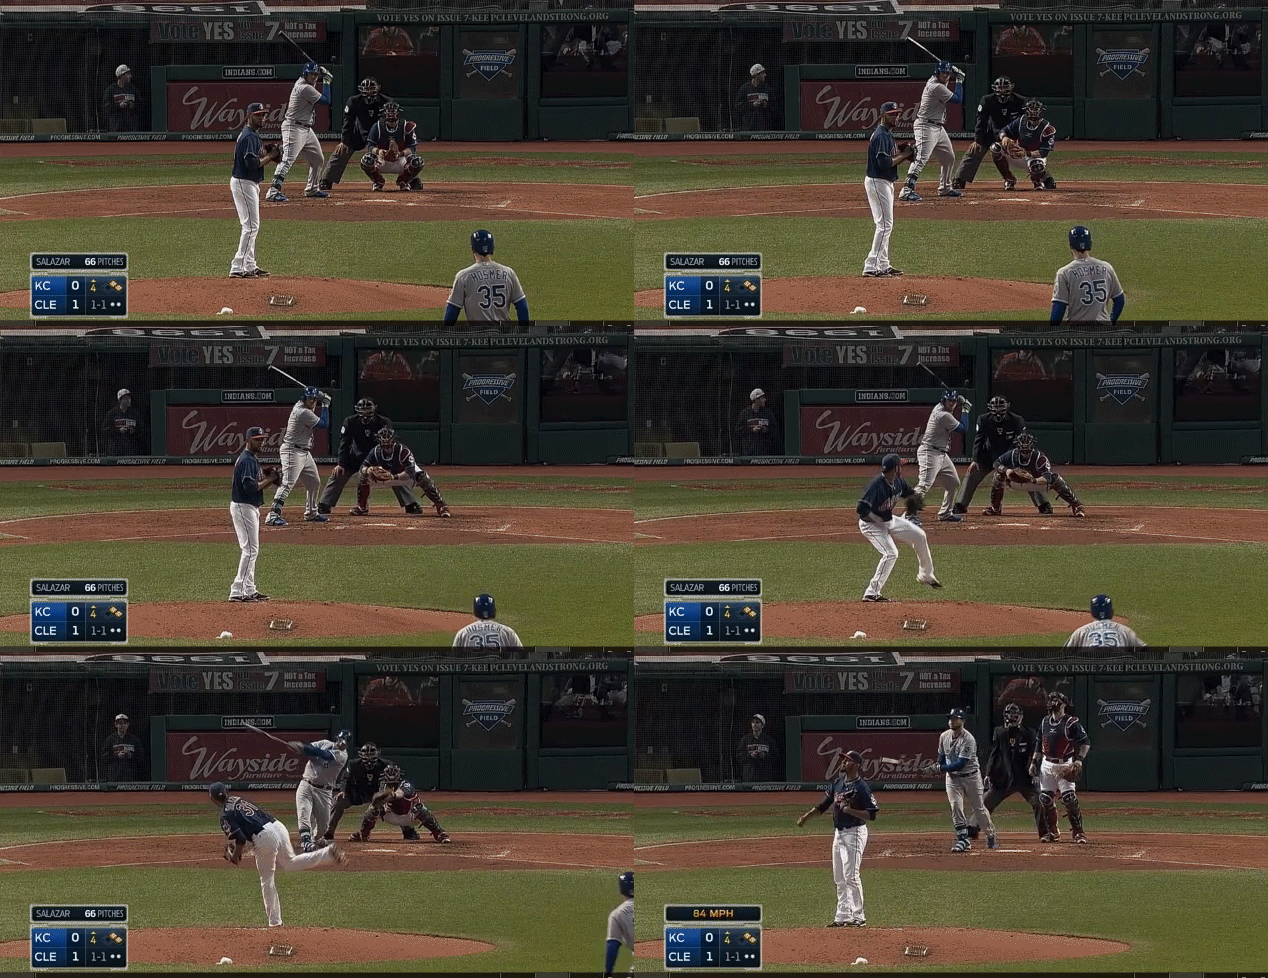
No. 5 – Mike Moustakas

hr5

84 mph slider elevated and left over the middle to an opposite-handed hitter. Might be even worse than the pitch to Abreu.

The slider clearly is an issue. Every time a batter has got a hit off Danny Salazar’s slider this season, that hit has been a home run. Consider this simple scatter chart of Salazar’s sliders in 2014:
slider
What you’ve got down at the bottom there is six sliders in the dirt, five of which went for balls. Of the remaining 20 sliders that weren’t in the dirt, only six were below the waist, where you want a good slider to wind up. That’s a lot of elevated, hittable sliders, as evidenced by the three in the middle there that went out of the park.

Then there’s the split change. This is Salazar’s out pitch. Its elite 22% whiff rate last year was the best in his arsenal and a result it accounted for nearly half of his strikeouts. However, it also needs to serve as his ground ball pitch, seeing his slider doesn’t generate any grounders, his fastball lives up in the zone and he doesn’t really throw a sinker or two seamer. Last season the split change had a 10.7% ground ball rate. This year, he has gotten only two ground balls with it and his rate is down to 2.99%. This could have something to do with the fact that, after watching video of his last start, Salazar believes he may be tipping the pitch. “With my changeup sometimes, I open up my glove too much,” Salazar said.

So, the split change isn’t getting any ground balls and he may be letting the batter know it’s coming. The sliders are all up in the zone and every time someone hits one it goes out of the park. Factor into the equation that his fastball velocity has dropped two miles per hour and its whiff rate has gone from 14% to 9% and its not hard to see why Salazar has struggled early on. All three of his pitches have had something wrong with them.

The Indians shouldn’t be so quick to pull the trigger on demoting him as some have suggested just yet, as this four game sample shouldn’t make us forget the elite production Salazar proved he was capable of last season. But that’s not to ignore that four games and 18 innings already make up nearly 30% of his major league body of work and his career ERA and FIP have already jumped to 4.35 and 3.83. With Trevor Bauer seemingly finding new life in Triple-A, if Danny Salazar doesn’t begin to correct these trends over his next several starts, you’ll have to wonder how long the Indians can let him work on trying to fix all three of his pitches.


What Would it Take for Andrelton Simmons to Be the MVP?

Andrelton Simmons is awesome.

If you are reading this article on FanGraphs.com right now, this comes as no surprise to you. And I’m not using “awesome” in the way people use it to describe the latest episode of Pretty Little Liars or whatever vanilla bullshit thing they’re drinking from Starbucks. I’m using it in its literal definition of being awe-inspiring:

awe·some, adjective. inspiring an overwhelming feeling of reverence, admiration, or fear; causing or inducing awe: an awesome sight.

The reason you know Andrelton Simmons to be awesome is because of the things he does in the field while playing shortstop. Here, be inspired by awe:

Awesome.

But he’s not a bad hitter, either. In fact, right now, in 2014, he has been a pretty great hitter. His 146 wRC+ is sixth among shortstops and he has a higher wOBA than Hanley Ramirez. His .268 isolated slugging percentage exceeds Edwin Encarnacion’s mark from 2013, and Edwin Encarnacion slugged 36 dingers that year. In 45 plate appearances, Simmons hasn’t struck out one time. Andrelton Simmons, thus far, appears to be making strides at the plate.

When you’re the best defensive player in the major leagues, you don’t need to do much with the bat to be a pretty great player. Last season, you may be surprised to find out that Simmons, despite not even being a league-average hitter, racked up 4.6 WAR. That total was good for 13th in the National League, right next to teammate Freddie Freeman who finished fifth in the MVP voting and also made a really great stretch in that .gif up there.

Anyway, I’m really starting to bury the lede, although I guess really the lede is right there in the title, which I have to assume you read considering you clicked on it and are now here.

Simmons received a couple of 8th and 9th place MVP votes last season while being a below-average hitter. Simmons, thus far, appears to be getting better as a hitter. Just how much better would Andrelton Simmons need to be at the plate to be the best player in the National League?

Let’s begin:

Intro

First, we need to figure out what our endgame here is. We want Simmons to be the most valuable player in the National League. The average WAR of National League MVP winners over the last four seasons is 7.4. We’re going to see what improvements, in areas other than the field, we can make to Simmons’ game in an attempt to get him to at least 7.0 WAR to get him in the discussion. In order to accumulate the most WAR possible, we’re going to assume that Simmons plays all 162 games and racks up 679 plate appearances for the Braves in this hypothetical MVP season. He played in 157 in his first full-length season last year and figures to play pretty much everyday until something goes wrong. The 679 PA is simply an extrapolation of his 2012 plate appearances.

Batting average

Last season, Simmons batted just .248. Not many people win MVP awards with batting averages under .250. Lucky for Simmons, he appeared to be unlucky. His .247 batting average on balls in play was fifth-lowest of all qualified batters in 2013, and was 50 points less than the league average. We know he isn’t going to sustain a BABIP 50 points less than the league average. However, Simmons does have a flaw in his batting profile that makes him especially susceptible to a low BABIP. He led the MLB with 38 infield pop-ups last season. Infield pop-ups literally never go for hits, so it’s not as easy as just regressing his BABIP back to the league average. His career BABIP is .262 and the league average is .297. Let’s say he cuts into his infield pop-ups a bit and gets a little lucky on grounders finding holes over the course of the season. We’ll meet in the middle and call it .280.

Plate discipline

Simmons’ plate discipline was already the strong suit of his offensive profile and it appears to only be getting better. Last year, Simmons’ contact rate was 87.5%, a top-10 mark in the National League. As I mentioned earlier, he has yet to strike out one time this season, the only starter in the MLB who can still make that claim. Last year, Simmons’ strikeout percentage was 8.4%. Considering his strikeout-less streak to begin the season, we can expect improvement on that number. I’ll side with Steamer on this one, whose updated 2014 projection has him finishing with a strikeout percentage of 7.5%.

As is typical with a player that has such high contact rates, Simmons doesn’t walk much. Why take pitches when you’re one of the best in the league at putting the bat on the ball? Last year, Simmons had a walk percentage of 6.1%. With his improved strikeout rate, we can assume a little bit of improvement in the walk department as well, but not much. We’ll bump it up to 6.5%.

Power

This is the part of Andrelton Simmons’ game that surprised people last season. First, he’s a shortstop, and most shortstops don’t hit for power. Second, he didn’t hit for power in the minor leagues. In 1,042 minor league plate appearances — a little less than two full seasons — Simmons only hit six home runs and never posted an isolated slugging percentage higher than .126. Simmons burst onto the scene last year by hitting 17 home runs and posting an ISO of .149. This year, through 11 games, Simmons has already hit two home runs and his ISO sits at a ridiculous .268.

The power appears to be real and is a result of his approach at the plate, which is unique. Most players with contact rates as high as Simmons — guys like Alexei Ramirez, Erick Aybar or Jose Altuve — make their mark by hitting line drives or hard ground balls that find holes. You usually either sell out for contact by using this approach, or sell out for power by trying to elevate the ball. But not Simmons. Despite having the highest contact rate of any qualified shortstop last season, Simmons also hit fly balls more than almost any other shortstop, giving him the batted ball profile of sluggers like Jay Bruce or Giancarlo Stanton. This allowed Simmons to rack up 17 dingers with a HR/FB% of just 7.9% last year.

His career HR/FB percentage is 8.1%. As he is still in his age-24 season, let’s say he bulks up a bit and is able to muster out 9.0% of his fly balls for home runs in our hypothetical MVP season. With his batted ball profile and improved plate discipline, this gives us 21 HR for Simmons.

Base running

This was also a weird part of Simmons’ game last year, but in the opposite way than the power. In the minor leagues, he stole 54 bases in a little less than two full seasons of service time. He didn’t have an elite success rate (69%), but he clearly has some speed. In 2013, Simmons stole just six bases and was thrown out five times. That is terrible. He only ran 11 times, which certainly has something to do with his poor success rate, but he also wasn’t getting on base at a very good clip last year. With his improved on-base skills in this exercise, he would have more opportunities to run. Let’s say he improves his success rate a bit, too, and racks up about 15 SB.

Last year, Simmons’ baserunning was estimated to have cost the Braves about -1.6 runs. This includes not only steal attempts, but taking extra bases and being thrown out trying to take extra bases on balls in play. If we assume Simmons is a little more efficient at taking the extra base and steals 15 bags while only being thrown out six or seven times, it’s not hard to imagine Simmons’ baserunning score (BsR) going from -1.6 to +1.5. In other words, from very slightly below average to very slightly above average.

Results

Simmons AVG OBP ISO K% BB% BABIP HR/FB%
MVP Simmons .286 .331 .173 7.5% 6.5% .280 9.0%
Career Simmons .261 .307 .150 8.6% 6.1% .262 8.1%

That’s about all it would take. Really, not that drastic of a difference. It’s improvement in every category across the board, yes, but I don’t think there’s a single one of these that couldn’t happen or appears unrealistic for a really good baseball player in his second season in the MLB at age 24.

Convert his offensive numbers into run values and you get a wRAA of 15.2, a BsR of 1.5 (as we stated earlier) and on defense a UZR of 24.6 (his career average). Yes, this assumes that he repeats his ridiculous defensive numbers from last season which likely aren’t sustainable, but he is Andrelton Simmons, after all, and is kind of in unprecedented territory. If he’s done it once before, he can probably do it again. Adjust all of that for position and park and this gives us our magic number of 7.0 WAR.

With the defensive ability that Andrelton Simmons has showcased thus far in his career, he would just need to hit about .285 with a .330 OBP, 20 homers and 15 steals to be in serious consideration for the NL MVP. Consider, say, Andrew McCutchen and Buster Posey have slight off-years where they fail to accumulate at least 7 WAR and see both of their teams miss the playoffs. As long as the Braves make the postseason, Andrelton Simmons could bring home more hardware than just a Gold Glove in 2014.


2013 Gold Glove Awards Strictly by the Numbers

Every year, at the conclusion of the Major League Baseball season, the MLB hands out awards to many of the games premier players. Every year, these awards are panned by critics and fans alike, usually wondering why their favorite players weren’t chosen.

Perhaps the most condemned award, especially by those of us who are more analytically inclined, is the Gold Glove Award.

After years of Derek Jeter winning Gold Gloves at shortstop, with some Rafael Palmeiros and Michael Youngs peppered in, the Gold Glove Awards pretty much became a joke among the MLB community.

The MLB seemed to catch on to that fact this season and implemented a “sabermetric component” in an attempt to help revitalize the legitimacy of the award.

This year’s Gold Glove finalists were recently announced and, to me, there appears to be progress being made. The inclusion of someone like Juan Uribe shows that the MLB is paying attention to the numbers, as Uribe is not someone who would typically pass the “eye test” that people have long based their defensive judgments on, but in reality was a pretty great defender and has been for the entirety of his 13-year career, especially at third base where he played 900 innings for the Dodgers this season.

However, this is not to say there weren’t still some odd picks in the list of finalists. The managers vote still constitutes a large portion of the selection process and these managers are still using the same “eye test” method, probably mixed in with some offensive contribution, that has controlled the fate of the award since its inception

To me, the eye test is a total cop-out, as no fan, let alone manager, can possibly watch every fielding attempt by every fielder throughout the course of a season through completely unbiased lenses as the advanced defensive metrics do. I will admit that the defensive metrics we currently have are far from perfect. But they at least account for every play on the same fair and unbiased scale for each player.

With that being said, here are what the finalists and winners of the Gold Glove Awards at each position might look like if voting were based strictly off advanced defensive metrics, free of human bias. So as not to overly complicate things, I used four defensive metrics to evaluate players. First, UZR and DRS made up the majority of the basis for my selections as they are the two most accepted and accurate defensive metrics. Though a little outdated, I still like to use RZR as sort of a tiebreaker for when UZR and DRS are too close to call. Then, just because, I included fielding percentage too. Though errors aren’t a good way to measure a defender’s ability or value, it’s safe to say that if a guy never makes an error of the course of a season he was probably pretty good, and if he made a ton of errors he probably struggled.

For catchers, the FanGraphs defense stat was used as a substitute for UZR, and rSB and RPP were used as substitutes for RZR and FP%. Pitchers aren’t included in the study.

Behold:

American League
Catcher – Salvador Perez

Player Inn Def DRS rSB RPP
Salvador Perez 1115.1 16.1 11 4 2.6
Yan Gomes 710.0 11.9 11 7 -1.2
Matt Wieters 1201.0 15.4 -13 2 3.1

The MLB included Perez and Wieters, but also had a weird pick in Joe Mauer. Mauer won the Gold Glove at catcher from 2008-2010, despite never being great behind the dish. These likely came as a result of his offensive achievements. Perez gets the nod here for being the best all-around catcher. Wieters, despite being hated by DRS this year for some reason, was still the league’s best pitch-blocker and has a sound reputation for being a good defensive catcher and pitch-framer. Yan Gomes was the snub at his position, having the most valuable arm behind the plate in the American League.

First base – Mike Napoli

Player Inn UZR DRS RZR FP%
Mike Napoli 1097.1 9.7 10 .876 .994
James Loney 1277.2 6.1 4 .796 .995
Mark Trumbo 1030.2 8.5 2 .780 .992

This was the weirdest one, on both ends of the spectrum. First, the MLB included Chris Davis – who is average at best in the field – and Eric Hosmer, who one might think would be good based on his athleticism but is actually quite terrible. Then, Mike Napoli came out on top on in the numbers. Napoli, a 31-year old lifetime catcher, played his first full season at first base this year. He also was diagnosed with a degenerative hip condition at the beginning of the year that voided his original contract with the Red Sox, and in reality he would have DH’d for almost any team in the AL that didn’t have David Ortiz. He basically had no reason to be good in the field. Yet, no matter what metrics you look at, Mike Napoli was the best defensive first basemen in the American League, and it really wasn’t close.

Second base – Dustin Pedroia

Player Inn UZR DRS RZR FP%
Dustin Pedroia 1398.0 10.9 15 .823 .993
Ben Zobrist 1017.1 10.0 7 .803 .993
Ian Kinsler 1095.1 -1.0 11 .836 .978

Pedroia – who already has two Gold Gloves under his belt – and Zobrist were head and shoulders above the rest of American League second basemen this year. Robinson Cano had a great year defensively in 2012 and rightfully won the Gold Glove. This season, it seems he was included by the MLB more for his reputation and offense, as he didn’t grade out much better than average by any defensive metric. Kinsler wasn’t loved by UZR, but he still had the second best DRS and RZR of any qualified second basemen, which is why he edged out Brian Dozier and Cano for my third finalist.

Third base – Manny Machado

Player Inn UZR DRS RZR FP%
Manny Machado 1390.0 31.2 35 .818 .973
Evan Longoria 1289.0 14.6 12 .742 .972
Josh Donaldson 1373.0 9.9 11 .738 .961

This one was easy. It’s no secret that Manny Machado is incredible defensively, as his conversion from already Gold Glove-caliber shortstop to third base went even better than expected. Longoria and Donaldson were second and third, respectively, in each of the remaining categories, making them easy choices. Notably absent is Adrian Beltre, who has been an elite defensive third basemen his whole career and has won four of the last six Gold Gloves. However, at 34 years old, his age may be starting to wear on him as he posted his first negative defensive season since 2007.

Shortstop – Alcides Escobar

Player Inn UZR DRS RZR FP%
Alcides Escobar 1388.1 10.9 4 .790 .979
Yunel Escobar 1320.0 10.7 4 .782 .989
Pedro Florimon 1099.2 4.3 12 .838 .973

After the AL third base being the easiest choice, the AL shortstops were the hardest. The two Escobars had almost identical stats, and Yunel has been a better defender over his career, but Alcides had a miniscule edge in UZR and RZR. Florimon was also a sneaky choice to rival the two Escobars, as he led all qualified shortstops in both DRS and RZR. J.J. Hardy was a fine choice by the MLB, as he has been one of the premier defenders at shortstop for nearly a decade, but the defensive talent pool at shortstop is deep, as always, and Hardy just missed the cut this year.

Left field – Alex Gordon

Player Inn UZR DRS RZR FP%
Alex Gordon 1364.1 8.6 16 .918 .997
David Murphy 980.1 10.8 8 .859 .990
Andy Dirks 868.2 9.4 6 .938 .991

Gordon has won the American League left field Gold Glove the last two seasons, and will likely win his third consecutive this season. He had the best ARM rating of any qualified outfielder in the American League with above-average range to go with it. The MLB’s selection of Andy Dirks was panned by some analysts, but I find it to be justified as he had the highest RZR of any left fielder with 500+ innings and was second in UZR.

Center field – Lorenzo Cain

Player Inn UZR DRS RZR FP%
Lorenzo Cain 761.1 12.8 17 .949 .996
Jacoby Ellsbury 1188.1 10.0 13 .923 .992
Colby Rasmus 1002.2 11.2 11 .958 .987

Noticing a trend? This is now the third Kansas City Royal deserving of a Gold Glove and we still have one position to go. A hugely important, mostly unnoticed reason for the Royals success this year was that they were baseball’s best defensive team and it wasn’t even close. Their 79.9 team UZR dwarfed the second-place Diamondbacks (51.1) and third-place Orioles (39.9). Cain was one of the main contributors, playing elite defense at arguably the sport’s most difficult position. Ellsbury and Rasmus had great years as well – and were on the field more – but Cain was the best during his time in center, earning him the nod.

Right field – Shane Victorino

Player Inn UZR DRS RZR FP%
Shane Victorino 913.1 25.0 24 .941 .989
Josh Reddick 966.1 16.4 13 .955 .981
David Lough 577.2 10.8 10 .943 .992

This offseason, the Red Sox took part in a current trend in the MLB by throwing away the idea of “corner outfielders” and simply trying to put the best possible athletes – usually natural center fielders – in the three outfield spots. Just a few examples being the Indians with Drew Stubbs (and Michael Brantley to an extent), the Pirates are with Starling Marte and now the Red Sox by signing Victorino to play right field. As you can see, it paid off, as Victorino had easily the best defensive season of any American League outfielder. Also, notice who snuck in at the third spot? David Lough, who racked up a full win’s worth of defensive value in just 577 innings for the, you guessed it, Kansas City Royals.

National League
Catcher – Russell Martin

Player Inn Def DRS rSB RPP
Russell Martin 1051.1 22.5 16 9 4.5
Yadier Molina 1115.1 17.5 12 2 5.9
Welington Castillo 956.0 15.3 19 4 3.1

I know, blasphemy, right? Yadier Molina has won five consecutive Gold Gloves and will probably make it six this year. He is incredible and one of the greatest defensive catchers of all-time. However, Russell Martin is pretty incredible himself and goes greatly unappreciated for his abilities behind the plate. He has a great catcher arm, in fact the most valuable in the MLB this season, and was the third-best pitch blocker in the MLB. While trying to concoct a way to cheat and give this award to Molina, I considered talking about pitch framing, the impact it has on a pitching staff and how that goes undetected in catcher’s defensive stats while Molina might be the best at it. But then I remembered that Martin is a pretty great pitch-framer, too which contributed a great deal to the success of Pirates pitching this year. Molina is a great catcher, but Martin was better this year and it would be pretty cool if he is rewarded for it.

First base – Anthony Rizzo

Player Inn UZR DRS RZR FP%
Anthony Rizzo 1415.0 8.3 16 .871 .997
Adrian Gonzalez 1291.0 5.7 11 .846 .992
Paul Goldschmidt 1446.0 5.4 13 .817 .997

This was only one of two positions with the same three finalists as the three finalists chosen by the MLB. Good job MLB! Yonder Alonso and Brandon Belt are both pretty good with the glove for first basemen, but these three were clearly the best. Something tells me Gonzalez and his three Gold Gloves will end up winning another based on his reputation, but Rizzo was better across the board. Paul Goldschmidt also has a pretty nice showing, proving that he can do just about everything well and is already one of the league’s best players.

Second base – Darwin Barney

Player Inn UZR DRS RZR FP%
Darwin Barney 1237.1 12.5 11 .810 .993
Mark Ellis 950.0 5.4 12 .839 .989
DJ LeMahieu 750.0 6.4 10 .821 .993

You can probably figure that Darwin Barney is a pretty great defender because otherwise why would he play every day for a Major League team. Part of that is probably because it’s the Cubs, but it’s mostly because Darwin Barney is a defensive wizard. You could probably say the same thing about DJ LeMahieu, too, though it doesn’t fully explain why Walt Weiss insisted on batting him second. There’s really not much else I can think to write about this one, besides maybe that the Cubs are kind of like the National League Royals in that we’ve had three positions and already three Cubs, except different in that it didn’t help lead them to any kind of success.

Third base – Juan Uribe

Player Inn UZR DRS RZR FP%
Juan Uribe 900.1 24.0 15 .830 .983
Nolan Arenado 1110.0 20.7 30 .799 .973
Luis Valbuena 760.2 8.3 6 .755 .967

As I mentioned in the intro to this piece, Juan Uribe even being selected as a Gold Glove finalist shows a step in the right direction for the MLB and an even bigger one if he ends up winning it. By looking at him, you might not assess him as an elite defender on account of his, let’s say “shapely,” frame. However, he had a remarkable year at third base for the Dodgers, adding somewhere in the vicinity of two wins with his defense alone. This should not shock anyone, as he has a career UZR/150 of 19.7 at third base in a sample size of nearly 3,000 innings. In addition, he held his own at shortstop for nine years, logging close to 8,000 innings of above-average defense. Not to be lost in all of this is that Nolan Arendo appears to be exceptional at third base too, with a ridiculous 30 DRS in his rookie season that rivals Manny Machado. Also, hey, look. Another Cub!

Shortstop – Andrelton Simmons

Player Inn UZR DRS RZR FP%
Andrelton Simmons 1352.1 24.6 41 .876 .981
Clint Barmes 804.1 8.9 12 .843 .968
Pete Kozma 1051.0 6.7 8 .838 .984

It has been written on this site many times how ridiculous Andrelton Simmons is. He just had maybe the best defensive season ever. Basically, right now, he is to defense what Miguel Cabrera is to offense. He is going to win his first Gold Glove this year, which is a thing that, barring injury, will happen for many, many years to come. He has the potential to build a Hall of Fame career pretty much entirely with his glove, in the vein of guys like Ozzie Smith or Omar Vizquel. The Atlanta Braves are very lucky to have him, and you should watch him play shortstop with any chance you get. /gush

Left field – Starling Marte

Player Inn UZR DRS RZR FP%
Starling Marte 1038.1 10.2 20 .941 .968
Carl Crawford 835.2 8.6 1 .946 .977
Carlos Gonzalez 857.0 7.1 10 .893 .984

As I wrote earlier, by playing Starling Marte in left field the Pirates are also taking part in the current trend of disregarding the preconceived notion of corner outfielders and just putting center fielders in the corners. Having two centerfielders in your outfield is very valuable defensively, and Marte is also an above-average hitter, making his role on the Pirates team a very valuable one. The MLB picked Eric Young Jr. over Carl Crawford, which isn’t a terrible selection as Young had the second highest RZR of any left fielder with 400+ innings and also edged Crawford out in DRS, 2-1. However, those two slight edges over Crawford didn’t make up for Crawford’s 8.6 – 3.9 edge in UZR.

Center field – Carlos Gomez

Player Inn UZR DRS RZR FP%
Carlos Gomez 1242.0 24.4 38 .942 .988
Juan Lagares 819.2 21.5 26 .900 .982
A.J. Pollock 915.2 17.4 15 .920 .992

In addition to Carlos Gomez’s breakout year with the bat, he had an insane year with the glove in center field – one of the main reasons why, along with being one of the game’s elite baserunners, I picked him as my National League runner-up MVP on my Internet Baseball Awards ballot over on Baseball Propsectus. But I’d also really like to talk about that second name there. Some of you may have read Juan Lagares’ name and said, “Who?” My answer to “Who?” would be: “One of my favorite players in baseball after reading Jeff Sullivan’s piece on Lagares and his arm.” Uncovered in that piece, besides who is Juan Lagares, is that Lagares’ arm in center field this season was arguably the most effective arm since we began accumulating advanced fielding data in 2002. Dude has a great arm, but is even better at positioning and taking optimal routes to outfield ground balls by using his experience as an infielder. Lagares shows pretty great range in center, too, and the way he adds value with his arm makes him one of my biggest snubs in the MLB’s selections.

Right field – Gerardo Parra

Player Inn UZR DRS RZR FP%
Gerardo Parra 1042.1 26.6 36 .947 .989
Jay Bruce 1438.2 10.2 18 .968 .991
Jason Heyward 697.2 11.6 15 .947 1.000

Here’s the other position with the same three finalists as the three chosen by the MLB. Good job again MLB! Jason Heyward might have come out on top if he played a full season, but since he didn’t the award is probably Gerardo Parra’s to win. Parra has always been a phenomenal outfielder, but also has always been a part-time player due to his nasty platoon splits at the plate. This year, injuries forced him into the lineup on a nearly everyday basis and he was rewarded with recognition for his abilities in the field.


A Review of Lineup Optimization in 2013: AL

Warning: Very long post ahead.

At some point in time, maybe you’ve complained about the lineup your favorite team’s manager used. Maybe you’ve heard of or considered the concept of lineup optimization. Maybe you’ve heard that an optimized lineup, over the course of a full season, wouldn’t make that big of a difference.

It really doesn’t, but that doesn’t make it any less interesting.

In elementary school I spent precious class time attempting to optimize kickball lineups. I suppose that was my first foray into the world of sabermetrics and general baseball nerdiness.

Now, I tend to visit BaseballPress on a daily basis to check the lineups of every team, just because. Even more now, I am writing a long post regarding lineup optimization in the MLB.

Sky Kalkman wrote a great piece on his interpretation of The Book’s findings on lineup optimization. He summed it up with this:

“…we want to know how costly making an out is by each lineup position, based on the base-out situations they most often find themselves in, and then weighted by how often each lineup spot comes to the plate. Here’s how the lineup spots rank in the importance of avoiding outs:

#1, #4, #2, #5, #3, #6, #7, #8, #9

So, you want your best three hitters to hit in the #1, #4, and #2 spots. Distribute them so OBP is higher in the order and SLG is lower. Then place your fourth and fifth best hitters, with the #5 spot usually seeing the better hitter, unless he’s a high-homerun guy. Then place your four remaining hitters in decreasing order of overall hitting ability, with basestealers ahead of singles hitters.”

Following the conclusion of the Major League Baseball regular season, I took to the task of finding each team’s most common starters and lineups, hypothetically optimizing them and comparing the results by which team theoretically cost themselves the most runs by straying from optimization.

I sorted each team’s hitters by plate appearances, made sure there was a representative of every position and used Baseball-Reference’s batting order archive to find the most common order those eight/nine players appeared in to find each team’s hypothetical “most common” lineup.

Then I plugged that lineup into Baseball Musing’s lineup optimization tool, along with their 2013 OBP and SLG to find the optimized lineup for each team.

It’s far from a perfect science, especially with teams like Oakland who often change their lineup by utilizing platoons, but it’s good enough and I wanted an opportunity to tell people much smarter and more qualified than me how to better do their job.

Behold, the results (where rpg is runs per game, season difference is the amount of runs “lost” from a season’s worth of theoretical lineups to optimized lineup, and rank is the most optimized to least optimized lineups):

Boston Red Sox

Common rpg: 5.448. Optimized rpg: 5.547. Season difference: -16.038 runs.

Rank: 10th AL, 24th overall

2013 OBP SLG Optimal OBP SLG
CF Ellsbury .355 .426 LF Nava .385 .445
RF Victorino .351 .451 DH Ortiz .395 .564
2B Pedroia .372 .415 RF Victorino .351 .451
DH Ortiz .395 .564 1B Napoli .360 .482
1B Napoli .360 .482 C Saltalamacchia .338 .466
LF Nava .385 .445 SS Drew .333 .443
C Saltalamacchia .338 .466 CF Ellsbury .355 .426
3B Middlebrooks .271 .425 3B Middlebrooks .271 .425
SS Drew .333 .443 2B Pedroia .372 .415


Oh, man. Off to a rocky start. Bear with me, folks, they aren’t all this jarring. This is probably the wackiest one that got spit out. The Red Sox obviously would never hit Dustin Pedroia ninth. The Book likes the nine-hitter to be a high OBP, low SLG guy so the top-of-the-order hitters have guys on base when they come to bat. And to be fair, Dustin Pedroia pretty much had the batting profile of a slap-hitter this season. He had the lowest SLG on the team, and his ISO puts his power production below guys like Brandon Crawford and Chris Denorfia. While his great .372 OBP is likely being put to waste in this lineup, Pedroia’s 2013 numbers fit the bill of an optimal #9 hitter when the rest of the lineup is this good.

Tampa Bay Rays

Common rpg: 4.689. Optimized rpg: 4.779. Season difference: -14.580 runs.

Rank: 8th AL, 17th overall

2013 OBP SLG Optimal OBP SLG
CF Jennings .334 .414 2B Zobrist .354 .402
DH Joyce .328 .419 RF Myers .354 .478
2B Zobrist .354 .402 DH Joyce .328 .419
3B Longoria .343 .498 1B Loney .348 .430
1B Loney .348 .430 3B Longoria .343 .498
RF Myers .354 .478 CF Jennings .334 .414
LF Johnson .305 .410 SS Escobar .332 .366
C Molina .290 .304 LF Johnson .305 .410
SS Escobar .332 .366 C Molina .290 .304


I always like Joe Maddon’s lineups. He mixes things up a lot and isn’t afraid to push the envelope. He’s batted catchers high in the order. He’s led off Ben Zobrist, an excellent – but unconventional – leadoff hitter. For a while this year he batted Evan Longoria second, which is quite smart and probably never would have been considered a decade ago. However, Desmond Jennings isn’t an ideal leadoff hitter with a .330 career OBP and Matt Joyce’s .252 BABIP left him with the lowest OBP of his career. Zobrist is the Rays best leadoff hitter and Wil Myers, arguably the Rays most productive hitter, should be higher in the order.

Baltimore Orioles

Common rpg: 4.724. Optimized rpg: 4.814. Season difference: -14.580 runs.

Rank: 9th AL, 19th overall

2013 OBP SLG Optimal OBP SLG
LF McLouth .329 .399 LF McLouth .329 .399
3B Machado .314 .432 1B Davis .370 .634
RF Markakis .329 .356 SS Hardy .306 .433
CF Jones .318 .493 CF Jones .318 .493
1B Davis .370 .634 3B Machado .314 .432
C Wieters .287 .417 DH Flaherty .293 .390
SS Hardy .306 .433 2B Roberts .312 .392
DH Flaherty .293 .390 C Wieters .287 .417
2B Roberts .312 .392 RF Markakis .329 .356


Chris Davis started the season out as the Orioles #5 hitter, because no one yet knew he would transform into some sort of robot humanoid. Once the transformation was well underway, Buck Showalter continued batting Davis fifth and a struggling Nick Markakis third, likely because “if it ain’t broke, don’t fix it,” and the idea that moving a hot batter to a different spot in the order could somehow throw him out of his groove. It took the Orioles until the middle of August to move Davis into the three-hole and by then Davis’ low spot in the order relative to his production likely cost them a handful of runs. Given the disparity of his OBP compared to his teammates, he’s even better suited for the two-hole.

New York Yankees

Common rpg: 3.978. Optimized rpg: 4.077. Season difference: -16.038 runs.

Rank: 1th AL, 25th overall

2013 OBP SLG Optimal OBP SLG
CF Gardner .344 .416 CF Gardner .344 .416
RF Suzuki .297 .342 2B Cano .383 .516
2B Cano .383 .516 1B Overbay .295 .393
DH Hafner .301 .378 DH Hafner .301 .378
LF Wells .282 .349 SS Nunez .307 .372
1B Overbay .295 .393 RF Suzuki .297 .342
SS Nunez .307 .372 3B Nix .308 .311
3B Nix .308 .311 LF Wells .282 .349
C Stewart .293 .272 C Stewart .293 .272


This isn’t the Yankees lineup we’re used to after the last couple months, or really after the last decade. But as Yankees fans well know, it is the lineup we saw for the majority of the season. Sorry you had to see this again, Yankees fans. The Yankees did hit Robinson Cano in his more deserved second-position for a period of time, but it was basically out of necessity as they had no other real hitters to work with. Instead, Ichiro Suzuki spent the majority of the time in the two-hole seemingly on reputation alone, despite being the third-worst candidate for the spot on a team full of Jayson Nix, Eduardo Nunez and Lyle Overbay’s.

Toronto Blue Jays

Common rpg: 4.791. Optimized rpg: 4.914. Season difference: -19.926 runs.

Rank: 14th AL, 29th overall

2013 OBP SLG Optimal OBP SLG
SS Reyes .353 .427 SS Reyes .353 .427
LF Cabrera .322 .360 DH Encarnacion .370 .534
RF Bautista .358 .498 CF Rasmus .338 .501
DH Encarnacion .370 .534 RF Bautista .358 .498
1B Lind .357 .497 1B Lind .357 .497
C Arencibia .227 .365 3B Lawrie .315 .397
CF Rasmus .338 .501 LF Cabrera .322 .360
2B Izturis .288 .310 C Arencibia .227 .365
3B Lawrie .315 .397 2B Izturis .288 .310


Like the Rays and Yankees, the Blue Jays experimented for a bit this season and batted Jose Bautista #2. Like the Rays and Yankees, this was very smart. Like the Rays and Yankees, they inexplicably stopped their experiment and reverted to a more traditional lineup. Melky Cabrera was not a good hitter this year, yet there he sits in the most important spot of our hypothetical lineup, while the Blue Jays have three great #2 candidates in Edwin Encarnacion, Bautista and even Adam Lind, who was basically “slow Jose Bautista” this season. Burying Colby Rasmus‘ .500 SLG in the seven-hole also didn’t help. And, no, that isn’t a typo. J.P. Arencibia really finished with a .227 OBP this year.

Detroit Tigers

Common rpg: 5.375. Optimized rpg: 5.510. Season difference: -21.870 runs.

Rank: 15th AL, 30th overall

2013 OBP SLG Optimal OBP SLG
CF Jackson .337 .417 DH Martinez .355 .430
RF Hunter .334 .465 3B Cabrera .442 .636
3B Cabrera .442 .636 2B Infante .345 .450
1B Fielder .362 .457 1B Fielder .362 .457
DH Martinez .355 .430 SS Peralta .358 .457
LF Dirks .323 .363 CF Jackson .337 .417
SS Peralta .358 .457 C Avila .317 .376
C Avila .317 .376 RF Hunter .334 .465
2B Infante .345 .450 LF Dirks .323 .363


OK, this one is actually kind of genius. Although OBP is far more important than speed in regards to a leadoff hitter, speed still kind of matters. You probably don’t want your slowest player batting leadoff, especially if you have a burner in the two or three spot. But the Tigers already have the slowest team in baseball, by far, and Miguel Cabrera is their ideal two-hitter. Since Victor Martinez won’t be holding Miggy up on the basepaths, putting his .355 OBP in front of Miggy is actually really smart, especially considering Miggy hits a first-inning homer like half the time anyway. Austin Jackson’s baserunning ability is better suited towards the bottom of the lineup for singles hitters like Alex Avila, Torii Hunter and Andy Dirks. Because of this wildly unconventional lineup, the Tigers ranked last in the study, and I would really love to see this lineup actually get played out.

Cleveland Indians

Common rpg: 4.456. Optimized rpg: 4.509. Season difference: -8.586 runs.

Rank: 2nd AL, 7th overall

2013 OBP SLG Optimal OBP SLG
CF Bourn .316 .360 C Santana .377 .455
1B Swisher .341 .423 2B Kipnis .366 .452
2B Kipnis .366 .452 LF Brantley .332 .396
C Santana .377 .455 1B Swisher .341 .423
LF Brantley .332 .396 SS Cabrera .299 .402
SS Cabrera .299 .402 DH Reynolds .307 .373
DH Reynolds .307 .373 RF Stubbs .305 .360
3B Aviles .282 .368 3B Aviles .282 .368
RF Stubbs .305 .360 CF Bourn .316 .360


As an Indians fan who was constantly frustrated by Terry Francona’s lineups, their rank in the study surprised me. However, the Indians problem was more with player selection, not lineup order, which isn’t reflected in the study. The Indians best statistical hitter, Ryan Raburn, amassed only 277 PA’s and didn’t make the cut. Yan Gomes, the Indians second best hitter, eventually began receiving his well-deserved playing time, but still finished with just 322 PA’s and missed the cut. To start the season, the Indians buried Carlos Santana‘s great OBP in the six-hole and wouldn’t move Asdrubal Cabrera’s putrid OBP out of the top of the order. But Francona fixed his mistake early enough for it not to be reflected in the years end most common lineup. And in that lineup, the Indians did a good job by having their top five hitters be their highest OBP guys. Michael Bourn was not the leadoff hitter the Indians thought they were signing, and was actually a pretty bad one with a .316 OBP. Santana and Jason Kipnis are much more deserving choices to lead off, though in real life I would likely flip-flop them, considering speed.

Kansas City Royals

Common rpg: 4.094. Optimized rpg: 4.204. Season difference: -17.820 runs.

Rank: 13th AL, 27th overall

2013 OBP SLG Optimal OBP SLG
LF Gordon .327 .422 DH Butler .374 .412
1B Hosmer .353 .448 1B Hosmer .353 .448
DH Butler .374 .412 LF Gordon .327 .422
C Perez .323 .433 C Perez .323 .433
CF Cain .310 .348 RF Lough .311 .413
3B Moustakas .287 .364 SS Escobar .259 .300
RF Lough .311 .413 CF Cain .310 .348
2B Getz .288 .273 3B Moustakas .287 .364
SS Escobar .259 .300 2B Getz .288 .273


Despite performing poorly in the study, the Royals two lineups were actually pretty close, and theoretically they could have earned themselves a handful more runs by simply swapping Billy Butler and Alex Gordon’s spots in the lineup. I have always loved Gordon as an unconventional leadoff hitter, but this season he stopped taking walks and getting hits on 35% of his balls in play, leading to a pedestrian .327 OBP after posting marks of .376 and .368 the last two seasons. Butler had a weird year, too, as he started walking all the time and lost all his power, posting a lower isolated slugging percentage than David Lough. But Butler is one of the slowest players in baseball and Eric Hosmer is a pretty good baserunner, especially for a first basemen, so swapping their orders in the optimized lineup might make more sense.

Minnesota Twins

Common rpg: 4.301. Optimized rpg: 4.379. Season difference: -12.636 runs.

Rank: 5th AL, 12th overall

2013 OBP SLG Optimal OBP SLG
2B Dozier .312 .414 LF Willingham .342 .368
C Mauer .404 .476 C Mauer .404 .476
LF Willingham .342 .368 DH Doumit .314 .396
1B Morneau .315 .426 1B Morneau .315 .426
DH Doumit .314 .396 2B Dozier .312 .414
3B Plouffe .309 .392 3B Plouffe .309 .392
RF Arcia .304 .430 SS Florimon .281 .330
CF Thomas .290 .307 RF Arcia .304 .430
SS Florimon .281 .330 CF Thomas .290 .307


Blame slugging percentage for this one. Joe Mauer should really be the Twins leadoff hitter. But, since slugging percentage is flawed in its attempt to represent power by including singles – something Mauer hits a ton of – Mauer has over 100 points of SLG on Josh Willingham, leading the generator to believe Willingham is a more ideal leadoff hitter despite Mauer’s .404 OBP. We all know that Willingham is more of a power hitter than Mauer, which is why we should always use ISO to measure power, where Willingham edges Mauer .159 to .156 even on a down season. Other than the mistake of batting Brian Dozier leadoff, though, the Twins real-life lineup does a pretty great job, with their OBPs falling in descending order after Dozier. If this lineup generator used ISO instead of SLG like I wish it would, flip-flopping Mauer and Willingham at the top would likely be the optimal order for the Twins.

Chicago White Sox

Common rpg: 3.950. Optimized rpg: 4.030. Season difference: -12.960 runs.

Rank: 6th AL, 14th overall

2013 OBP SLG Optimal OBP SLG
CF De Aza .323 .405 CF De Aza .323 .405
SS Ramirez .313 .380 RF Rios .328 .421
RF Rios .328 .421 3B Gillaspie .305 .390
1B Dunn .320 .442 1B Dunn .320 .442
DH Konerko .313 .355 LF Viciedo .304 .426
3B Gillaspie .305 .390 SS Ramirez .313 .380
LF Viciedo .304 .426 DH Konerko .313 .355
2B Keppinger .283 .317 C Flowers .247 .355
C Flowers .247 .355 2B Keppinger .283 .317


Alejandro De Aza isn’t a great leadoff hitter with a .323 OBP, but when you have the fourth worst team OBP in baseball, .323 will do. The main problem with the White Sox order is their two-hole, as is the problem with most MLB lineups. Alexei Ramirez’s offensive skill set is basically the exact one that MLB managers are beginning to move away from in the 2-hole, with his .313 OBP, complete disappearance of power and newfound penchant for stealing bases. Contrary to conventional wisdom, good base stealers are better suited for the 6/7 spots in the lineup. Risking outs with your best hitters at the plate, who are more likely to drive you in with extra base hits anyway, is not a good idea. With that aside, the White Sox did well by choosing the correct leadoff hitter and keeping their worst hitters at the bottom of the order.

Oakland Athletics

Common rpg: 4.933. Optimized rpg: 4.989. Season difference: -9.072 runs.

Rank: 3rd AL, 8th overall

2013 OBP SLG Optimal OBP SLG
LF Crisp .335 .444 3B Donaldson .384 .499
SS Lowrie .344 .446 SS Lowrie .344 .446
CF Cespedes .294 .442 DH Smith .329 .391
1B Moss .337 .522 1B Moss .337 .522
3B Donaldson .384 .499 C Norris .345 .409
DH Smith .329 .391 CF Cespedes .294 .442
RF Reddick .307 .379 LF Crisp .335 .444
C Norris .345 .409 RF Reddick .307 .379
2B Sogard .322 .364 2B Sogard .322 .364


Surprise! The Oakland Athletics scored well in a SABR-slanted study. And this doesn’t even take into account how well the A’s optimize their lineup on a daily basis by correctly utilizing platoons. But either way, in this theoretical lineup, the A’s do a good job by getting their second and fourth hitters correct. Though breakout player and MVP-candidate Josh Donaldson is better suited to lead off, Coco Crisp was still a good option. And whether incidental or not, Yoenis Cespedes‘ low OBP in the three-hole doesn’t hurt them too much, as OBP isn’t as important in the three-hole as conventional wisdom would tell you. The A’s do well in this study with the lineup provided for them, and do even better in real life by putting the right guys on the field every day.

Texas Rangers

Common rpg: 4.481. Optimized rpg: 4.582. Season difference: -16.362 runs.

Rank: 12th AL, 26th overall

2013 OBP SLG Optimal OBP SLG
2B Kinsler .344 .413 2B Kinsler .344 .413
SS Andrus .328 .331 3B Beltre .371 .509
RF Cruz .327 .506 1B Moreland .299 .437
3B Beltre .371 .509 RF Cruz .327 .506
C Pierzynski .297 .425 C Pierzynski .297 .425
1B Moreland .299 .437 CF Martin .313 .385
LF Murphy .282 .374 DH Profar .308 .336
DH Profar .308 .336 LF Murphy .282 .374
CF Martin .313 .385 SS Andrus .328 .331


Ian Kinsler is another guy who doesn’t scream “prototypical leadoff hitter,” basically in the sense that he’s not a speed-first centerfielder, but he is a pretty great one and easily the Rangers best option. So you have to give them credit for sticking with him instead of going to the more conventional, “easy” choice of Elvis Andrus or Leonys Martin. However, the Rangers lose a lot of value by keeping the speedy Andrus in the two-hole, a spot he really wasn’t suited for this season with a career-worst .327 OBP. Adrian Beltre is the perfect fit for the Rangers #2 hitter, and Andrus is better suited for the bottom of the order. With Andrus’ basestealing abilities, I think it would be wiser to switch his spot with Jurickson Profar’s in this optimized lineup, giving Andrus the opportunity to attempt steals with the 8th and 9th hitters up, rather than the 1st and 2nd.

Los Angeles Angels of Anaheim

Common rpg: 4.864. Optimized rpg: 4.945. Season difference: -13.122 runs.

Rank: 7th AL, 15th overall

2013 OBP SLG Optimal OBP SLG
LF Shuck .331 .366 C Iannetta .358 .372
CF Trout .432 .557 CF Trout .432 .557
1B Pujols .330 .437 RF Hamilton .307 .432
RF Hamilton .307 .432 1B Pujols .330 .437
DH Trumbo .294 .453 2B Kendrick .335 .439
2B Kendrick .335 .439 SS Aybar .301 .382
3B Callaspo .324 .347 LF Shuck .331 .366
C Iannetta .358 .372 DH Trumbo .294 .453
SS Aybar .301 .382 3B Callaspo .324 .347


This one is similar to Detroit’s, but unlike Detroit’s, this one probably only works in theory. When Miggy is batting second and the entire team is slower than molasses in an igloo, I think you can get by with a slow-running, high-OBP guy like Victor Martinez leading off. When your #2 hitter is Mike Trout, you’re probably costing yourself extra bases on would-be Trout doubles and triples by having Chris Iannetta on first in front of him, likely having just drawn a leadoff walk. If Iannetta weren’t so slow and Trout weren’t so fast, Iannetta would actually be a pretty great leadoff hitter. Of all players with 350+ PA this season, only Joey Votto posted a higher BB% (18.6) than Iannetta (17.0). The Angels did do the right thing by putting Trout where he belongs in the two-hole, though. A .432 OBP is great for leadoff, but when you hit for more power than Giancarlo Stanton and Adam Dunn, some of those extra base hits go to waste leading off.

Seattle Mariners

Common rpg: 4.382. Optimized rpg: 4.439. Season difference: -9.234 runs.

Rank: 4th AL, 9th overall

2013 OBP SLG Optimal OBP SLG
SS Miller .318 .418 3B Seager .338 .426
2B Franklin .303 .382 DH Morales .336 .449
3B Seager .338 .426 RF Saunders .323 .397
DH Morales .336 .449 1B Smoak .334 .412
LF Ibanez .306 .487 LF Ibanez .306 .487
1B Smoak .334 .412 2B Franklin .303 .382
RF Saunders .323 .397 C Zunino .290 .329
C Zunino .290 .329 SS Miller .318 .418
CF Ackley .319 .341 CF Ackley .319 .341


The Mariners began the season with Dustin Ackley at second base and Brendan Ryan at shortstop. By the beginning of June, Ackley had hit himself back to AAA and not much later, the Mariners cut ties with Ryan’s offensive deficiencies in favor of rookies Brad Miller and Nick Franklin. Both held their own with the bat from the get-go, earning themselves the top two spots in the Mariners everyday lineup. However, despite holding their own, neither are really top of the order hitters with sub-.320 OBPs and just average power. Better suited for the top spots are the Mariners best player, Kyle Seager and most productive hitter, Kendrys Morales. Still, the Mariners performed well in the study, likely due to the similar profiles of most of their hitters.

Houston Astros

Common rpg: 4.133. Optimized rpg: 4.176. Season difference: -6.966 runs.

Rank: 1st AL, 3rd overall

2013 OBP SLG Optimal OBP SLG
LF Grossman .332 .370 LF Grossman .332 .370
2B Altuve .316 .363 C Castro .350 .485
C Castro .350 .485 2B Altuve .316 .363
1B Carter .320 .451 1B Carter .320 .451
DH Pena .324 .350 3B Dominguez .286 .403
RF Martinez .272 .378 CF Barnes .289 .346
CF Barnes .289 .346 DH Pena .324 .350
3B Dominguez .286 .403 RF Martinez .272 .378
SS Villar .321 .319 SS Villar .321 .319


The Astros place third in the study basically by default. It’s not hard to identify your best players and construct a near-optimal lineup when you’ve only got two league-average bats. Just put your best hitter, Jason Castro, in the two-hole, bat Chris Carter fourth to drive in runs and lead off your next highest OBP guy, who believe it or not is a one “Robbie Grossman” and the rest basically doesn’t matter because none of them are very good. Robbie Grossman is actually the most deserving leadoff batter on a real team in the Major League of Baseball. #Astros

Coming soon: Part 2, with National League lineups and conclusion.