Archive for Lineups

Edwin’s New Home

Edwin Encarnacion’s eight-year stint with the Jays is over, as he has decided to move his talents to Cleveland. This leaves a gaping hole in the Jays lineup. During his six and a half seasons in Toronto, he accumulated 239 homers and 679 RBI while hitting for an average of .268. He reinvented his career when he made the switch to first base five seasons ago, as he began to play with more confidence. He has had a higher fielding average than the rest of the league at his position since he started playing 1B in 2011 — however, his defense is nothing to write home about.

Edwin will likely be replaced with Justin Smoak and Kendrys Morales. Smoak was able to swat 14 homers with 34 RBI in just 299 at-bats, and with more plate appearances, he will be capable of cutting into the missing 42 homers and 127 RBI Edwin produced last season. Furthermore, Morales hit 30 homers with 93 RBI, which are closer to Edwin’s numbers, and with the move to a more hitter-friendly field, Morales may actually be able to replicate similar numbers. It is also important to note that right-handed hitters fare better at Rogers Centre, and Morales seems to hit the ball better from the left side, as his wRC+ is 115 hitting from the left and 109 from the right. As far as WAR goes, however, Edwin’s total through 11 seasons is 27.6, while Kendrys only has 8.4 in 10 years, and Smoak has a WAR of  0.2 through six years. In this sense, Edwin has left his old home with a gaping hole.

The Tribe, however, will be happy landing this heavy-hitting righty. Mike Napoli is yet to sign this offseason, so at this point Edwin will likely share time between first base and DH with Carlos Santana. The Indians ranked 10th in the AL with 185 homers last season, thus, Edwin’s bat will help with the lack of power in their lineup. Moreover, Encarnacion’s 3.9 WAR will make him the third-most valuable hitter (tied with Jose Ramirez) in the lineup.

A three-year contract locks Edwin in Cleveland until age 36, but the 33-year-old has shown no signs of slowing down, as his WAR has hovered around 4 since turning 29. His cumulative WAR was only 7.4 in his first six seasons, compared to a WAR of 20.2 in his past five. The three-year contract still seems most favorable to Cleveland, as, if he sees a drop in numbers next season, he will have a year to recover, and if he is unable to they can drop him in 2020. For Edwin, if the Tribe is not able to replicate the success they had last season, he is stuck watching his prime go down the drain. However, with the addition of Andrew Miller, and the experience the pitching rotation gained from their run in the postseason this past October, there is no reason the Indians should not produce the same success.

So, Edwin’s new home may be a breath of fresh air for the slugger, as his power will not be outshone by a lineup of heavy hitters. And he is still with a team that gets on base a lot, and a pitching staff that has the capability of being one of the best in the majors. Additionally, playing half of his games at Progressive Field will not hurt, as he should be able to hit a few moonshots over the shallow eight-foot wall in right field.

At any rate, Edwin’s acquisition has pushed the Indians into being arguably the projected best team for the 2017 season, and it should be a cake walk to finish first in the AL Central, especially compared to the AL East Edwin is used to. He might have found a home more suitable than the one across the border.


The State of the Yankees

As a Yankees fan (albeit one that has only witnessed their 2009 World Series), I have never been more excited about the team’s present and future. With the MLB roster slowly filling with good, young talent, and with even more stirring circumstances in the minors, the Yankees have the potential to be another powerhouse team.

The Team

Right now, the Yankees are in the midst of a revolution. Out with the old (A-Rod and Teixeira) and in with the new (Sanchez, Judge and Austin). Despite missing out on the playoffs, they will feature a well-rounded lineup at the start of next year.

It’s safe to say that Gary Sanchez won’t enjoy quite the success he did in the last two months of this season. Actually, he won’t come close. This isn’t to say he will play poorly, it’s just that he played so well that he can’t come back to those levels. However, Sanchez will no doubt still be one of the better-hitting catchers in the MLB with average to plus defense behind the dish, so they will already be better in that position in 2017 than they were in 2016.

The Yankees infield is the most likely to change the least with only Greg Bird slotting in at first base. Didi Gregorious, Starlin Castro and Chase Headley are each under team control until at least 2018, and there isn’t anyone challenging them for their spots at the moment. At first base, though, I say it is most likely that Bird gets the spot because it is possible that Tyler Austin beats him out in spring training. Austin is more likely to be used as a quasi-utility player as he can play at first, in right field and DH.

In the outfield everything could remain the same as the end of the season with Hicks or Judge in right, Ellsbury in center and Gardner in left. It could also see some changes. Gardner and Ellsbury both have the potential to be traded over the offseason with Gardner the more likely of the two. There are options to fill those gaps if trades do happen. Mason Williams could fill in until Clint Frazier is (hopefully) ready later in the season. Hicks, Austin and Judge could also fill the holes if needed.

The Yankees pitching is the most worrisome issue. The starting pitching, that is. Masahiro Tanaka performed well in 2016, so there is no reason to think otherwise for the next year. Beyond that, though, are question marks. Nate Eovaldi will probably be a non-tender after his Tommy John surgery. Pineda had his usual ups and downs. Sabathia is still getting older. Then there are numerous options in Luis Severino, Chad Green, Luis Cessa and Bryan Mitchell. Severino will be given the longest look because of his end to the 2015 season, but it’s a toss-up from there.

The bullpen in New York is still a quality one despite trading away Aroldis Chapman and Andrew Miller. Dellin Betances is one of the best in the game, so that’s a good start. Tyler Clippard, Adam Warren and whoever misses out on the rotation gig will presumably fill in the rest with a lefty thrown in.

The Minors

Now comes the most exciting part of the Yankees. With a system that starts with four top-30 prospects despite Sanchez already graduating, the Bombers are on their way to a good future. Frazier is in AAA and still needs to put up good at-bats before he gets the call to the majors, but that time will come soon enough. Gleyber Torres and Jorge Mateo will likely start the year in AA, so they won’t be seen until 2018 most likely, especially with the likes of Gregorious and Castro blocking them. Beyond their top three guys, the Yankees still have plenty of players who could make a major-league impact once it’s their time. Simply, there is a lot to be excited about when it comes to the team’s future.

The Yankees will have the 17th overall pick in next year’s draft, so they will be in familiar position after having the 16th and 18th picks in the two previous years. Their first-round picks in recent years have both been ones that I personally like, but who wouldn’t? James Kaprielian is shining in the Arizona Fall League and Blake Rutherford looks like a steal at the 18th pick, especially after his hot start to his pro career. This year will hopefully prove to be another that produces some good picks.

The Offseason

With the Yankees pretty much set with position players, there’s no reason to add any pricey free agents. It also wouldn’t be wise to block some of their young players out to prove themselves or ones that are close to ready in the minors. Pitching is another story.

As I stated before, their starting pitching has question marks when it comes to Sabathia’s age, Pineda’s consistency and Severino bouncing back. There also aren’t many pitchers on the free-agent market that stand out. Overpaying for Rich Hill would be contradictory to what the Yankees are trying to do in becoming younger, but his dominance when healthy is something that can’t be questioned. It wouldn’t be a bad move to sign him, but it would add yet another question mark to their rotation due to his injury history. Signing him also wouldn’t help any towards getting under the luxury tax, which Steinbrenner would like to do.

The only free-agent acquisition that I would like to see is a top-notch reliever, which means one of Chapman, Kenley Jansen or Mark Melancon. Jansen is likely going back to the Dodgers and Melancon would be yet another righty for the bullpen. A reunion with Chapman would be the best move. Pairing him with Betances again would put the bullpen in great shape. It’s just that it will cost a lot.

In terms of trading, I am one that is all for trading Gardner, Ellsbury and/or Brian McCann. Ellsbury’s contract probably means he’s staying, but Gardner will be easy to move if Brian Cashman can get the right return. Some reports have said that a swap of him for a middle-of-the-rotation pitcher could work, and that would be just what the Yankees need. McCann will have high demand this offseason with multiple teams needing catchers and not enough free agents to go around. The Yankees will have to eat a good chunk of his contract to get anything of value in return, but it shouldn’t be a problem as they’d be shedding a good portion of his $17-million-per-year contract. It would also give younger players like Bird, Austin and Judge a chance to DH.

The Braves have been said to want a reunion with McCann but won’t trade Mike Foltynewicz for him. The Yankees will do well if they can eat about half of his contract and get a couple middling prospects with some upside.

With such a deep farm, the Yankees also have the ability to trade for a front-of-the-rotation starter. Landing one of the top guys on the trade market probably isn’t in their best interests, though. To get one of Chris Sale, Chris Archer or Sonny Gray will cost a good portion of what the Yankees were able to get for Chapman and Miller. Instead, they should look to trade from depth for a guy that is a step down from the others. With Torres looking like the better middle-infield prospect, trading Mateo as the headliner of a package for a starter would be a good move and won’t impact the team’s future too much.

In Summary

In an ideal scenario, the Yankees will sign one of the top relievers to pair with Betances, stand pat on other free agents and see how Cashman can work the trade market for a third straight offseason. The Yankees likely aren’t a top contender next season, but the potential is there. If things break right with Judge, Bird, Sanchez and the rotation, they could find themselves at the top of the A.L. East. Right now, though, they should look to continue development of their top-three farm system and look at 2018 as the year to really contend.


The Future of the Angels

Any fan that is somewhat invested in the game of baseball understands the importance of putting both a good team on the field at the MLB level while also sustaining an adequate farm system. The Angels have done neither.

This is a hard thing to do when the best player in baseball plays for you, but Arte Moreno and the Angels have managed to do that. Let’s take a look at how they ended up in this dire situation.

MLB Team

One thing the Angels do have (sorta) is a good core of players. They have Mike Trout, Kole Calhoun, Andrelton Simmons and Garrett Richards. Trout and Simmons play at premium positions, Calhoun is a good two-way player and Richards has ace potential (given his arm doesn’t snap). They even have quality players in Yunel Escobar and C.J. Cron who are quietly productive. With the exception of Escobar, each of those players are controllable for the next several years. The team isn’t devoid of talent behind Mike Trout like some believe. They also have a few starting pitchers who have either shown success or are promising in Matt Shoemaker, Tyler Skaggs, and Andrew Heaney. The only problem is that Heaney is done for next year already and Skaggs may be too if his stem-cell therapy doesn’t work.

The holes in the team are at second base, left field, starting pitching spots that aren’t guaranteed and the bullpen. Especially the bullpen. The only true bright spot of their bullpen is Cam Bedrosian while everyone else is expendable at best (unless Huston Street can return to form).

Now that we’ve looked at their roster heading into next season, how can they fix it?

Win-Now Options

Moreno has to let Billy Eppler spend some money this offseason. He isn’t paying Jered Weaver or C.J. Wilson anymore. That leaves them with roughly $30 million to spend before hitting the luxury tax, which Moreno has made clear he won’t go over. One thing this offseason is sure to provide is offense.

Obvious fixes would be to sign Yoenis Cespedes and one of Justin Turner — which would move either him or Escobar to second — or Neil Walker. The Angels can’t go another year with below-replacement-level players at those positions if they truly want to win. The smart route for them would be to avoid what are likely to be excessive bidding wars for Cespedes and Turner. Walker is a great fit at second for them. He offers good offense from the left side to couple with their righty-heavy lineup as well as average defense to a team that has seen paltry turnouts at the position.

As for left field, their are plenty of corner outfielders on the market. However, instead of paying too much for a reunion with Mark Trumbo, the Angels should look at Ian Desmond, Dexter Fowler and Carlos Gomez. Desmond and Fowler failed to garner much interest last offseason, so an offense-heavy free-agent class should keep their price tags down. As for Gomez, he was DFA’d by the Astros before playing somewhat better with the Rangers. Gomez is the higher risk/reward player while Fowler is the closest to a sure bet to perform consistently. Desmond is a wild card since he just converted to the outfield and profiled as below average in center. Shifting him to left with Trout in center could improve his defense, so he is also a viable option. The Angels took huge risks in the past that didn’t turn out well, so Fowler is probably their best option. Plus he adds another lefty bat against righties.

If the Angels can manage to add both Walker and Fowler, their offense would actually fill the basic requirements for a successful team. They would have a leadoff hitter in Fowler, and a number two in Calhoun, with Trout in the three slot. Either Cron or Pujols will bat fourth and fifth with Walker behind them. Then some mix of Escobar, Simmons and their catcher in the 7-9 spots.

As for fixing the rotation, that will be much harder, and they might just have to wait out the storm or go over the luxury tax. Overpaying for Jeremy Hellickson or Ivan Nova would be a bad move and Rich Hill isn’t a good fit for a fairly old roster that already has its risks. Henderson Alvarez could be a good bounce-back candidate after missing 2016 following a shoulder surgery. Andrew Cashner could be an option in a pitcher-friendly park in Anaheim, though the one in San Diego didn’t do him much good. Going into the season with Richards, Shoemaker, Skaggs, Nolasco and one of Alex Meyer, Nate Smith or Daniel Wright isn’t the end of the world. It just has its risks.

What about the farm?

Minor Leagues

According to RosterResource.com, the Angels have 11 home-grown players on their 40-man roster. That’s definitely on the lighter side compared to most teams, but it isn’t quite as extreme as the Padres’ six. They also only have six free-agent signings, which isn’t too large of an amount. The part of their roster that stands out is their eight waiver claims. The fact is that the Angels didn’t have the depth to fill their own roster with players already within their organization.

Going back to the team’s free-agent signings, six isn’t a large amount as I stated before. However, some of their more recent signings have been very costly (both in terms of monetary and baseball value). In the offseason prior to the 2012 and 2013 regular seasons, they signed Albert Pujols, C.J. Wilson and Josh Hamilton. Each of these players cost north of $15 million per season. Each also cost the team draft picks. They lost two first-round picks and a second-round pick.

The teams’ most recent top picks most likely aren’t going to make an impact with the MLB team. For one, Sean Newcomb definitely won’t since he’s on the Braves now. Taylor Ward and Matt Thaiss were both very weak first-round picks. Ward won’t hit and Thaiss is basically limited to first base.

This isn’t to say the Angels have nothing in the minors. Jahmai Jones is promising but very young and a few of their other 2016 picks could develop into good MLB players, including Brandon Marsh and Nonie Williams. Their farm isn’t deep enough to trade for any key pieces though, and they shouldn’t do that even if they did have the pieces. Eppler has a chance to use a top-10 pick this year as well as future picks to try and build the strong farm that the Angels have lacked for so long, so he can’t waste that opportunity on a middling team.

In Summary

I feel that I’ve laid out the best-case scenario for the Angels next year with potential signings of Walker and Fowler, who would fit in very nicely with their current lineup. Any team with Mike Trout has a chance to be successful after all. They will need to sign those two players first, and then the rotation needs to have luck on its side with the injury situations. The bullpen is a clear gap in the roster, so safe signings over the offseason could complement Bedrosian and possibly Street. Their farm system is also a clear work in progress, but it isn’t empty in terms of talent. That talent is just a little ways off at the moment. Overall the future of the Angels seems dreadful, but if things break right they can be a contender next year. Their overall run differential was only 18 apart from the first-place Rangers, so they at least played in close games. Now all that needs to be done is execution by the players and by the front office to bring a winner back to Anaheim.


Should David Ortiz Play First Base In the World Series?

I have the mixed blessing of living in New England, so I unavoidably run into local sports radio once in a while. They’re already looking ahead to the Red Sox’ inevitable World Series appearance, and of course given David Ortiz’s unprecedented combination of offensive skills and just incredible foot pain/immobility, there’s a legitimate question of whether the Red Sox should play him in the field when they lose the DH in World Series road games. Just a quick-hit here on some of the relevant numbers.

I’m not going to address in this article the extent to which playing the field might limit his ability to hit or run. I don’t dispute that that could be significant, but I have no idea how to value that.

The way I see it, there are three options:

1. Move Hanley Ramirez over to 3B, play Ortiz at 1B, take Travis Shaw out of the lineup.
2. Replace Ramirez with Ortiz at 1B, keep Shaw.
3. Don’t start Ortiz, but do pinch-hit with him in a high-leverage situation.

We’ll make the following assumptions: I’m going to estimate that Ramirez will have the same defensive value at 3B that he had last year in LF (-22.9 runs), and I’m going to further estimate that Ortiz will have the defensive rating of some of the worst 1Bs in baseball over the past few seasons (-25 runs). Travis Shaw was worth 6.6 runs of defense playing mostly 3B this year. Ortiz was worth 27.6 runs of offense + baserunning, Ramirez 17.1, and Shaw -10.3. We’ll estimate that playing Ortiz would get him 4.4 plate appearances per start, whereas if he doesn’t start, he gets one plate appearance in a situation that has a leverage index of 2.

Scenario 1: Ortiz gives you 2.6 runs at 1B, Ramirez -5.8 runs at 3B, total of -3.2 runs.
Scenario 2: Ortiz gives you 2.6 runs at 1B, Shaw -3.7 runs at 3B, total of -1.1 runs.
Scenario 3: Ramirez gives you 1.8 runs at 1B, Shaw -3.7 runs at 3B, and Ortiz gives you 27.6*(1/4.4)*2 = 12.5 runs at PH, total of 10.6 runs.

Seems like the best option here by a decently wide margin is to use him as a pinch-hitter, and I’m surprised at how much of the value comes from just the pinch-hit appearance. Fairly robust to my assumptions, too — if you assume a leverage index of 1 in his one plate appearance, you still get the highest total with Ortiz as a PH. You could also give him a defensive rating of -15 (which would be incredibly generous) and the PH scenario comes out on top. Anything else I’m missing? Other lineup options for the Red Sox?


Constructing a Lineup for the Blue Jays

Jose Bautista recently came off the DL for a second time this year. John Gibbons has stated that he will predominantly DH and not occupy his usual spot in RF (this is good news if you’re a fan of the Blue Jays or a fan of outfield defense in general). But perhaps the bigger question is, where in the lineup is he going to hit? Last year he was their No. 3. He then moved to the leadoff spot, and he’s even hit second for 10 games this year.

The reason this is even a perceived issue is that Devon Travis has looked quite decent in the leadoff spot in Bautista’s absence. But let’s get something straight: Travis is no Bautista. Coming into the 2016 season, Bautista’s numbers compared to every other human in MLB since 2010 have him 1st in HR, 4th in wRC+, 3rd in wOBA, 3rd in runs scored, and 2nd in BB%. That’s spectacular. The issue has become do you keep both Travis and Bautista at the top of the lineup and simply shift Josh Donaldson and Edwin Encarnacion down one slot?

That’s the reason I started thinking about this; I was perplexed that both Bautista and Travis were going to be put ahead of Donaldson and Encarnacion. The idea that the Blue Jays’ two best hitters would be moved down the lineup for a player with just about a full season of MLB under his belt, and another who’s had a little more than 80 plate appearances since late June didn’t add up. This is a pennant race, supposedly the most critical time of the year.

Don’t get me wrong, this isn’t about dumping on Bautista, or even Travis. They’re great and good hitters, respectively. It’s about maximizing the production of your lineup. So before I moan and let everyone know my opinion is best, I thought I’d look at the data and let the numbers speak for themselves.

Hitting statistics from 2002 to 2015 were gathered and filtered by batting order. This produced 420 cases (each team the last 14 years) with six variables per place in the batting order (variables were: wOBA, BB%, ISO, wRC+, OBP, & HR). Data was then analyzed utilizing multiple regression analyses to identify what metrics at different spots in the order best predicted team runs. Results can be seen below.

View post on imgur.com


Figure 1. R2 values for total team runs with wOBA values for each spot in the batting order.

The most obvious component of Figure 1 is the drop in R2 for the 3rd place hitter. At first this may seem counter-intuitive, as it’s typically assumed that your 3rd place hitter is the team’s best.  And as that that player goes, so should the team. But the most likely rationale is that most teams, regardless of how awful or great they are, can typically muster at least one decent hitter. They place that hitter 3rd and away they go. Think about the Blue Jays and the Tigers in 2015 — they had Miguel Cabrera and Jose Bautista. So comparing Cabrera and Bautista’s 2015 stats shows an edge for Cabrera with a .413 wOBA compared to Bautista’s .389. Yet the Blue Jays vastly outscored the Tigers. This is because good to great teams have more than one “3rd place hitter.” And they apparently stack them 2nd and 4th in the order. In fact, these two spots in the batting order combined to account for slightly more than 50% of the variance explained when analyzing team runs (using the 2nd and 4th place hitter’s wOBA).

So if a team like the Blue Jays can afford to have Jose Bautista taking up the “menial” 3rd spot in the order, shouldn’t they do it? The mean wRC+ and wOBA for No. 3 hitters in the AL last year was 116 and .351. Bautista, who’s having a down year by his standards, has a wRC+ of 115 and wOBA of .346 as of August 29th. ZiPS has him closing out the year with a wRC+ of 132 and wOBA of .369, well above league average. So it could work.

But does Bautista hitting 3rd help them?

Well, since Donaldson has the best offensive numbers (and is the reigning MVP), the offense should be built around him. And the 2nd and 4th spots in the order are the most crucial in the presented team-runs-scored analysis, so we’re going to move forward with the idea that Donaldson hits 2nd. A runs-scored model that predicts the amount of runs a player will score when batting in the #2 spot can be seen in Figure 2.

View post on imgur.com

Figure 2. Predicted runs for the #2 hitter by actual runs scored. Using wOBA values for all 9 hitters [((315.5*wOBA2)+(132.15*wOBA3)+(65.6*wOBA4)+(71.63*wOBA5))-100].

This analysis produces an R2 value of .7 and incorporates, in order of model entry, the wOBA of: the 2nd hitter, 3rd hitter, 4th hitter, and 5th hitter respectively. The variables that enter are quite sensible; the greatest amount of variability of the 2nd hitters runs scored is the wOBA of that hitter. Followed by the next three spots in the lineup, all in sequential order. If this is done for each spot in the lineup the same pattern emerges. Where the hitter’s own wOBA is the greatest source of runs-scored variability and the 2-3 hitters following him account for an additional ~20%.  So essentially, if you want to score runs, bunch your hitters together. Don’t spread them out, and don’t try to place a poor hitter in the middle to get him more fastballs. Stick all of your threats in a row.

But is there a specific combination of clustering? Predicting how many runs Donaldson will score in a season, depending on the order of Bautista and Encarnacion around him, reveals the following results: 132 runs/season where the order is JB – JD – EE, 130 runs/season where the order is JD – EE – JB, and 129 runs/season where the combination is JD –JB – EE.  Again, this is the number of runs scored specifically by Donaldson when batting in the 2nd spot of the order. These results reveal error-term differences between combinations, something that wouldn’t be significant over the remaining ~30 games of the season. So as long as they’re clustered together it’s fine. This indicates that sensible lineup options have JB – JD – EE batting in succession, with Donaldson occupying the 2nd spot, and with some combination of Travis, Troy Tulowitzki, and Russell Martin surrounding them (pending on matchups/splits/who’s hot/etc.).

If clustering these three hitters together is the option, the question that follows will invariably be: who leads off? Answer — It really doesn’t seem to matter (as long as that person isn’t Kevin Pillar). Using a similar run-prediction model has Travis, Martin, Tulo, Saunders, Bautista, & Upton all averaging over 110 runs/season when batting leadoff having JD and EE behind them.


Lineup Construction is Changing

Lineup construction is a topic that comes up far more often in proportion to how important it is. But if you can save a few runs in a year by using the proper lineup, it’s worth it. Put your OBP up top, not your steals. The #2 hitter should be better than your #3.

With 14 going on 15 years of lineup splits available on FanGraphs, are any trends clear? Yes, actually. In regards to the two specific issues above, managers do seem to be getting better. Let’s explore. (Note: All “league averages” are non-pitchers. Pitchers aren’t real hitters, after all.)

The on-base percentage of leadoff hitters vs. the league average has climbed. In 2002, the league average OBP was .336 whereas it was just .332 for leadoff hitters. Ten years later, in 2012, league average was .324 but leadoff hitters hit .344. The gap has begun to decline since then, but the trend is still apparent, and in 2016 leadoff hitters have a .332 OBP vs. the league’s .324. Overall, here’s a simple chart of the league’s leadoff OBP minus the overall average OBP for each year since 2002:

Not everyone has caught on; either Dusty Baker or Ben Revere really need to figure things out soon for the Nationals, for example. But leadoff hitters are getting better at getting on base.

Meanwhile, managers have a longer way to go in their understanding of the fact that a #3 hitter will most often find themselves batting with the bases empty and two outs which, naturally, is not a good situation for scoring runs. However, just by comparing the wRC+ of the league’s #2 and #3 hitters shows that some teams are learning. In the dark days of 2002, #2 hitters had a wRC+ of 92, compared to 128 for #3 hitters. Since then, #2 hitters haven’t been that bad, but they haven’t been great, either. However, the last three years have been #2 hitters’ most productive since 2002: they had a 102 wRC+ in 2014, 107 in 2015, and currently a 105 in 2016. Teams haven’t moved their best hitters out of the three hole (this will be #3 hitters’ seventh straight year with a wRC+ of 120 or better), but they are starting to see the value of a good #2 hitter. This has led to the wRC+ gap between #2 and #3 hitters to exhibit a clear downward trend since 2002:


Even if you take out that 2002 season, the trend holds. It is still basically due to a change in the past two years, but the more hitters like Andrew McCutchen or Manny Machado, Corey Seager or George Springer bat in that second spot in the order and have success, the more we can expect out of the two hole. A lot of these #2 hitters, you might note, are young guys with a lot of career ahead of them with their current teams. It’s up to managers to keep them at #2 instead of moving them to #3 as these players continue in their careers. They may not, leaving 2015 and 2016 as anomalies so I can be wrong again. (Actually, I’m never wrong, because where’s the fun in that?)

But next time you lament the general failures of managers to put out the correct lineup, remember, things are getting better. Maybe it’s just your favorite team’s manager.


Speculating the 2016 Toronto Blue Jays Lineup

We’re halfway through November and the winter meetings are right around the corner. Teams are gearing up for next year and taking a look at their rosters, deciding what direction they want their team to head. Today I want to look at the Toronto Blue Jays and hypothesize a direction they could go.

The Blue Jays had a great 2015 and continuing that momentum is crucial for the newly recharged fan base. They have a number of quality young players who contributed this past year. Kevin Pillar, Chris Colabello, Ryan Goins, Marcus Stroman, Roberto Osuna and Devon Travis (when healthy) all had nice seasons and remain under team control in some shape or form for the next 3-5 years. The Jays also have some large expiring contracts after the 2016 season in the form of R.A. Dickey, Edwin Encarnacion and Jose Bautista who have been important pieces to Toronto’s success. Add in Russell Martin, Josh Donaldson and Troy Tulowitzki and the Blue Jays should once again compete in the AL East in 2016. One of the glaring issues however is their starting rotation and bullpen.

With Marco Estrada signed the Blue Jays have a starting rotation of Dickey, Stroman, Estrada and Hutchison. Reports have come out and the Jays will reportedly have a similar budget to last year, around $140 million. After the guaranteed contracts, arbitration estimates and league-minimum salaries are accounted for the Blue Jays will have about $18-$19 million to spend on starting pitching and bullpen help. There are a number of directions the Blue Jays could go; it’s a solid class of starting pitching this year and with the $18 million left in the salary they could for sure pick up a quality starting pitcher to fill out the rotation. They could also spent the money on a lockdown relief pitcher and try to transition either Aaron Sanchez or Roberto Osuna to the rotation. Or they could split up the money and get an older starting pitcher and get whatever reliever is available for the remainder of the money. Another option, and the one that I’m going to explore, is the trade route.

With all the moves the Blue Jays made at the deadline, their farm system isn’t as strong as it was at midseason last year but the recent developments with the Atlanta Braves got me thinking about trade ideas — mainly Julio Teheran. With the Braves set to open a new stadium in 2017 the mentality has been to shed money and stock prospects for the opening season in the new stadium. This works out great for the Blue Jays who have some talent left in the farm system that could be useful to the Braves. The fourth-ranked prospect in the Blue Jays system and coincidentally the fourth-ranked catching prospect in baseball is Max Pentecost. Atlanta has been stocking arms in recent trades but with Christian Bethancourt struggling in his time in the majors, the Braves clearly don’t have a long-term solution behind the dish. The former 1st round pick, 11th overall is currently in advanced-A ball and his estimated time of arrival in the majors is 2017, perfect for their rebuilding plans. If the Jays were to include one maybe two young pitchers on a similar timeline like Conner Greene and/or Marcus Smoral, perhaps that would be enough to pluck Teheran away from Atlanta.

Teheran is only 24 years old and will turn 25 for the 2016 season. He’s owed a bargain-basement price of $3,466,666 for next season, is under contract through 2019, and has a club option for 2020. With starting pitcher salaries estimated anywhere from $10-$25 million and up this offseason, Teheran and his $3.5 million in 2016 season seem like a steal. Plus the Blue Jays would be getting Teheran for the prime years of his career and although last year was an off year, he’s shown signs of being an ace. Teheran would complete the starting rotation for the Jays in 2016 and after Dickey’s contract expires, Toronto would be left with a rotation of Stroman, Teheran, Hutchison and Estrada for the 2017 season. The other nice thing about Teheran is that his $3.5 million contract leaves Toronto with roughly $15.5 million left over to fill out the bullpen or upgrade other areas. Teheran would be an affordable and valuable piece to a rotation that desperately needs it and would be far better then spending 3 to 4 times his annual 2016 salary on a pitcher that may already be or not far away from the decline of his career.

As I mentioned above, with the money saved on the Teheran trade, the Blue Jays could add a piece to the bullpen or upgrade other areas but in compiling data for this article, I got to thinking about what the Jays could do for the future. 2017 has roughly $36 million coming off the books for Toronto and with a young core of controllable players, the Jays have some room to make a move. One of the contracts expiring is RF Jose Bautista. I personally think the Jays should re-sign Bautista after 2017 but I don’t think putting him in right would make sense. With Encarnacion’s contract set to expire as well, the DH spot would be available for Bautista, should he choose to stick around. That would leave RF empty and looking at the outfield class of 2017 (Beltran, Suzuki, Gregor Blanco, Josh Reddick, Brandon Moss, Mark Trumbo and of course Bautista) the group leaves something to be desired.

That brought me to the 2016 class, led by arguable the best right fielder in the game, Jason Heyward. The Jays have been rumored to be after SP free agents David Price and Zack Greinke but for the amount of money they’ll command and the stages they’re at in their career, I think the money might be better spent on a player whose best days are ahead of him. That in my opinion is Jason Heyward. We know Heyward is a solid player, who’s shown flashes of brilliance and is young enough to still put it all together consistently. In a lineup like the Blue Jays’, Heyward would thrive much the way Josh Donaldson officially broke out as a superstar last year. Heyward would have the protection and opportunities to truly develop into the player he’s about to get paid to be. The problem with signing Heyward would be the Blue Jays would have to free up a sizable amount of money and the only real place to look is at shortstop in the form of Troy Tulowitzki.

Tulowitzki was a surprise addition for the Blue Jays last year and definitely added strength to an already dangerous lineup but with the depth that Toronto has with Ryan Goins able to play SS and the return of Devon Travis, the 31-year-old Tulowitzki becomes an expensive option for the remainder of his career. Perhaps the Jays should trade Tulowitzki to free up money to sign Heyward to a long-term deal? Instead of watching the expensive decline of Tulo for the remainder of his contract, Toronto could still sell high to a team willing to take on the contract, receiving bullpen help and possibly an extra outfielder to help address current needs.

I then started going through MLB teams to see which ones would possibly be in a situation to make the trade happen. The Diamondbacks, White Sox and Mets all stood out as possible suitors while the Rangers, Yankees, Padres and Mariners also seemed like possible options. For the purposes of this article I’m only going to focus on the first three.

With a 2015 budget of about $76,622,575 million the Arizona Diamondbacks definitely have room to financially take on Tulo’s contract; the question is, is that where LaRussa and Dave Stewart want to take the team? None of us truly know but if the asking price is right, perhaps Randall Delgado and Ender Inciarte, maybe the thought of Tulo and Goldschmidt would fit their plans. They did spend $68.5 million for 6 years of Yasmany Tomas and with the emergence of David Peralta and A.J. Pollock, the Diamondbacks have outfielders to spare. If the trade were to go through the Blue Jays would gain about $18,487,000 giving them a total available amount of about $33,980,334. That would definitely be enough to sign Heyward to a 7-10 year deal (depending on what the market drives his year amount to) at anywhere from $20-$29 million per season. With the $36 million coming off the books in 2017, Toronto would have about $37 million to spend on the DH spot (Possibly Bautista) and SP or RP spot open (depending on how they handle Sanchez and Osuna). Compared to the $50 million amount they could have in 2017 minus whatever they pay for a starting pitcher this off season. In reality that $50 million would probably be more like $30-$35 million with two rotation spots available as well as the DH. If the Teheran trade and Heyward signing were to happen, here is what the 2016 and 2017 Blue Jays lineup would look like.

2016 Lineup                2017 Lineup

C = R. Martin                C = R. Martin
1B = E. Encarnacion    1B = C. Colabello
2B = D. Travis              2B = D. Travis
3B = J. Donaldson       3B = J. Donaldson
SS = R. Goins                SS = R. Goins
LF = B. Revere              LF = B. Revere
CF = K. Pillar                CF = K. Pillar
RF = J. Heyward         RF = J. Heyward
DH = J. Bautista          DH = ?

SP = R.A. Dickey                 SP = M. Stroman
SP = M. Stroman                 SP = J. Teheran
SP = J. Teheran                   SP = D. Hutchison
SP = D. Hutchison            SP = M. Estrada
SP = M. Estrada                   SP = ?

RP = R. Osuna                     RP = R. Osuna
RP = A. Sanchez                  RP = A. Sanchez
RP = L. Hendricks              RP = L. Hendricks
RP = B. Cecil                        RP = B. Cecil
RP = R. Delgado                  RP = R. Delgado
RP = S. Delabar                   RP = S. Delabar
RP = A. Loup                        RP = A. Loup

BN = E. Inciarte                   BN = E. Inciarte
BN = J. Thole                        BN = D. Pompey
BN = C. Colabello                 BN = ?
BN = D. Barney                     BN = ?

If Heyward’s contract was structured so that his first year was set at $20 million, the Jays would enter 2016 with about $13-$14 million left in the budget for any additional moves. It would also shore up right field a year before it’s an issue while upgrading the bullpen and perhaps leading the way for Sanchez or Ozuna to enter the rotation for 2017. The point is Toronto has money coming available next year but in order to get the player that best fits their future needs, they might have to make a move now instead of waiting till next year.

The next team I thought might make sense as a trade partner was the Chicago White Sox, who recently released long time SS, Alexi Ramirez. The White Sox had a budget of $118,860,487 in 2015 and were supposed to be contenders with the additions of Melky Cabrera, Jeff Samardzija, David Robertson and Adam LaRoche but instead fell way short and put together an all-around forgettable season. With the release of Ramirez, shortstop seems to be an area of need for Chicago, and Tulowitzki with Abreu, Cabrera and LaRoche would be a great fit on the south side.

Unlike the Diamondbacks however the White Sox don’t have as much potential new money available, so off-setting the cost of Tulo’s contract would have to be taken into account when thinking about a trade. Someone like Zach Duke, who is owed $5,000,000 over the next two years might be a good addition to the Toronto bullpen. If the Sox would somehow include often-injured Avisail Garcia, this trade might really swing in Toronto’s favor but really saving money for a Heyward run would be more important then any name on the back of a jersey.

For argument’s sake I’m going to use the Duke/Garcia for Tulowitzki trade as an example. The difference in salaries would be about $12.7 million and that added to the $15,493,334 left over after the Teheran trade, Toronto would have about $28,193,334 left over to make Heyward an offer. And again, if the contract was structured so that the first year paid Heyward $20 million, the Blue Jays would have about $8 million left over for additional offseason/mid-season upgrades.

The last team that I thought would make sense for a potential Tulo trade was a team that was linked to him while he was still in Colorado, the New York Mets. Coming off a spectacular run to the World Series, the Mets are set to lose Yoenis Cespedes and Daniel Murphy to free agency. In 2015 they had a payroll of $120,415,688 and Cespedes and Murphy combined for $11,729,508 of that total budget, over half of what Tulowitzki is owed going into 2016. For the Mets, their quality rotation is under team control or earlier arbititration for the next few years, so continuing the winning environment at a fraction of the cost is of utmost importance. The health of David Wright is suspect and with a nice young group in Conforto, d’Arnaud, Duda, and Lagares, trading for someone of Tulo’s caliber might help their development and continue the winning environment.

The Mets would be in the same situation that the White Sox are — they can’t add too much salary, so off-setting costs would play into the equation. If the Mets traded Jonathan Niese, who’s owed about $9 million in 2016, and Kirk Nieuwenhuis, they’d clear about $10,688,729. Add that with the money saved from letting Murphy and Cespedes walk and they could easily bring in Tulowitzki’s contract. The Blue Jays would have about $26 million to work with and again, if Heyward’s first year was set at $20 million, they’d have about $6,182,063 to work with for offseason/mid-season upgrades.

All of this is unauthorized speculation but I do think that the Blue Jays are in a unique situation where they can really make some moves that could set them up for years of success. Chasing the big-name starting pitchers may seem like the obvious move but taking advantage of other team’s situations could allow them to acquire elite talent for minimal cost and the money saved on starting pitching could be used to solve future needs that aren’t quite here yet. As always, thanks for reading and let me know what you think.


How Game Theory Is Applied to Pitch Optimization

The timeless struggle between pitcher and batter is one of dominance — who holds it and how. Both players use a repertoire of techniques to adapt to each other’s strategies in order to gain advantage, thereby winning the at-bat and, ultimately, the game.

These strategies can rely on everything from experience to data. In fact, baseball players rely heavily on data analytics in order to tell them how they’re swinging their bats, how well they’ll do in college, how they’ll perform at Wrigley versus Miller.

Big data has been used in baseball for decades — as early as the 60s. Bill James, however, was the first prominent sabermetrician, writing about the field in his Bill James Baseball Abstracts during the 80s. Sabermetrics are used to measure in-game performance and are often used by teams to prospect players.

Baseball fans familiar with sabermetrics, the A’s, and Brad Pitt have likely seen Moneyball, the Hollywood adaptation of Michael Lewis’ book. The book told the story of As manager Billy Beane’s use of sabermetrics to amass a winning team.

Sabermetrics is one way baseball teams use big data to leverage game theory in baseball — on a team-wide scale. However, by leveraging their data through the concepts of game theory on a smaller scale, baseball teams can help their men on mound out-duel those at the plate.

Game theory studies strategic decision making, not just in sports or games, but in any situation in which a decision must be made against another decision maker. In other words, it is the study of conflict.

Game theory uses mathematical models to analyze decisions. Most sports are zero-sum games, in which the decisions of one player (or team) will have a direct effect on the opposing player (or team). This creates an equilibrium which is known as the Nash equilibrium, named for the mathematician John Forbes Nash. What this means is that if a team scores a run, it is usually at the expense of the opposing team — likely based on an error by a fielder or a hit off a pitcher.

In the case of pitching, game theory — especially the use of the Nash equilibrium — can be used to predict pitch optimization for strategic purposes. Neil Paine of FiveThirtyEight advocates using big data and sabermetrics to analyze each pitch in a hurler’s armory, then cultivating the pitcher’s equilibrium — the perfect blend of pitches that will result in the highest number of strikeouts, etc.

Paine has gone so far as to create his own formula, the Nash Score, to predict which pitcher should throw which pitches in order to outwit batters.

In perfect game theory, the Nash equilibrium states that each game player uses a mix of strategies that is so effective, neither has incentive to change strategies. For pitchers, Paine’s Nash Score uses their data to find the optimal combination of pitches to combat batters, including frequency.

Paine does point out that creating this kind of equilibrium in baseball can be detrimental to a pitcher. He is, after all, playing against another human being who is just as capable of using game theory to adapt strategies to upset the equilibrium.

If a pitcher’s fastball is his best, and his Nash Score shows that he should be using it more often, savvy hitters are going to notice. “ . . . In time, the fastball will lose its effectiveness if it’s not balanced against, say, a change-up — even if the fastball is a far better pitch on paper,” writes Paine.

In this case, a mixed strategy is the best — in game theory, mixed strategies are best used when a player intends to keep his opponent guessing. Though pitch optimization using Paine’s Nash Score could lead to efficiency, allowing pitchers to throw fewer pitches for more innings, it could also lead to batters adapting much quicker to patterns, thus negating all the work.


Where to Bat Your Best Hitter: A Computational Analysis (Part 1)

Prior to the August, 2015, non-waiver trade deadline, the Toronto Blue Jays sent their leadoff hitter Jose Reyes to the Colorado Rockies for Troy Tulowitzki, a classic middle-of-the-order bat. Everyone assumed from his career power numbers that Tulowitzki would slot in the heart of the Jays order, but with Josh Donaldson, Jose Bautista, and Edward Encarnacion already comfortably set at 2-4 (over 200 RBIs between them at the time) they instead used him in the vacated leadoff spot. The move seemed to work as Tulo went 3 for 5 in his first game, and the Jays proceeded to rattle off a tidy 11-0 streak with their new top-of-the-order guy.

Troy Tulowitzki
Shortstop B/T: R/R
.297 / .370 / .510
29 HR 100 RBI 8 SB
TT José Reyes
Shortstop B/T: B/R
.290 / .339 / .432
12 HR 65 RBI 50 SB
JR

One doesn’t mess with success, but everyone knows Tulowitzki is not an ideal leadoff hitter, never having batted there before in his 10-year MLB career, and with all of 3 stolen bases in the last 3 seasons. His above-average pop suggests a traditional run-producing spot: 29 HR and 100 RBI career numbers over an averaged 162-game season (Baseball-Reference.com), but with the Jays on a 22-5 tear, Tulo, touch wood, wasn’t moving anywhere.

A leadoff hitter naturally gets more at bats per season, one reason Jays manager John Gibbons gave for putting Tulowitzki at the top of the order, given his career .297 BA and .370 OBP. But tradition and common sense dictate that top RBI men are more valuable with men on base, impossible for a leadoff man in the first inning, and presumably sub-optimal afterwards. As Tulowitzki’s new teammate 3B Josh Donaldson noted in the midst of an August run that saw the Jays go from 6 back of the Yankees to 1 1/2 up in the AL East, “I feel like every time I’m coming up I have someone in scoring position or someone on base.” Exactly.

Fine-tuning a lineup is an argument for the ages, but can we determine where a power hitter should bat, where his numbers best fit 1 to 9? Should high-average batters hit before the sluggers, or should we just bat 1-9 in order of descending batting average (or OBP)? Can we calculate how to arrange a team’s lineup to maximize the optimum theoretical run production?

Enter Monte Carlo simulations, used to model the motion of nuclei in a DNA sequence, temperatures in a climate-change projection, even determine the best shape and size of a potato chip. In Do The Math!, Monte Carlo simulations were used to calculate where a Monopoly player will most likely land (Jail and Community Chest, followed by the three orange properties: St James, Tennessee, and New York), and whether to hit or stick in Black Jack against any dealer’s up card.

In some cases, algebraic probabilities are difficult (using Markov chains, a continuously iterative system with a finite countable sample space), whereas brute force computation does the trick over a large number of trials. If a picture is worth a thousand words, a simulation is worth a thousand pictures.

BOO V1 (Batting Order Optimization Version 1) is a Monte Carlo program written in Matlab that randomly selects a hit/out event over a 9-inning, 27-out game, averaged over a large number of games, e.g., 1 million. It uses a flat lineup where all hitters have a .333 OBP (roughly the Jays average), but doesn’t include errors, hit batsmen, sacrifices, double plays, stolen bases, etc., or opposing pitchers’ numbers. (In Part II, I will include the hitting stats of a real lineup: 1B, 2B, 3B, HR, BB, K, GO/AO.)

The mathematical guts are fairly simple, essentially a random number generator and some modulo math (think of leap-frogging 3 or more chairs at a time in a circle of 9), and elegantly captures some interesting trends, in particular, the distribution of end-game batters 1-9 and thus the most likely batter to end a game. From such a simulation, we can calculate where best to slot a team’s best hitter to maximize his chances of coming to the plate with the game on the line, another stated reason for putting Tulo in the Blue Jays number 1 spot.

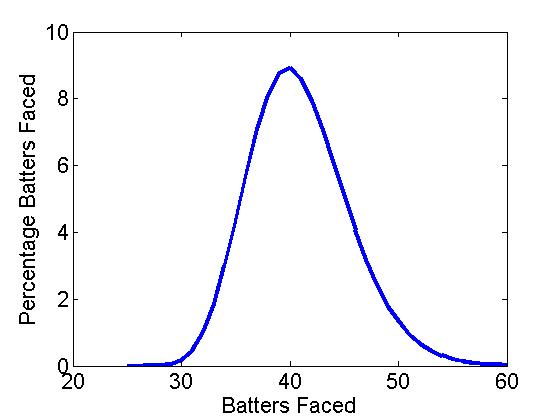
Figure 1a shows the distribution of batters faced (BF) over 1,000,000 simulated BOO games, where the most likely end was 40 batters faced followed by 39 and 41 (the 3-5 hitters), as might be expected with a hard-wired OBP = .333 (binomial p = .33). It seems the custom of having your clutch hitters in the 3-5 slots matches the computational results.
BOOFigure1a BOOFigure1b

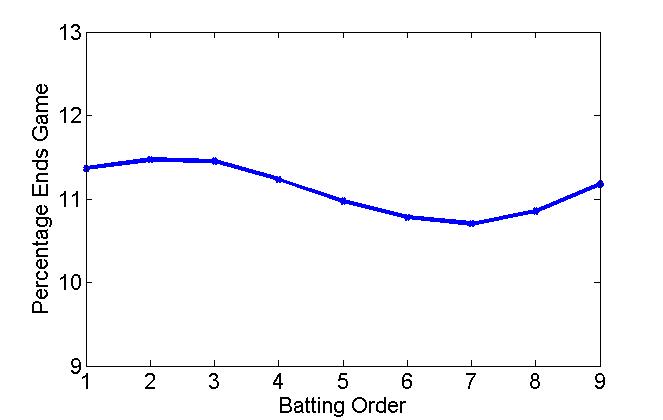
Figure 1a: Distribution of # of batters faced   Figure 1b: Distribution of end-game batters

Interestingly, however, the leadoff hitter doesn’t end a game more often than a middle-order batter. Figure 1b shows the distribution of end-game batters (EGB) for a 1-9 lineup, and is perhaps counter-intuitive. In fact, the number 2 and 3 hitters are more likely to end a game than the leadoff hitter, while there is an obvious dip 3-7. Table 1 shows the frequency of end-game batters 1-9 (number and percentage).

1 2 3 4 5 6 7 8 9
# of games ended 18.4 18.6 18.6 18.2 17.8 17.5 17.3 17.6 18.1
% games ended 11.4 11.5 11.5 11.2 11.0 10.8 10.7 10.9 11.2

Table 1: Number of games ended and percentage versus lineup position (OBP = .333)

Initially, I expected a constant drop-off from 1 to 9, or perhaps following some form of a Benford’s Law distribution, for example, in the wear pattern on a ATM pad or the leading digit in a collection of financial data (1 appears about 30%, 2 about 18%, 3 about 12%, 4 about 10%, . . . , and 9 about 5%). Note, if the data were randomly distributed, each number would appear 11.1% or 1/9. But the modulo aspect of a repeated baseball lineup creates another distribution, one that has a clear maximum after the leadoff spot and a mid-lineup dip at batter number 7.

Of course, the leadoff hitter will always have more plate appearances over an entire season, but somewhat surprisingly does not end a game more often. Table 2 shows the number of at bats 1-9 averaged over a 162-game season (I have assumed 8.5% of plate appearances are walks). As can be seen, the leadoff hitter gets about 130 more ABs than the number 9 hitter, or 21% more per season, reason enough to put your best hitter at the top of the order. From one batter to the next, however, the difference is only about 17 ABs (monotonically decreasing), about an extra AB every 10 games. Not that much difference one spot to the next.

1 2 3 4 5 6 7 8 9
# of ABs 757 740 723 706 689 673 657 641 625
% ABs 12.2 11.9 11.6 11.4 11.1 10.8 10.6 10.3 10.1

Table 2: Number of ABs and percentage ABs over 162 games (OBP = .333)

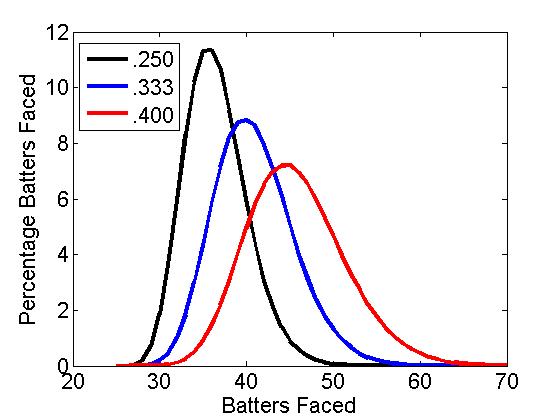
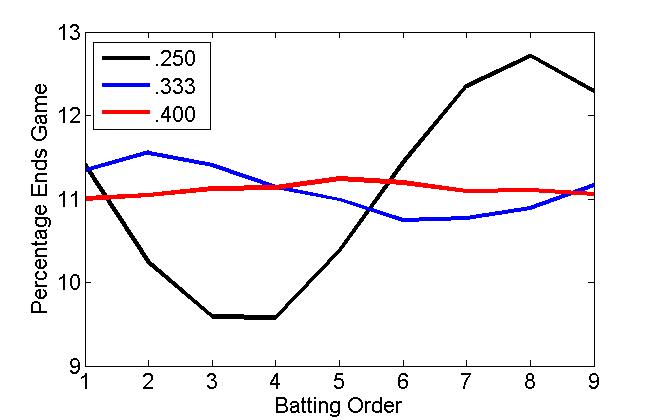
Using BOO, we can also analyse how the EGB distribution changes for a good and a bad team, modelled using an OBP of .250 and .400. The results are shown in Figure 2 including our .333 OBP team. Here, it seems that the lineup order matters more on a bad team than a good team (a practically flat EGB). Indeed, it is often said that you can run any lineup out with a good team. Conversely, losing teams are always juggling their lineups to find the right mix.
BOOFigure2a BOOFigure2b

Figure 2a: Distribution of # of batters faced   Figure 2b: Distribution of end-game batters (OBP = .250, .333. .400)

Of course, baseball is not just statistics over a large number of sample-sizes (or simulations). Baseball is played in bunches and hunches. It would take a little over 400 years to play 1,000,000 games in a 30-team, 162-game schedule. Matchups, streaks, situational hitting, and team chemistry may be more important than any theoretical trends. And, of course, a real, non-flat, batting lineup (which I’ll look at in Part II).

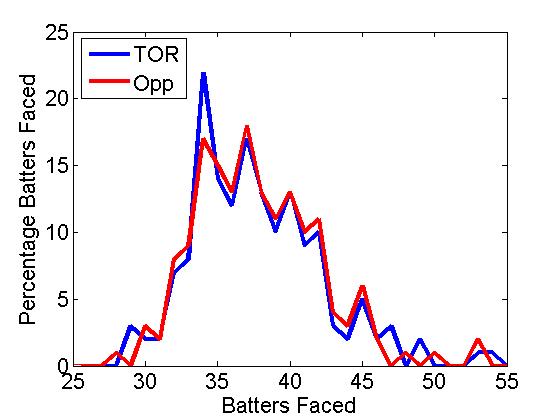
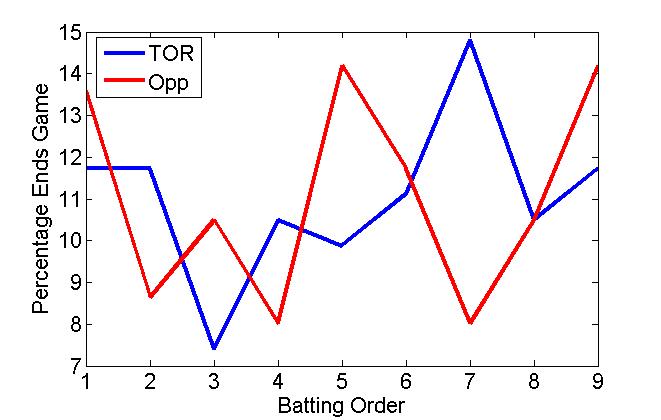
In an actual BF and EGB distribution for the 2014 Toronto Blue Jays and their opponents over a 162-game season, we see the small-sample versions of our super-sized theoretical distributions (Figure 3). The actual BF distribution is comparable to the theoretical binomial/Gaussian BF, though positively skewed, showing the effect of blowouts, not adequately covered in the hit/out simulation. The EGB distribution seems quite random, but late peaks may indicate the use of pinch hitters in the closing parts of a game. It is also interesting to note that BOO “throws” a perfect game about once every 10 seasons, a bit less than the official 23 over the last 135 years.
BOOFigure3a BOOFigure3b

Figure 3a: Distribution of # of batters faced   Figure 3b: Distribution of end-game batters (2014 Toronto Blue Jays and opposition)

So do the calculations mean anything? According to the numbers, your best hitter should bat 2 or 3, that is, if you want him coming up more often with the game on the line. In “The Batting Order Evolution,” Sam Miller noted that “the anecdotal evidence is strong” to put your best hitter in the number 2 spot. The worst spot for heroics is number 7.

Furthermore, a classic run producer such as Troy Tulowitzki shouldn’t bat leadoff, something the Jays found out after he struck out 4 times, almost a month to the day after acquiring him. Dropping him to the number 5 spot, the manager John Gibbons stated, “Maybe this’ll jump-start him a little bit.” Or maybe, he saw the wisdom of inserting the 2014 NL hit leader and speedster Ben Revere in the leadoff spot and using Tulowitzki’s power in a proven RBI position.

Mind you, with a scorching hot lineup that has scored 100 more runs than the next-best hitting team, it may not matter who bats where. That is, if the game is on the line.

Do The Math! is available in paperback and Kindle versions from the publisher Sage Publications, on-line at Amazon.com, and on order at local book stores. Do The Math! (in 100 seconds) videos are on You Tube.


The Leadoff Hitter: Is Speed the Answer?

Classical baseball line-up construction involves putting your fastest player in the lead-off spot. This is due to the belief that speed generates runs (a la Rickey Henderson). In order to test this theory I went back to 1998 (since the last expansion) and looked at how may runs were scored in each season and then looked at 3 indicators, OBP, wOBA and stolen bases to test which indicator would be most useful in predicting runs. Although OBP and wOBA are very similar stats I decided to include both of them in the analysis because of differences in calculation. To put simply OBP gives a home run the same weight as a single and considers them equal (which they are not) while wOBA gives different types of hits more weight (see the OBP and wOBA pages for more information). I’ll admit that I am a huge fan of stolen bases, there is nothing like watching a player steal second or third to try and get a rally started. But the question is, can you expect to score more runs by being fast or by getting on base?

To get started I only looked at data from 2015 and pulled out the top 25 players from each stat category in order to define the “fast” players and the players who get on base the most. I also standardized runs scored to runs per game (RPG) to account for rest days and injuries which may have kept players out of the lineup for short periods of time. In the plot below it appears that the leaders in stolen bases have been scoring fewer runs per game than players who get on base more often. Based on the 95% confidence intervals of the top 25 players the difference was not significant, but the results are interesting nonetheless.

Now let’s look at some long-term data with how many runs were scored each year since 1998. In the plot below we can see that there was a large spike in runs scored in 1999 and 2000 before scoring evened out. The trend seemed to remain relatively stable from 2001 up until around 2006 or 2007 and then we see a dramatic decrease in runs scored up until last year. MLB started testing for steroids in 2003 and perhaps this is why we’ve begun to see that decrease in runs scored, but that is outside the scope of this article so let’s just focus on runs.

Runs are the most important aspect in baseball, whether that means scoring runs or preventing them. In the end, if your team can’t score any runs then you can’t win any games and unless a team have a titan of an offense you need to prevent runs as well. Here we are going to focus on run generation so we can forget about run prevention from here on out. Let’s look at the seasonal stats for our indicators and see how they look over time. I’m going to note here that OBP and wOBA shown in the plots are the league average, while the stolen bases are the league total for each season. A quick look tells us that OBP and wOBA are very closely related to the trend we saw in the second figure while stolen bases have a lot of variability over time. This seems to give a lot of evidence to getting on base, but let’s go one step further and see if we can develop a linear model to predict how each predictor affects the expected runs scored in a season.

In the final plot below I’ve put runs per game on the y axis and each stat on the x axis. In order to test how changes in league performance affects run scored I predicted the number of runs scored based on the 10%, 50% and 90% quantiles to see how many runs a player would generate over a 162-game season.

I’ve created a summary table for easy comparison of each stat and the thing that really jump out is that stolen bases doesn’t have any effect on runs scored. Based on the model, in a season where players steal almost 700 more bases collectively they generate less than 1 extra run.

OBP Expected Runs (Per Season)
0.319 56.51
0.333 60.93
0.340 63.15
wOBA Expected Runs (Per Season)
0.315 56.64
0.328 60.77
0.336 63.31
Stolen Bases (Season) Expected Runs (Per Season)
2583 59.74
2918 60.21
3281 60.72

In the end, getting on base is the most important (Thanks Moneyball!). For many the results should be unexpected, players who get on base more give their teams more opportunities to score runs. There doesn’t seem to be a significant advantage to using OBP or wOBA to predict runs, but based on advanced analytics people should probably consider wOBA more useful since singles, doubles, triple and home runs are all treated differently in the calculation.