Where to Bat Your Best Hitter: A Computational Analysis (Part 1)
Prior to the August, 2015, non-waiver trade deadline, the Toronto Blue Jays sent their leadoff hitter Jose Reyes to the Colorado Rockies for Troy Tulowitzki, a classic middle-of-the-order bat. Everyone assumed from his career power numbers that Tulowitzki would slot in the heart of the Jays order, but with Josh Donaldson, Jose Bautista, and Edward Encarnacion already comfortably set at 2-4 (over 200 RBIs between them at the time) they instead used him in the vacated leadoff spot. The move seemed to work as Tulo went 3 for 5 in his first game, and the Jays proceeded to rattle off a tidy 11-0 streak with their new top-of-the-order guy.
| Troy Tulowitzki Shortstop B/T: R/R .297 / .370 / .510 29 HR 100 RBI 8 SB |
 |
José Reyes Shortstop B/T: B/R .290 / .339 / .432 12 HR 65 RBI 50 SB |
 |
One doesn’t mess with success, but everyone knows Tulowitzki is not an ideal leadoff hitter, never having batted there before in his 10-year MLB career, and with all of 3 stolen bases in the last 3 seasons. His above-average pop suggests a traditional run-producing spot: 29 HR and 100 RBI career numbers over an averaged 162-game season (Baseball-Reference.com), but with the Jays on a 22-5 tear, Tulo, touch wood, wasn’t moving anywhere.
A leadoff hitter naturally gets more at bats per season, one reason Jays manager John Gibbons gave for putting Tulowitzki at the top of the order, given his career .297 BA and .370 OBP. But tradition and common sense dictate that top RBI men are more valuable with men on base, impossible for a leadoff man in the first inning, and presumably sub-optimal afterwards. As Tulowitzki’s new teammate 3B Josh Donaldson noted in the midst of an August run that saw the Jays go from 6 back of the Yankees to 1 1/2 up in the AL East, “I feel like every time I’m coming up I have someone in scoring position or someone on base.” Exactly.
Fine-tuning a lineup is an argument for the ages, but can we determine where a power hitter should bat, where his numbers best fit 1 to 9? Should high-average batters hit before the sluggers, or should we just bat 1-9 in order of descending batting average (or OBP)? Can we calculate how to arrange a team’s lineup to maximize the optimum theoretical run production?
Enter Monte Carlo simulations, used to model the motion of nuclei in a DNA sequence, temperatures in a climate-change projection, even determine the best shape and size of a potato chip. In Do The Math!, Monte Carlo simulations were used to calculate where a Monopoly player will most likely land (Jail and Community Chest, followed by the three orange properties: St James, Tennessee, and New York), and whether to hit or stick in Black Jack against any dealer’s up card.
In some cases, algebraic probabilities are difficult (using Markov chains, a continuously iterative system with a finite countable sample space), whereas brute force computation does the trick over a large number of trials. If a picture is worth a thousand words, a simulation is worth a thousand pictures.
BOO V1 (Batting Order Optimization Version 1) is a Monte Carlo program written in Matlab that randomly selects a hit/out event over a 9-inning, 27-out game, averaged over a large number of games, e.g., 1 million. It uses a flat lineup where all hitters have a .333 OBP (roughly the Jays average), but doesn’t include errors, hit batsmen, sacrifices, double plays, stolen bases, etc., or opposing pitchers’ numbers. (In Part II, I will include the hitting stats of a real lineup: 1B, 2B, 3B, HR, BB, K, GO/AO.)
The mathematical guts are fairly simple, essentially a random number generator and some modulo math (think of leap-frogging 3 or more chairs at a time in a circle of 9), and elegantly captures some interesting trends, in particular, the distribution of end-game batters 1-9 and thus the most likely batter to end a game. From such a simulation, we can calculate where best to slot a team’s best hitter to maximize his chances of coming to the plate with the game on the line, another stated reason for putting Tulo in the Blue Jays number 1 spot.
Figure 1a shows the distribution of batters faced (BF) over 1,000,000 simulated BOO games, where the most likely end was 40 batters faced followed by 39 and 41 (the 3-5 hitters), as might be expected with a hard-wired OBP = .333 (binomial p = .33). It seems the custom of having your clutch hitters in the 3-5 slots matches the computational results.
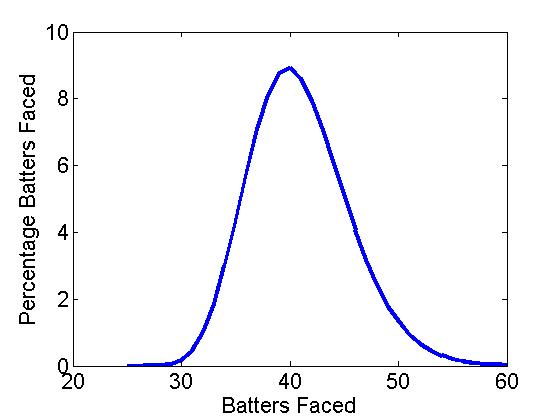
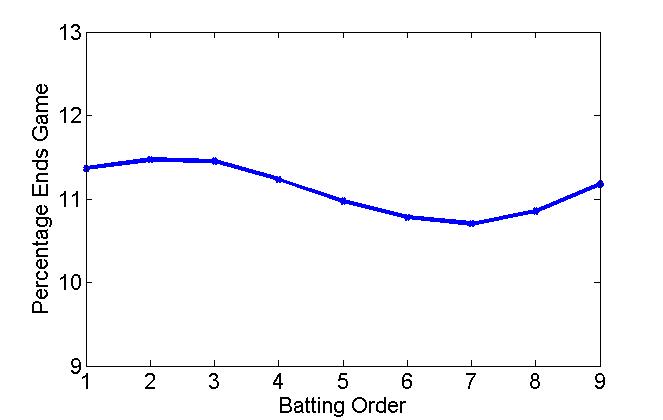
Figure 1a: Distribution of # of batters faced Figure 1b: Distribution of end-game batters
Interestingly, however, the leadoff hitter doesn’t end a game more often than a middle-order batter. Figure 1b shows the distribution of end-game batters (EGB) for a 1-9 lineup, and is perhaps counter-intuitive. In fact, the number 2 and 3 hitters are more likely to end a game than the leadoff hitter, while there is an obvious dip 3-7. Table 1 shows the frequency of end-game batters 1-9 (number and percentage).
| 1 | 2 | 3 | 4 | 5 | 6 | 7 | 8 | 9 | |
| # of games ended | 18.4 | 18.6 | 18.6 | 18.2 | 17.8 | 17.5 | 17.3 | 17.6 | 18.1 |
| % games ended | 11.4 | 11.5 | 11.5 | 11.2 | 11.0 | 10.8 | 10.7 | 10.9 | 11.2 |
Table 1: Number of games ended and percentage versus lineup position (OBP = .333)
Initially, I expected a constant drop-off from 1 to 9, or perhaps following some form of a Benford’s Law distribution, for example, in the wear pattern on a ATM pad or the leading digit in a collection of financial data (1 appears about 30%, 2 about 18%, 3 about 12%, 4 about 10%, . . . , and 9 about 5%). Note, if the data were randomly distributed, each number would appear 11.1% or 1/9. But the modulo aspect of a repeated baseball lineup creates another distribution, one that has a clear maximum after the leadoff spot and a mid-lineup dip at batter number 7.
Of course, the leadoff hitter will always have more plate appearances over an entire season, but somewhat surprisingly does not end a game more often. Table 2 shows the number of at bats 1-9 averaged over a 162-game season (I have assumed 8.5% of plate appearances are walks). As can be seen, the leadoff hitter gets about 130 more ABs than the number 9 hitter, or 21% more per season, reason enough to put your best hitter at the top of the order. From one batter to the next, however, the difference is only about 17 ABs (monotonically decreasing), about an extra AB every 10 games. Not that much difference one spot to the next.
| 1 | 2 | 3 | 4 | 5 | 6 | 7 | 8 | 9 | |
| # of ABs | 757 | 740 | 723 | 706 | 689 | 673 | 657 | 641 | 625 |
| % ABs | 12.2 | 11.9 | 11.6 | 11.4 | 11.1 | 10.8 | 10.6 | 10.3 | 10.1 |
Table 2: Number of ABs and percentage ABs over 162 games (OBP = .333)
Using BOO, we can also analyse how the EGB distribution changes for a good and a bad team, modelled using an OBP of .250 and .400. The results are shown in Figure 2 including our .333 OBP team. Here, it seems that the lineup order matters more on a bad team than a good team (a practically flat EGB). Indeed, it is often said that you can run any lineup out with a good team. Conversely, losing teams are always juggling their lineups to find the right mix.
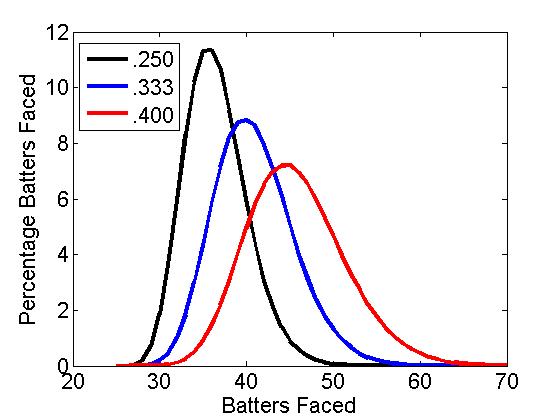
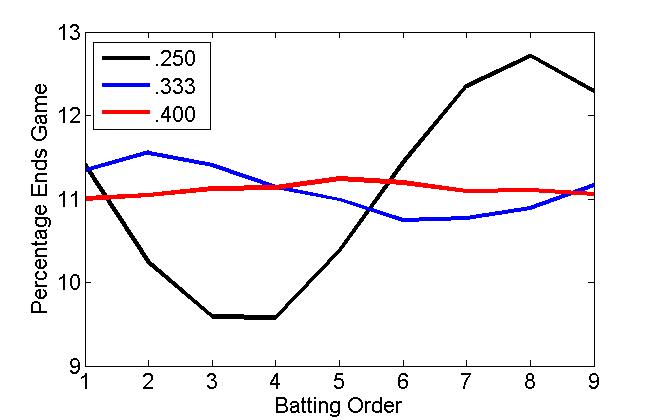
Figure 2a: Distribution of # of batters faced Figure 2b: Distribution of end-game batters (OBP = .250, .333. .400)
Of course, baseball is not just statistics over a large number of sample-sizes (or simulations). Baseball is played in bunches and hunches. It would take a little over 400 years to play 1,000,000 games in a 30-team, 162-game schedule. Matchups, streaks, situational hitting, and team chemistry may be more important than any theoretical trends. And, of course, a real, non-flat, batting lineup (which I’ll look at in Part II).
In an actual BF and EGB distribution for the 2014 Toronto Blue Jays and their opponents over a 162-game season, we see the small-sample versions of our super-sized theoretical distributions (Figure 3). The actual BF distribution is comparable to the theoretical binomial/Gaussian BF, though positively skewed, showing the effect of blowouts, not adequately covered in the hit/out simulation. The EGB distribution seems quite random, but late peaks may indicate the use of pinch hitters in the closing parts of a game. It is also interesting to note that BOO “throws” a perfect game about once every 10 seasons, a bit less than the official 23 over the last 135 years.
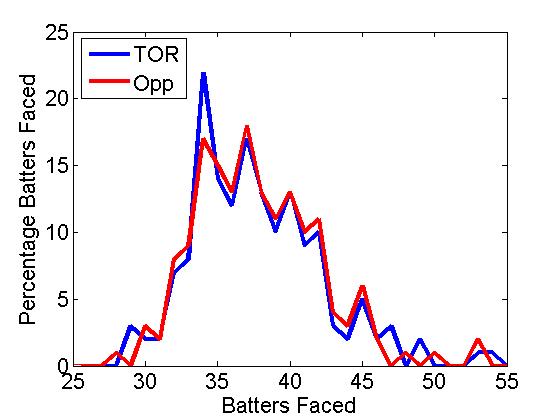
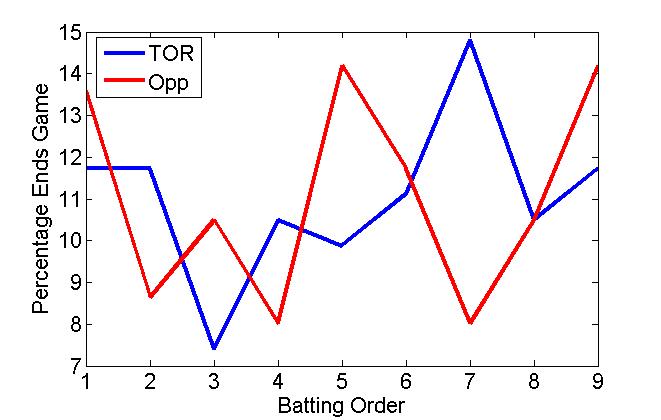
Figure 3a: Distribution of # of batters faced Figure 3b: Distribution of end-game batters (2014 Toronto Blue Jays and opposition)
So do the calculations mean anything? According to the numbers, your best hitter should bat 2 or 3, that is, if you want him coming up more often with the game on the line. In “The Batting Order Evolution,” Sam Miller noted that “the anecdotal evidence is strong” to put your best hitter in the number 2 spot. The worst spot for heroics is number 7.
Furthermore, a classic run producer such as Troy Tulowitzki shouldn’t bat leadoff, something the Jays found out after he struck out 4 times, almost a month to the day after acquiring him. Dropping him to the number 5 spot, the manager John Gibbons stated, “Maybe this’ll jump-start him a little bit.” Or maybe, he saw the wisdom of inserting the 2014 NL hit leader and speedster Ben Revere in the leadoff spot and using Tulowitzki’s power in a proven RBI position.
Mind you, with a scorching hot lineup that has scored 100 more runs than the next-best hitting team, it may not matter who bats where. That is, if the game is on the line.
Do The Math! is available in paperback and Kindle versions from the publisher Sage Publications, on-line at Amazon.com, and on order at local book stores. Do The Math! (in 100 seconds) videos are on You Tube.