Archive for June, 2017

Let’s Hope Everyone Takes Roberto Osuna’s Anxiety Seriously

This weekend, we learned of 22-year-old stud closer Roberto Osuna’s anxiety and how it’s keeping him from taking the field. Tim Brown of Yahoo Sports stepped back and humanized the concept of a quality professional not feeling suitable for work because of something like this. It’s a thought that too often feels foreign because of the status we give pro athletes.

Dominant on the field, Osuna appeared to be overwhelmed in his quotes about his well-being. From Brown’s piece (emphasis mine):

“I really don’t know how to explain it,” he said. “I just feel anxious. I feel like I’m lost a little bit right now. I’m just a little bit lost.

“This has nothing to do with me being on the field. I feel great out there. It’s just when I’m out of baseball, when I’m not on the field that I feel just weird and a little bit lost.

“I wish I knew how to get out of this, but we’re working on it, trying to find ways to see what can make me feel better. But, to be honest, I just don’t know.”

In a single sitting, Osuna says “just” five times. And it might be the most dangerous word that could be used in this context.

Though we’ve made strides in accepting anxiety as a legitimate medical concern, there is still a stigma that surrounds it.  But because it doesn’t inherently come with a fever or cast it’s often looked at as something that someone just needs to deal with. Meanwhile, symptoms can mimic a heart attack.

It’s not even strictly a mental obstacle. It’s chemical. Anxiety is tied to cortisol levels in the body. Cortisol is regarded as the stress hormone and is critical to our natural fight-or-flight instincts. It is adrenaline’s tag-team partner. It’s triggered by high-leverage situations with a lot on the line, which happen to be the kind from which Osuna makes a living. So when he says his current state has nothing to do with him being on the field, it’s probably fair to say that’s actually highly unlikely.

The body doesn’t release these chemicals like a faucet. There is no convenient handle to portion out the amounts one might receive at any given moment. It’s possible that Osuna gets into games and simply can’t turn off the very thing that makes him so damn good on the mound once the game is over; that cortisol floods through his system unchecked.

And why would he know how to turn it off? What background might he have to keep it in check? We’re generally not a culture that prepares for the come-down. At 22, he’s already got two-plus years experience in the bigs. But dealing with anxiety? That’s probably not a focus through the developmental process in baseball operations, even though there are well-vetted methods that can easily be implemented.

The brain loves patterns and automation. For the most part, it wants you to be able to go about your day without having to stress too much. But danger may arise quickly when the stress response it’s equipped with for protection gets folded into patterns of automation that are designed for comfort. That’s why “just” can be an alarming word to pair with statements about feeling “weird” and “a little bit lost.”

How Osuna and the Jays handle this is ultimately their business, and only their business. But I fear an announcement in the coming days saying he’s fine. He’s already been back on the mound. Osuna may not be out of the woods for some time, though, and if it’s stopped him from entering games, it could be severe for him. It can take years of practice and strategy to appropriately address anxiety. I only hope that he and the team comes to that conclusion on their own. If they don’t, the situation could get much worse.


Does Speed Kill?

Speed kills. At least, that’s what people say.

Speed is certainly a good tool to have. All else equal, any manager would pick the faster guy. Of course, speed is a huge asset in the field, especially for outfielders. Good speed increases range, providing a sort of buffer zone for players who don’t get a good jump on the ball or who don’t read the ball well off the bat. No one in their right mind, when given the choice, would pick the player with less range (again, all else equal). And so we can all agree that speed very clearly increases a player’s value in the field.

Whether or not speed increases a player’s value at the plate is a different story. The faster guy may leg out an infield hit every now and then or stretch a single into a double or a double into a triple, but this won’t significantly increase a player’s value outside of a small uptick in average.

Luckily, Baseball Savant’s sprint-speed leaderboard gives us some interesting data to examine (you can find the interactive tool here).

wSkcbNu.0.png

Here, we can see that the league average sprint speed is 27 ft/s. Catchers, first basemen, and designated hitters are typically below league average. And it comes as no surprise that outfielders, especially center fielders, are typically above league average.

If we look at the fastest player at each position for 2017, we can come to a better understanding of the value of speed.

scWVCyU.0.png

Notably, of the nine players on this list, only four of them have a wRC+ above 100 — league average. Is this significant? Probably not as a stand-alone statistic. But it is safe to say that speed does not directly correlate to value. And it certainly doesn’t correlate to value at the plate. Even when examining the WAR column, you won’t be blown away. Dickerson and Bryant are having great years, but for the most part these players represent a pretty average group.

As mentioned previously, only four of these players are above average in terms of creating runs (highlighted in red and orange). The players with wRC+ values in red have not had success because of their speed. They all have ISOs that are at least 50 points above league average. Basically, their success can be attributed to power, not speed.

However, JT Realmuto’s ISO is essentially league average. Did speed boost his value that much? (NOTE: speed is not taken into account when calculating wRC+; still, the value of each outcome, which is considered in the calculation, can be affected by speed) Realmuto’s speed puts additional pressure on opposing defenses, especially relative to other catchers, but I would be very hesitant to say that speed alone created a difference of 9 wRC+ between him and the average player.

Billy Hamilton is the fastest player in the league. And while most would call him a plus defender, very few would call him a good all-around player. His wRC+ value of 57 is seventh-worst out of all qualified players (highlighted in blue). Although he leads the league in stolen bases, even that wasn’t enough to raise his WAR above a dismal 0.5. We can safely say that speed does not correlate to success.

What about specific teams? Do teams compiled of speedsters at every position win more games?

w9geMYB.0.png

Here is the same image as above with only Marlins players highlighted. Miami has a player with above-average speed at every single position, save for Justin Bour at 1B who has been a top-20 player in the MLB based on offensive production this year. Without question, the Marlins have a lot of speed, but still, they are six games under .500 and 10.5 games out of the wild-card race in the National League.

HXJEqCo.0.png

Here is the same image with San Diego players. The Padres are a speedy team. They have not one, but two players above league average at three different positions. Even their catcher, Austin Hedges, is only slightly below league average while still significantly faster than the average catcher. Despite having one of the fastest teams in the MLB, the Padres are 14 games below .500 and 19 games out of first place in the NL West.

Speed isn’t a stand-alone tool. It is a great complement to someone who makes contact at high rates (see: Ichiro) and it can put pressure on a defense, forcing fielders to rush to make a play. Furthermore, it is a crucial tool in the field, increasing range for all players, most significantly for outfielders. However, speed in and of itself is by no means an indicator of overall value. In baseball, speed doesn’t kill.


Hitting It Where It’s Pitched

When learning the game of baseball, players are often taught about the importance of hitting the ball where it’s pitched.  This means that, if the pitch is inside, it should be pulled, if it’s in the middle of the plate, it should be hit back up the middle, and if it’s outside, it should be driven to the opposite field.  This is advice that generally makes intuitive sense.  I’m sure we’ve all seen batters reach to pull an outside pitch and roll over it for a soft ground ball.  We’ve also seen batters trying to fight off inside pitches and hit a weak ground ball or pop up to the opposite field.

However, the reemergence of the home run has led me to wonder just how valuable this guidance is.  Over and over again, Bryce Harper has been able to extend on an outside pitch and deposit it into the right-field bleachers for a home run.  Now, Bryce Harper is very often the exception to the rule, and an approach that works for him may not be suitable for 99% of the league.  That being said, more and more home runs are being hit, and not very many of them are being hit to the opposite field.  Based on Statcast data from Baseball Savant, in 2016 approximately 79% of home runs were hit to the pull side of the field.  Therefore, maybe it does make sense to load up and try to pull everything with the hope of hitting for more power.

To further investigate this, all batted balls from 2016 were queried from Baseball Savant and analyzed.  These batted balls were bucketed into four groups based on the pitch and batted-ball locations, separating each pitch as inside or outside (relative to the middle of home plate) and pulled or hit to the opposite field (using the middle of the field as the dividing line).  A few offensive statistics for each group are shown in the following table.

Inside vs Outside Table

Maybe it is a good idea to just pull everything after all.  For both the inside and outside buckets, batters hit the ball harder and are more successful when pulling the ball.  The results on outside pitches are relatively close.  However, it is definitely not a good idea to try to hit inside pitches the other way.  I don’t think any batters are intentionally doing this right now or this is something that would come as a shocking discovery, but the data shows that by far the most weakly hit balls are inside pitches hit the other way.  I’d imagine a lot of these are scenarios where a batter gets jammed as opposed to trying to take the ball to the opposite field.

While it does appear that pulled balls are hit harder, the buckets here are pretty broad.  Right now we’re grouping pitches a half inch away from the middle of the plate in the same group as pitches on the outside edge of the strike zone or outside the strike zone entirely.  Therefore, it might be worth looking at the outside pitches further while using slightly more narrow buckets.

The table below shows pitch locations bucketed into two groups: slightly outside and way outside.  To get these two groups, the plate was split into quartiles.  Slightly outside pitches are located in the 3rd quartile when counting from inside out, while pitches further outside than the 3rd quartile were considered way outside.  In other words, the dividing line was the midpoint of the outside half of the plate.  As the table shows, the results aren’t as simple as saying that every pitch should be pulled for maximum effectiveness.

Slightly Outside vs Way Outside Table

For pitches that are just barely outside, batters experienced much more success in 2016 by pulling the baseball.  However for pitches that were well on the outer half of the plate or even further outside, hitting the ball to the opposite field is by far the better option.  There are several key takeaways to note here.  When looking at wOBA, the success of hitting to the opposite field does improve when the pitch is further away, but only slightly.  However, the results of pulling the ball absolutely crater when moving from pitches that are just barely outside to way outside.  It’s really hard to pull a ball that far outside with any authority.  Those pitches are much more likely to result in the batter rolling over the ball for a weak groundout.

The home-run-percentage numbers are also interesting in the table above.  Even when the pitch is way outside, pulled baseballs are more likely to result in home runs.  For balls hit to the opposite field, home runs are higher when the pitch is slightly outside, even though wOBA is lower.  The gains in hitting balls to the opposite field when they’re further out come from improvements in average, not power.

In our previous table, we’ve accounted for the fact that there are varying degrees of how far out a pitch can be.  In the same manner that there’s a difference between a pitch that is way in/out and just barely in/out, there are also varying extremities of how severely a ball is pulled or hit to the opposite field.  To help account for this, we are going to calculate horizontal spray angles for each batted ball using the formula from this extremely helpful Hardball Times article.  As stated in the article, the calculations may not be perfect, and they may not align exactly with the pulled and opposite field values used earlier, but they should be very similar and will allow us to analyze batted balls at a much more granular level than we have thus far.

Once spray angles were calculated for each pitch, batted balls were split into nine separate groups.  Pitch locations were divided into inside, middle, and outside, with middle pitches consisting of the central third of home plate.  All pitches further out than that were considered outside, with all pitches further in considered inside.  Pitches were also divided into three groups along batted-ball location, with balls hit to the middle 30° of the field placed into the middle group, and balls that were hit further in or away grouped accordingly.  The table below shows the average launch speed for each of the nine groups.

Exit Velocity Table

As the table shows, inside pitches should be pulled, with the optimal angle drifting closer to the opposite field as the pitch gets further away.  However, even for outside pitches, balls are still hit harder to the middle third of the field than to the away third.  We can also look at wOBA for these groups, which will show relatively similar results.

wOBA Table

One interesting result here is that batters are actually slightly more successful when pulling the ball than hitting it up the middle if it’s in the heart of the plate.  We still see the same shift, however, where the further away a pitch is, the further away it should be hit.  Maybe the old conventional wisdom is on to something after all.  We can help visualize this with the following heat map, which shows how batted-ball launch speed varies based on the horizontal location of the pitch and the spray angle.

Horizontal Location vs Spray Angle Heat Map

In the plot above, negative spray angles are balls that are pulled, with positive spray angles being hit to the opposite field.  Zero is the middle of the field.  The horizontal pitch location follows a similar layout, with zero being the middle of the plate and negative values representing pitches that are inside.  While it is subtle, we see that, as the distance of the pitch away from the batter increases, the spray angle of the hardest-hit balls increases as well.  However, for opposite-field hits, this seems to taper off around the 20° mark, which we don’t really see for pulled balls

One other interesting note is that the average launch angles vary quite a bit between the different groups, as shown in the following table.

Launch Angle Table

Average launch angles are much lower for pulled balls, and launch angles decrease among all batted-ball locations as the pitch moves further away.

So, is the conventional wisdom to hit the ball where it’s pitched correct?  Yes, the optimal location to hit a baseball varies with the location of the pitch.  As the pitch gets further outside, the optimal angle moves further towards the opposite field.  However, it’s important to note that the optimal spray angle isn’t centered relative to the middle of the plate and the center of the field, and is actually offset towards the pull side.  It’s also worth noting that batters still have less power when hitting to the opposite field, so it’s likely worthwhile to be selective and wait for a pitch that can be driven up the middle or pulled when possible.

There are still a lot of other ways to cut this data outside of what I’ve described here, and I really think we’re just scratching the surface regarding the optimal offensive approach.  While balls that are pulled are hit harder, batters who are more selective and wait for a pitch to pull are also more likely to get deeper in counts and strike out more often, so there’s definitely a trade-off that has to be considered.  Another important note is that the tables I’ve shown above are looking at all batted balls.  It could be valuable to pull similar results when only looking at pitches in or near the strike zone.  It would also be interesting to see how the optimal spray angle varies based on other factors, such as the pitch type and the vertical location of the pitch.

The current analysis groups all major-league hitters together.  I’d love to see a future analysis that breaks out results by the type of batter and perhaps even shows different optimal spray angles for different batter profiles.  While the analysis here does help to demonstrate that there is validity to the conventional wisdom of hitting the ball where it’s pitched, there are still factors not being accounted for.  One of these is the fact that we may be dealing with some sample bias, as the most powerful hitters are also likely to be the ones who attempt to pull every pitch.  Accounting for different types of hitters would be a great next step in furthering this research by adjusting for the fact that hitting doesn’t have a one-size-fits-all approach.


The Cardinals Might Have Lost Three Wins on the Bases

The Cardinals’ have struggled to run the bases for the better part of two years now. So far, the only tangible effect has been third-base coach Chris Maloney’s “reassignment” to the minor leagues. Nevertheless, Cardinals manager Mike Matheny has continued to preach aggressiveness on the basepaths.

I intend to show the effect the Cardinals’ outs on the bases have had on their ability to score runs. A run-expectancy matrix can help. A run-expectancy matrix shows you the number of runs, on average, a team can expect to score from a given on-base state to the end of the inning. For example, with the bases loaded and no outs, a team can expect to score about 2.2 runs by the end of the inning. On the other hand, with nobody on and two outs, the offensive team’s run expectancy is about 0.098 runs. Here’s the basic run-expectancy matrix:


To estimate the number of runs the Cardinals have left on the bases, I charted every out on the bases thus far in 2017 (53). In each of those 53 instances, I charted the actual outcome and the outcome had the mistake not been made. Then, I subtracted the run-expectancy of the actual outcome from the mistake-free one.

In total, the Cardinal’s actual run expectancy is about 22 runs lower than it would be without baserunning mistakes. If you add those 22 runs to the Pythagorean record formula, the Cardinals should be 38-37, or 1.5 games behind the Brewers.

Not all outs on the bases are created equal, though.

All those formulas are useful, but they make a few key assumptions. First, they assume average speed on the bases. Second, they assume an average hitter at the plate. The creators of run-expectancy arrived at the above numbers by studying the results of MLB games over a six-year period. That’s thousands of innings and at-bats for the numbers to even out. But, when you look at just 53 instances, it’s possible for there to be some small-sample-size error. So let’s look at a couple of specific plays from this season.

April 18

With the Cardinals leading the Pirates 1-0 in the 5th, Greg Garcia came to bat with Jose Martinez on first. With nobody out the run expectancy was 0.8.

Garcia lined a double into center. Martinez rounded third and scored easily, but Garcia was thrown out trying for third. Now, it’s possible a throw from the outfield was cut off by the first baseman and redirected to third to nab Garcia. However, quick review of the video shows that not to be the case.

With one run in, the Cardinals could have expected about 1.1 more runs had Garcia stayed put at second. Instead, with nobody on and one out, their run expectancy dropped to .59. There’s about 1/2 of one of those 22 runs.

Luckily the Cardinals hung on for a one-run win.

May 13

Leading the Cubs 3-1, Magneuris Sierra was on first with one out and the pitcher, Carlos Martinez, at bat. Sierra tried to steal second (Lester was on the mound) but was thrown out for the second out.

Run expectancy says the Cardinals went from scoring about .5 a run on average to .2. But the pitcher was hitting. Assuming Carlos would have bunted him over, the run expectancy would have risen to .319. Lower than it was, but higher than if Carlos would have, say, struck out.

This is an example of a time where run-expectancy breaks down. In the National League, pitchers hitting has a tendency to ruin even the best laid plans. And because most formulas make the basic assumptions mentioned above, it’s hard to criticize Sierra’s mistake.

May 18

I bet you’re surprised I got this far without mentioning Matt Carpenter.

Well, on May 18 Carpenter committed one of the stupidest, irresponsible, boneheaded, bordering-gross-criminal-negligence baserunning mistakes I’ve ever seen.

Carlos had pitched an utter gem, and the game was 0-0 in the 9th. Carpenter lashed a sure double into left. It appeared the Cardinals were well on their way to a win, as their run expectancy rose from about half a run to 1.1.

Then Carpenter rounded second, and headed for third.

He was nailed at third easily. The Cardinals run expectancy dropped all the way down to 0.25. They didn’t score in the inning, and went on to lose the game.

As you can see, run expectancy isn’t the perfect tool for evaluating baserunning. Sometimes calculated risks have to be taken based on the speed of the runner or quality of the hitter, two things run expectancy ignores.

Taking the extra base is always a calculated risk. By ignoring the times the Cardinals have been successful, I was setting them up for failure in this scenario. But when you are among the league leaders in outs on the bases, the particulars of those outs require some serious consideration.

The conclusion is this: the Cardinals reckless baserunning has cost them as many as three wins thus far this season.

This article first appeared in The Redbird Daily.


Warbird Down: Some Additional Thoughts on Kyle Schwarber

On June 22 the Chicago Cubs sent a struggling Very Large Human, Kyle Schwarber, to the minors. The Warbird earned it, with the 20th worst fWAR and 6th worst bWAR among qualifying hitters. His OPS is just two points shy of Albert Pujols‘, a goal that you kids at home should no longer aspire to. Schwarber’s inoffensive offense has led to much discussion, most of which revolves around two competing theories:

  1. This is just a slump, and Scwharber will come out of it. He’s way better than he’s shown in 2017. Craig Edwards said as much in these pages a couple of weeks ago.
  2. Schwarber’s fallen and he can’t get up. There is something fundamentally wrong with him that is going to take considerable time to correct, if it is correctable at all. The demon that possessed Jason Heyward in 2016 has found a new human host.

The Cubs, predictably, are publicly sticking with Theory 1, and not without reason. As Edwards pointed out, there is plenty of statistical evidence suggesting Schwarber is basically the same hitter he was during his torrid 2015 campaign. The walk rate is about the same. The K rate is about the same. The power is still there — how many guys with an ISO over .200 get sent down? And that most basic of slump detectors, BABIP, is flashing red: Schwarber’s BABIP is a minuscule .193, last among qualifiers.

Or is this all whistling past the graveyard? A deeper look at Schwarber’s numbers reveals some seemingly alarming trends. Specifically, he’s been virtually helpless against the slider this year, “slugging” it at an .042 clip. In 2015 he murdilated sliders, slugging .593 against them. For those of you not near a calculator, that means between 2015 and 2017 Schwarber lost 551 points of slugging against one of baseball’s more common pitches — losing more than most hitters will ever attain.

There were specific sliders that Schwarber found particularly tasty in 2015 — those down and over the plate. This year, not so much. As his FanGraphs pitch value tables indicate, the slider has become garlic to Schwarber’s vampire. (Not that I am in any way suggesting that Schwarber is an undead being of any sort.) Other teams, aware of this newly opened hole in his swing, have accordingly started feeding Schwarber a steady diet of sliders.

Except that they haven’t. Schwarber is actually seeing slightly fewer sliders this year than he did in 2015. Maybe major-league front offices would benefit by reading more brilliantly researched blog posts like this one.

Or maybe there really isn’t anything there after all. One good way to evaluate a hitter is to watch how other teams are treating him, and Schwarber’s opponents haven’t pitched him much differently than they did in 2015, at least as far as pitch selection is concerned. This doesn’t seem to be a Heyward situation, where a gaping hole did open in his swing, and pitchers began attacking him mercilessly with high fastballs.

Another good way to evaluate a hitter is to watch how his own team treats him, and the Cubs have been almost painfully patient with Schwarber. He was bad in April before getting much, much worse in May. A power spurt in early June was not enough to save him from Iowa.

Last year, the Cubs had good reason to be patient with Heyward, even though he was producing about as much reliable power as Pakistan’s grid. There were two reasons for this: (1) he was making substantial contributions with his glove; and (2) from about April 15 on, the Cubs had a divisional lead of at least 75.5 games. No, really. Look it up.

The Cubs patience with Schwarber is less obviously explicable. Replacements for his limp bat were at hand in the minors, including Ian Happ and (more recently) Mark Zagunis. Schwarber adds nothing to the team’s defense, and the Cubs this year are in a remorseless fight to the death in the NL Central.

So the Cubs and their opponents have been behaving (for most of the season, anyway) as though Schwarber is in a slump, rather than suffering from some more fundamental problem. The Cubs might be looking at his track record — in his brief minor-league career Schwarber’s OPS is 1.042, and, you know, that 2015 season was so awesome!

But Schwarber didn’t have a season in 2015, he had less than half a season: 273 plate appearances to be exact. He’s had 261 PAs this year. So to this point, Schwarber’s entire career does not yet amount to the equivalent of even one full major-league season. His career has been strange in that his PAs have been so highly segregated: 273 fantastic PAs followed by 261 awful ones, with some World Series heroics in between that would melt the hardest of non-Cleveland hearts. Put it all together though, and you have one short, not-all-that-impressive career thus far. His career OPS+ is 102, and his career wRC+ is 104. Those numbers simply aren’t good enough for an essentially postionless player. Here’s a list of left fielders with a career OPS+ of 102. For those of you who can’t click through, trust me, it’s short. The Cubs didn’t plan to use the 4th pick of the 2014 draft because they wanted the next Garret Anderson.

Past performance does not fully predict future results, and there are some reasons to think that the real Warbird is closer to the 2015 version than the 2017 one. As noted above, his minor-league stats were through the roof, and a very competent front office used a very high draft pick to get him. His trouble with the slider looks more like a reframed BABIP slump — that is, a run of bad luck during a small sample size — than a genuinely exploitable hole. He’s still only 24.

And yet, the Cubs did send him down. This probably has more to do with the pennant race than with Schwarber; the Cubs simply can no longer afford to give away outs. The move takes some pressure off of Schwarber himself (though he may well not see it that way), and takes the pressure off of Joe Maddon to either write Schwarber into the lineup every day and answer a bunch of annoying questions about it, or not write Schwarber into the lineup and answer a bunch of annoying questions about it. But if Schwarber’s last 261 PAs are simply down to bad luck, why couldn’t the first 273 PAs be down to good luck?

I don’t really believe Schwarber is the next Garret Anderson, but I’m less certain than some Cubs fans that we know who the real Schwarber is yet. Schwarber’s demotion will help the Iowa Cubs sell tickets. Whether it helps the Chicago Cubs sell playoff tickets remains to be seen.


LoMo: A Tale of Actualization

On April 17, David Laurila posted the transcript of an excellent Q&A with Tampa Bay Rays first baseman Logan Morrison. At that point, the season was exactly two weeks old, and Morrison, then sporting a 136 wRC+ and .302/.348/.535 slash line, had been a pleasant surprise for the Rays. Prior to 2017, most thought of Morrison as a talented but inconsistent hitter; strong 2010 and 2011 campaigns were followed up by a number of uninspiring and injury-plagued seasons, and while Morrison was bound for an occasional hot streak (May 2016 jumps to mind most quickly), he’d been unable to establish himself as much more than a replacement-level first baseman. His rolling wOBA reflects this inconsistency, as the following chart demonstrates some significant oscillation over the last few years:

rolling_wOBA

For that reason, it’s been an even more pleasant surprise for the Rays that their first baseman has been able to sustain his success so thoroughly over the first three months of 2017. In fact, he’s been one of the best power hitters in the league, and unexpectedly so; The Ringer’s Michael Baumann recently ranked him as the third-most shocking name on the home run leaderboards, trailing only Yonder Alonso and Justin Smoak. Through June 24, Morrison’s 22 home runs and .332 ISO are bested only by MVP frontrunner Aaron Judge, and he currently sports the third-highest WAR among all first basemen in the majors. Morrison’s also been barreling up the ball at a far higher rate in 2017; even with over a hundred fewer plate appearances this year than in 2016, LoMo’s already had seven more barrels than last year, and his barrel percentage per batted-ball event has more than doubled, from 7.5% to 15.1%.

Interestingly, Morrison’s average exit velocity has actually seen a moderate decline, from 90.3 to 89.2 miles per hour, but his raised launch angle is enough to warrant a significant increase in expected wOBA, which has risen to .382 from .340. Morrison discussed this aspect of his game with Laurila, saying that he’s benefited from valuing “launch angle and all that stuff,” and that his new approach, at its core, consists of trying to hit fly balls “up the middle.”

He’s stuck to that approach pretty rigidly during the first few months of 2017; as shown below, he’s been able to eliminate almost all of his batted balls with launch angles of below 10°, instead shifting the majority of his contact to somewhere between 15° and 40°:LA_16 and 17.png
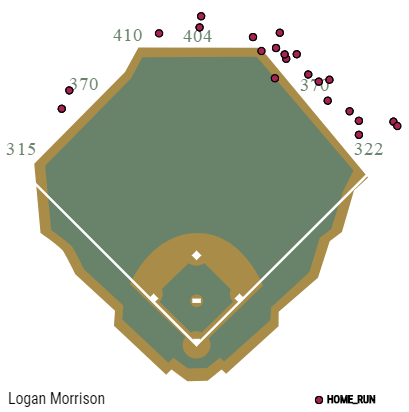
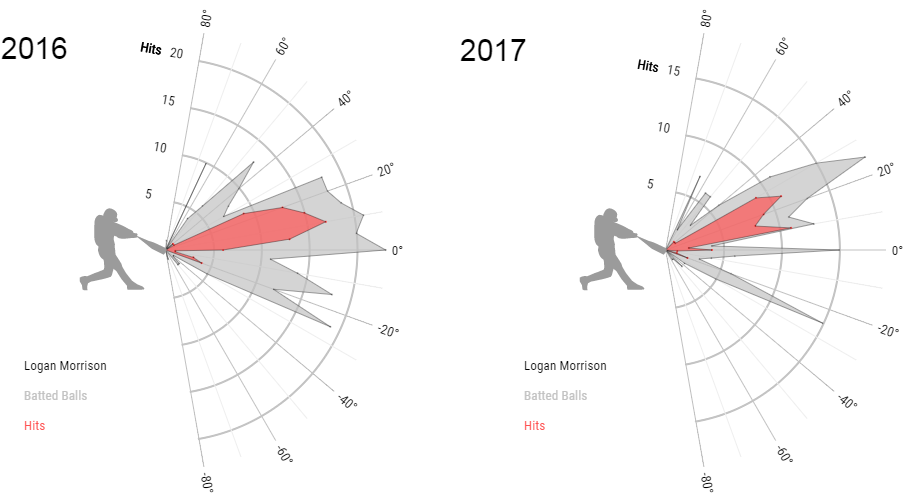
Further, look at how much his spray chart has shifted towards the middle of the field:

spray_16 and 17

Overall, Morrison’s average launch angle has increased from 12° to nearly 17° — placing him in the same neighborhood as Miguel Sano and Justin Upton — and his fly-ball rate has skyrocketed. Morrison’s fly-ball rate of 48.1% is miles above last year’s 34.7%, and is just two percent behind that of fellow fly-ball devotee (and reigning Most Shocking Home Run Leader) Yonder Alonso.

So, we know that Morrison’s been living by at least one of the concepts he discussed with Laurila, but I believe we can also attribute LoMo’s 2017 success to another item he mentioned. In Morrison’s words, “A lot of [hitting] is just getting the best pitch you can to hit … If [the pitcher] is a guy who can do everything, I’m just trying to get a fastball middle until two strikes.”

Through June, Morrison’s done an exceptional job of putting these words into action. Compare his swing heat maps over the past two years’:

swings_16 and 17

Last season, Morrison’s swings were concentrated around two zones – one in the middle-in section of the strike zone, and one on the outside corner. This year, though, he’s been splitting the difference, looking instead for pitches almost exactly between his two favorite areas of 2016. We can see that so far, Morrison’s avoided chasing pitches on that outside corner, thus sticking to his philosophy of focusing solely on the best pitches to hit. And when we dilute the sample to swings in non-two strike counts, we can see a similarly stark contrast:

pre-two strike swings_16 and 17

Just as Morrison said back in April, he’s been swinging almost exclusively at pitches in the middle of the zone with less than two strikes. From the above heatmap, it’s pretty evident that this wasn’t the case in 2016, as his swings comprised a far greater area of the strike zone, and even a section outside of it. According to FanGraphs, Morrison’s O-Swing% has fallen 29.3% to 25.9%, reflecting his increased patience. I should note that PitchFX, on the other hand, actually marks his O-Swing% as slightly higher this season. In conjunction, though, I’m interpreting these contradictory statistics as an indicator that Morrison’s laid off of the borderline pitches, presumably on the outside corner, about which the two pitch trackers disagree.

This approach, combined with his increase in launch angle, has notably improved the first baseman’s quality of contact early in the count. In pre-two strike situations, Morrison’s xwOBA has risen from .396 last year to .498 in 2017, which, to provide context, is roughly equal to Alonso (.499), Justin Bour (.498), Edwin Encarnacion (.498), and Carlos Correa (.495).

With such an inconsistent track record, we shouldn’t necessarily expect Morrison to continue hitting at such a high clip. However, while Morrison’s never run a particularly high average on balls in play — his BABIP hasn’t exceeded .290 since 2010 — in this case, it’d be fair to expect some positive regression on his .248 BABIP, especially considering Morrison’s altered batted-ball profile. And true, his 25.3% HR/FB rate is much higher than it’s been for any full season in his career, but it’s not unreasonably high for a top power hitter, especially one with a newly-increased launch angle. It’s not like his 22 home runs have been flukes, either — among all 104 batters with at least ten home runs, the average distance of Morrison’s shots has been an estimated 403 feet, which ranks almost exactly in the middle of the pack. Plotted against a backdrop of Tropicana Field, Morrison’s home park (and whose park factor for left-handed home runs was recently scored as perfectly average), it’s evident that the vast majority of Morrison’s four-baggers have cleared the fence by a comfortable margin.

hr_spray

By actualizing on the topics he discussed with David Laurila, LoMo’s been able to emerge as one of the season’s most unexpected members of the league leaderboards, and has been instrumental in keeping the 40-37 Rays in the AL Wild Card picture. There’s no guarantee that he’ll be able to sustain this performance through 2017 and beyond, but if Morrison can continue with the adjustments that have made the first half of the season such a success, there are genuine reasons to believe that his spot on the leaderboards might last longer than most saw coming. If the second half of Morrison’s 2017 is as productive as the first, he’ll be finding himself much closer to #20 than #1 on next year’s edition of the Most Shocking Home Run Hitters list.


The Divergent Travis Shaw

Considering that you’re reading an amateur post on a website dedicated to in-depth baseball analysis, I probably need not remind you that the Brewers are exceeding expectations this year. Thanks to offensive contributions from Erics Thames and Sogard, as well as improved pitching from the likes of Jimmy Nelson, Chase Anderson, and Corey Knebel, Milwaukee is riding a modest +6 run differential to an even more modest half-game lead over the second place Cubs in the NL Central. One Brewer that seems to be slightly less talked-about than those listed above is third baseman Travis Shaw.

Shaw joined the Brewers last offseason as the main piece in a trade that sent reliever Tyler Thornburg to the Red Sox, and through 66 games this year he is outpacing his career 162-game WAR average by almost a win and a half (3.7 WAR/162 vs. 2.3), due mostly to increases in all three slash stats (.288/.343/.535 vs. a career .250/.313/.441), and a subsequent rise in wRC+. Now, those numbers aren’t exactly eye-popping, and Shaw has shown that he can be productive over 60ish-game spans in the past, but as someone interested in marginal-to-average players, I wanted to believe that he was making some sort of leap offensively. Unfortunately, when taking a closer look at his plate-discipline stats, I noticed something that might hint at a coming regression.

View post on imgur.com

Shaw’s F-Strike%, or First Pitch Strike Percentage currently sits at 47.7% (league average is 60.3%), which is good for the lowest rate among all qualified hitters and about two percentage points below second-lowest. This could be the result of luck, facing particularly wild pitchers, or the reputation he carries as the Mayor of Ding Dong City. Two things that certainly help keep his rate in check are career lows in both O-Swing% (percentage of pitches a batter swings at outside the strike zone) and Swing% (percentage of swings on all pitches), shown below.

View post on imgur.com

Regardless of the cause, it is of course beneficial to start at-bats 1-0 rather than 0-1 (although apparently not as crucial as what happens after 1-1 counts). What’s interesting about Shaw in this case is that he’s hitting like Aaron Judge (.463 wOBA) through 1-0 counts and like JJ Hardy (.245 wOBA) through 0-1 counts. Also of note, his walk rate after receiving a first-pitch strike plummets from a below-average 7.4% down to 0.8%, which is the 6th-worst rate among 131 hitters. These splits are based on relatively small samples (148 PA and 118 PA for 1-0 and 0-1, respectively), but I think the difference is stark enough to warrant some doubt for him sustaining his current output. Below is a table showing the league leaders in differential between Through-1-0-Count wOBA and Through-0-1-Count wOBA.

View post on imgur.com

Shaw ranks sixth. This to me indicates that pitchers have a lot to gain from attacking him early; but that’s obvious. In the vast majority of cases, pitchers have no desire to start at-bats 1-0. What I’m saying is that once Shaw’s F-Strike% starts to creep towards league average and his JJ Hardy-ish at bats become more common, we might start seeing results that resemble his career averages. In other words, the Mayor of Ding Dong City’s third term has gotten off to a promising start, but a dip in approval ratings may be in his future


All-Defense Team vs. All-Offense Team

The sabermetric revolution has brought us baseball nerds a lot of great information. More than anything, though, it has brought us a plethora of defensive statistics that help us understand a side of the ball that was previously mainly just measured by… (gulp) fielding percentage. Executives now pay top dollar for outfielders who take great routes to the ball, even if they make don’t have the strongest arm. Or an infielder who can get to a ton of balls, even though he makes more errors than the guy with no range.

Thinking about some of the top players in the league, they may not be as highly thought of as they are if we could not accurately quantify their defensive excellence. Francisco Lindor does not just look smooth at everything he does, but the numbers back him up. Conversely, Khris Davis at first glance looks like one of the best players in baseball, hitting countless long balls in Oakland. But Davis rates as one of the worst defensive outfielders in baseball and is not much more than a league-average player because of it. This led to me to thinking about, are the Davises of the world better than the Andrelton Simmonses of the world, who can field like Ozzie Smith, but hit like Mario Mendoza. I have created a list of nine players that are studs defensively but struggle hitting, and nine who work wonders with a bat but not with the glove. The teams will be compared at the end to see which one would come out on top if they were to actually play.

Defense

C –  Salvador Perez – If you know anything about Salvy, as he is affectionately called, you know he is as durable as they come behind the plate. That, paired with his defense behind the plate makes him quite the valuable backstop. Salvador Perez has nine more Defensive Runs Saved since 2014 than the second place Yadier Molina, in a similar amount of innings. But offensively, Perez is not as strong. He has not had a wRC+ above 91 since 2013, excluding this year which is not halfway over. The guy just does not walk, as he has not had a BB% over four percent in any full season.

1B – Joe Mauer – Albeit a shell of his former self that used to strike fear into pitchers into the Metrodome, Mauer can still pick it at first. He is among the top at his position over the past few years at DRS, ErrR and UZR/150. Mauer does not have the power he used to, with isolated power hovering around .100 for the past few years. He walks a pretty solid amount, usually at around 10 percent.

2B – Yolmer Sanchez – A name not known to many, Yolmer Sanchez is a somewhat promising young player in Chi-town. Sanchez is not that experienced, but has shown positive defensive traits thus far. He is above average in turning double plays, not making errors and range. Despite that defensive success, Sanchez has not resembled any sort of an offensive threat. While improving this year, his OBP is usually well under .300, and his SLG% is also under .400.

3B – Darwin Barney – To have a 75 wRC+ and still finish with 2.4 WAR in a year says a lot about a player. That is was Barney accomplished in 2012. Talk about a journeyman utility guy; Barney has had some decent playing time in his career, notably with the Cubs, but for the most part, he has been an extra infielder with a slick glove at whatever position he is playing. At third, he has been solid in a limited amount of innings. He has a UZR/150 of 6 since 2014. Offensively though, he does not hit for power, does not walk and has been a below average baserunner the past few years.

SS – Jose Iglesias – The Tigers’ shortstop makes some of the smoothest plays in baseball. He is a treat to watch in the field, but no so at the plate. Iglesias has 12 career home runs, a walk rate under five percent and is a below average baserunner. He is in the top few among shortstops in defense as a whole, but is arguably the best at not committing errors.

LF – Colby Rasmus – When Rasmus is thought of by a normal fan, they probably think of towering home runs and excessive strikeouts. That is very understandable, but did a little deeper and you’ll find a very above-average defensive outfielder. Rasmus has the most Defensive Runs Saved of any left fielder, and he has fewer innings that almost anyone at the top of the leaderboard. Colby Rasmus has an insane arm in left, leading to an incredible UZR/150 of 30.3 over the past year and a half. Now he is by no means a bad hitter, but he is on the list because he is rather mediocre offensively, and stellar defensively. The only thing consistent about Rasmus is his astronomical strikeout rate. He is powerful, but has not gotten substantial playing time a lot because other parts of his game have been sub-par.

CF – Kevin Pillar – This is what Pillar is known for. He covers ground like few others can, while sacrificing his body for unbelievable diving grabs on a regular basis. Pillar’s RngR is the best in baseball over the past few years, and has saved nearly 40 runs since 2015. He is a well above-average baserunner, but his walk rate is under five, and his career OBP is right around .300.

RF – Jason Heyward – His $184-million contract with the Northsiders is also well worth it after that alleged speech he gave during the fateful rain delay in Game 7 of the World Series. But hey, it does not hurt that he is one of the best defenders in the game. Heyward’s UZR/150 since 2015 is over twice as high as the next qualifier. He has unbelievable range and a very good arm. Heyward has had offensive success in the past, but seems to have lost that magic with the Cubs. He has hit just 13 long balls since the start of 2016. The Cubs’ outfielder has his two lowest outputs of Hard% over the past two years.

Offense

C – J.T. Realmuto – Realmuto has burst on the scene to an extent with his above-average offensive output in the past year and a half. In 2016 and in the start of 2017, his wOBA has been above .330, very solid for a catcher. He is also an above-average baserunner, and can even swipe you a few bags, as he did 12 times last season. Framing is not one of Realmuto’s strong suits, though. In his two seasons with the most playing time, 2015 and 2016, he combined for -27.2 Framing runs, per Baseball Prospectus. He has -10 DRS since 2016.

1B – Miguel Cabrera – The best right-handed hitter I have ever seen is not that great at defense. For context, Miggy’s RZR has been worse than Ryan Howard since the start of 2016. He is just jaw-dropping with a bat in his hands, though. The utter consistency of his sheer dominance of whatever is thrown at him is generational. He has had an OPS of .900 or higher in every year but two since 2005; three of the years, his OPS was well over 1.0. And in those two years he did not get there, he was very close, with an OPS in the very high .800s.

2B – Daniel Murphy – The spokesman of the launch-angle revolution has otherworldly numbers at the plate since the start of 2016. He batted .347 last year with just a .348 BABIP, implying his success was legitimate. His wOBA last year and this year thus far have been over .400. With all that though, he has been, without much question, the worst defensive second basemen in baseball since the start of last year. Murphy’s range what you would assume a player that looks to Pablo Sandoval to have. He also commits more errors than average.

3B – Jake Lamb – One of the biggest reasons the Diamondbacks are having the season they are is because of their third baseman. Lamb is walking a lot and hitting with a lot of power, a recipe for success. He is not that great at the hot corner though, as he has been below average at making errors and turning double plays while managing to have limited range.

SS – Xander Bogaerts – The Aruba native has not replicated the success he had for most of last year during this year, but is still clearly an above-average offensive shortstop. He has had an OBP of over .350 for three straight years now and has cut his SwStr% down severely, all the while being an incredible baserunner. The questions about his glove, though, have turned out to be legitimate. He makes very few plays out of his zone because of his lack of range.

LF – Matt Kemp – Remember when Matt Kemp was arguably the best player in baseball? He is a far cry from that, plus a few pounds. He is still hitting well over .300 with power. His Soft% is very low, as it has been for years. According to FanGraphs, he has a lifetime defensive WAR of -143.3. There are a lot of bad defensive left fielders in baseball currently, notably Robbie Grossman, Yasmany Tomas and anyone in Baltimore, but Kemp may be the worst.

CF – Tyler Naquin – Oh boy. I saw Naquin’s downfall coming before it happened, but he was still overall a productive player offensively last year, if you look at the season as a whole. His wRC+ was 135, albeit clearly unsustainable. Naquin’s BABIP was .411, and he really struggled in the second half. He was a disaster in center field, taking some of the worse routes I have ever seen. He did have a pretty solid arm, but he used it too much because of how many extra-base hits he allowed.

RF – J.D. Martinez – This is what bursting on the scene actually looks like. Martinez has put up jaw-dropping numbers over the past few years, relative to what he had in years past. Martinez’s OPS has been .879 or higher every year since 2013, including in 2017, where he is currently at 1.065. Statistically though, Martinez does not really do anything well in right field. He has been way worse than Jose Bautista since 2016 in fewer innings.

To me, the most evident difference between these two hypothetical squads  is the name recognition. Nearly every player on the offensive-heavy team is a household name, or has some form a popularity. The other team, though, has one, arguably two names that the average fan would know. Name power, though, does not translate to wins. These two teams playing would make for some interesting baseball. The defensive squad would be a treat to watch play together, but it would be tough for them to field the rockets hit at them by Miggy and co. I decided to calculate how the WARs of these players stack up. I calculated the average of their WAR last year (expanded to 150 games) and their WAR this year (again, expanded to 150 games) of those that are playing.

Defensive Team Offensive Team
C Salvador Perez – 3.9 J.T. Realmuto – 3.9
1B Joe Mauer – 1.2 Miguel Cabrera – 3.1
2B Yolmer Sanchez – .9 Daniel Murphy – 5.4
3B Darwin Barney – 1.3 Jake Lamb – 3.6
SS Jose Iglesias – 2 Xander Bogaerts – 5.2
LF Colby Rasmus – 3.4 Matt Kemp – 1.6
CF Kevin Pillar – 2.1 Tyler Naquin – 3.2
RF Jason Heyward – 1.9 J.D. Martinez –  3.8
Total 16.7 29.8

Now what does this tell us? Not a whole lot. Not only is WAR not a perfect stat, but a lot of these are skewed, like Tyler Naquin. I would project Naquin to almost have a negative WAR in 2017, but because he had a lucky 2016, and has not really played in 2017, he has a 3.2 WAR. Conversely, there is someone like Kevin Pillar who is off to not a great start in 2017, but should turn it around, and is punished because his WAR is not that high yet.

I would project the offensive team to win, though. Again, that does not tell us a much. I just picked players who I saw as bad at one part of the game and good at another. Someone else doing this could have picked other players and gotten a much closer result. This defensive team I chose would have a very hard time scoring runs, and while the offensive squad may struggle in the field, notably with range, they have so much firepower that they could be not be slowed down. I would love to see these teams battle, as it would make for some long home runs and exciting plays in the field, but I think these guys are doing just fine on their own teams.


Are the Mets in Rebuilding Mode Once Again?

The Mets are the talk of the town…for all the wrong reasons. They currently sit at a 31-41 record and are 12 games behind the Washington Nationals in the NL East, which as of now seems to be theirs for the taking. The Mets boast one of the worst bullpens in the majors and have been plagued by injuries as well as underperformance from the bulk of their lineup. With the results of this season, many are beginning to wonder if it’s time to turn the page on this current pack of Mets players, many of whom were on the 2015 team that lost to the feisty Kansas City Royals in the World Series. I will attempt to go group by group in an effort to determine whether or not the Mets should begin a new rebuilding process, the most dreaded phrase in sports.

Starting with the outfield, Yoenis Cespedes is locked in for three more years in his current contract. It’s understandable why the Mets were looking to sign him in the offseason based on his performance in 2015 and 2016. However, injuries and poor performance have contributed to the current record that the Mets have. Cespedes still won’t lose his spot in left. Curtis Granderson, due to his age, will most likely not be re-signed, as well as Jay Bruce who, if he is not traded before the deadline, will most certainly test free agency. Juan Lagares has been injury-prone the last couple years but the one piece of good news is that Michael Conforto has seen a resurgence since coming back from Triple-A Las Vegas. Also, one of their top prospects, Brandon Nimmo, should receive regular playing time in the outfield, if not this season, then definitely in 2018.

Next, we have the infield, which has been decimated by injuries. Neil Walker and Asdrubal Cabrera have struggled through injuries (and who knows if/when David Wright will ever step on a baseball field again). Jose Reyes and Lucas Duda have mightily underperformed. The good news for the Mets is that Cabrera, Walker, and Reyes will be gone after the season, which means that the infield can get much younger. Top prospects Dominic Smith and Amed Rosario will be September call-ups and, if all goes well, can be regulars in the lineup next year. T.J. Rivera and Wilmer Flores have proven to be reliable pieces in the lineup. Despite some injuries from Flores, he has made up for it with his versatility in both the field and in the lineup, giving manager Terry Collins options to choose from. While Flores and Rivera may not be long-term solutions, they are the best options that the Mets have at the moment. As far as catching is concerned, Travis d’Arnaud is probably the Mets’ best option right now, although he has severely underperformed since being traded to them. The Mets should try to get another catcher in free agency.

Finally, the best pitching staff is a huge question mark, but also a big concern among scouts. Matt Harvey clearly no longer has any interest in remaining with the team and Noah Syndergaard, Zack Wheeler, and Steven Matz are just injuries waiting to happen. Even Jacob deGrom, who has been I believe the best starter this season, has a history of arm injuries that makes Mets front-office personnel nervous. Even Robert Gsellman and Seth Lugo are recovering from injuries sustained during this season. The bullpen has been just as bad. The bullpen so far has logged 257 innings to the tune of a 4.97 ERA. Not to mention they have not had a reliable closer since Jeurys Familia has been both suspended and injured this season, and the rest of the bullpen outside of Addison Reed and Jerry Blevins has been downright horrendous.

Overall, the Mets need to begin the next phase of the rebuilding process. With aging veterans and current players underperforming, it’s clear that the time for a championship has come and gone for this group. The Mets need to get younger and it starts with the old addition-by-subtraction technique. By dumping aging veterans with big contracts, the Mets will be able to allocate their resources and maybe pick up some pieces in free agency while simultaneously giving their top prospects playing time and allowing them to develop. As the great Cosmo Kramer once said on Seinfeld, “I think it’s time that we shut down and re-tool.”


Analyzing the League’s Launch Angle Profile

Home runs are up across the league and everyone is searching for reasons. One assumption that would make sense is that with the feedback system of Statcast, the league gets closer together in launch angle since we know that the best hitters have an average LA of around 12-15 degrees and players that are way off that would be incentivized to correct that or else be replaced by other hitters who can do it.

First, let me say that I used at-bat cutoffs since that is what Statcast allows for. I used 250 for 2015 and 2016 and 100 for 2017 to date. That probably changes the values a little. Specifically my average LAs look higher than the usually-cited league averages, probably because bench players who hit weakly are excluded.

Looking at the average LA, the chosen group of hitters went up from 11.7% in 2015 to 15.9% in 2016 (+4.2) to 16.6% (plus another 0.7).

So what did definitely happen was an increase of the launch angles across the board. However, when looking at the standard deviations, the league did not get closer together. SD was 3.6 in 2015, 3.8 in 2016 and 4.2 in 2017. It seems like not everyone is adjusting at the same pace.

So let’s look at different subsets here.

The average of the top 20 went way up from 17.8 in 2015 to 25.1 in 2017 (+7.3). The average of the bottom 20 also went up, from 4.2 to 8.0 (+3.8) degrees. The Q25 went up from 9.4 to 13.9 (+4.5) and the Q75 from 14.3 to 19.2 (+4.9) degrees.

So LA definitely went up across the board in all groups, but if anything it accelerated more at the top than on average or at the bottom. The league is increasing LA but so far it is not getting closer together.