Archive for October, 2014

Who Should Be the Cardinals’ 2015 Center Fielder?

With the Cardinals season recently finished, and the end of season press conferences over, one thing was made clear for the 2015 season in St. Louis: center field was Jon Jay’s to lose. I have a few problems with this. First of all, I hate guaranteed starting jobs. I’m not saying it will happen, but it is very easy for players to fall into more of a relaxed state when they know they don’t have to fight for their playing time. As we saw in 2013, when Jay had no competition for the job, he’s not immune to becoming too relaxed in his play. Second, I still am not convinced that Jon Jay is the best center fielder on our team.

Let me make one thing clear: this is not an anti-Jay piece. I really enjoy having Jay on the team, and I think he’s a very solid piece to the team. I would love for the Cardinals to retain Jay, I’m just not sure I want him to be our starting center fielder.

Jay has generally been pretty consistent in his play throughout his career. He has 5 seasons with over 300 plate appearances since 2010, and he wRC+ over that span have all been between 115 and 116 with the exception of 2013 – a season which seems to be pretty unlucky as his BABIP dropped 30 points despite his batted ball profile remaining mostly the same. At this point in his career, it seems like we know (mostly) what type of player Jay is – an above-average hitter, with limited power, and basically average skills everywhere else.

While there is value in being average to above average everywhere, the Cardinals have another center fielder that seems to be mostly average at the plate, but has elite skills when it comes to base-running and fielding. Peter Bourjos, for his career, has posted a wRC+ of 94 – just six percent shy of being a league average hitter. While you could argue that it’s mostly driven from 2011, you could also argue that was also the only season in which he’s received consistent playing time for a full season. On top of that, Bourjos was a league-average hitter or better at every stop in the minors on his way to the big leagues – so it’s not impossible to say that he could be a league-average hitter in the majors. Add into that Bourjos’s great speed (he’s been roughly five runs above average on a 600 PA rate throughout his career) and his elite defense, and Bourjos starts to look like a great candidate.

This year, Jay got nearly twice as many plate appearances as Bourjos, and produced roughly twice as many wins as Bourjos – which makes sense. When grading them on equal scales (WAR/600), the two center fielders produced identical 3.2 win values – which brings me to the next point for starting Bourjos.

The Cardinals have long been looking to improve their offense on their bench. For years the Cardinals have had one of the weaker benches of postseason contenders, and every year they look to improve upon that. With Jay providing a clearly better bat (his career wRC+ is nearly 20 percent better than Bourjos), it seems like a good (cheap) way to improve the bench without hurting the starters. Bourjos provides similar (if not better) value to the everyday line-up, while Jay gives the Cardinals a solid bat to come off the bench.

While it’s unlikely we see this happen, barring Jay returning to his 2013 play, it seems like a reasonable route to efficiently take care of a problem so that the front office and focus on other areas of concern (the bullpen, other bench bats, back-up catcher). Mozeliak has an opportunity to make a quick, relatively cheap fix to an area of concern for his team – I just hope he and Matheny will let that happen.


The Unassailable Wisdom of Los Angeles Dodger Fans

Another exit from the postseason deprived the nation of tales of Dodger fandom and their proclivities–Dodger Dogs, Vin Scully, and, of course, leaving the game early. Why they leave early, beats me. Maybe they have premieres to attend. Maybe they’re going to foam parties. Maybe they’re trying to beat the traffic. Me, I don’t know. Like most FanGraphs readers, I’d guess, I have never been invited to a premiere. Or, for that matter, a foam party. (And I’m still not entirely clear as to what one is.) As for beating the traffic, yeah, I get it, average attendance at Dodger Stadium was 46,696 this year, highest in the majors, so I imagine that’s a lot of cars. But Dodger games took an average of 3:14 last year, which means that night games ended well after 10 PM, so one would assume that traffic on the 5 and the 10 and the 101 and the 110 would have eased by then, though I don’t live in a part of the country in which highways are referred to with articles, so what do I know.

Aesthetically, of course, the argument against leaving a game early is that you might miss something exciting–an amazing defensive play, a dramatic rally, last call for beer. That would seem to trump the concerns of early departers.

Especially a rally. A late-innings comeback is one of the most thrilling pleasures of baseball. But that made me wonder: Are they becoming less common? If so, wouldn’t that be an excuse, if not a reason, for leaving early?

During the postseason, you may have heard that the Royals have a pretty good bullpen. (It’s come up a couple times on the broadcasts.*) With Kelvin Herrera often pitching the seventh, Wade Davis the eighth, and Greg Holland the ninth, the Royals were 65-4 in games they led after six innings. Of course, a raw number like that requires context, so here is a list of won-lost percentage by teams leading after six innings:

Team W L  Pct.
Padres 60 1 98.4%
Royals 65 4 94.2%
Nationals 72 6 92.3%
Dodgers 81 7 92.0%
Twins 52 5 91.2%
Giants 62 6 91.2%
Orioles 72 7 91.1%
Indians 67 7 90.5%
Braves 62 7 89.9%
Tigers 70 8 89.7%
Rays 61 7 89.7%
Mariners 68 8 89.5%
Angels 76 10 88.4%
Marlins 51 7 87.9%
Cardinals 69 10 87.3%
Reds 61 9 87.1%
Yankees 67 10 87.0%
Cubs 59 9 86.8%
Brewers 63 10 86.3%
Athletics 65 11 85.5%
Phillies 53 9 85.5%
Mets 64 11 85.3%
Red Sox 52 9 85.2%
Pirates 61 11 84.7%
Blue Jays 61 11 84.7%
Reds 51 10 83.6%
Rangers 45 9 83.3%
Rockies 49 11 81.7%
Diamondbacks 49 12 80.3%
Astros 54 16 77.1%

Sure enough, the Royals did very well. The major league average was 87.7%. Kansas City, at 94.2%, easily eclipsed it. But, as you can see, so did the Dodgers. We certainly didn’t hear about their lockdown bullpen in their divisional series loss to the Cardinals. Presumably, the Dodger bullpen’s 6.48 ERA and 1.68 WHIP over the four games of the series had something to do with that. But during the regular season, the Dodgers held their leads.

How about the other way–what teams were the best at comebacks? Shame on Dodger fans if they were leaving the parking lot just as the home team was launching a rally, turning a deficit into victory. Here’s the won-lost record of teams that were trailing after six innings:

Team W L  Pct.
Nationals 14 54 20.6%
Athletics 12 52 18.8%
Angels 11 48 18.6%
Pirates 11 50 18.0%
Giants 13 60 17.8%
Marlins 14 66 17.5%
Royals 11 58 15.9%
Cardinals 8 47 14.5%
Indians 10 59 14.5%
Tigers 9 54 14.3%
Orioles 8 50 13.8%
Reds 10 64 13.5%
Astros 9 64 12.3%
Mariners 8 57 12.3%
Brewers 8 59 11.9%
Blue Jays 8 60 11.8%
Yankees 7 53 11.7%
Padres 9 71 11.3%
Mets 7 59 10.6%
Twins 9 77 10.5%
Phillies 8 71 10.1%
Red Sox 8 72 10.0%
Diamondbacks 8 73 9.9%
Rays 7 66 9.6%
Cubs 7 71 9.0%
Rockies 7 72 8.9%
Rangers 7 74 8.6%
Reds 5 67 6.9%
Braves 3 60 4.8%
Dodgers 2 54 3.6%

Whoa. Ignoring for now the late-inning heroics of the Nationals, who were able to come from behind to win over one of every five games that they trailed after six innings, look who’s at the bottom of the list! The Dodgers trailed 56 games going into the seventh inning this year, and won only two.

So maybe the Dodger fans who left games early are on to something. I devised a Forgone Conclusion Index (FCI) by combining the two tables above. It is simply the percentage of games in which a team leading after six innings comes back to win the game. For example, the Royals led after six innings 69 times and, by coincidence, trailed after six innings an equal number of times. Their Forgone Conclusion Index is 65 Royals wins when leading after six plus 58 opponents’ wins when the Royals trailed after six, divided by 138 (69 plus 69) games in which a team led after six innings. The Royals’ FCI is thus (65 + 58) / 138 = 89.1%. The team leading Royals games going into the seventh inning wound up winning just over 89% of the time. A Royals fan wishing to leave a game after six innings did so with 89% certainty that the team in the lead would go on to win. (Yes, I know, I should do a home/road breakdown, but this is a silly statistic anyway.)

Here’s the Foregone Conclusion Index for each team last year.

Team FCI   Team FCI   Team FCI
Dodgers 93.8% Rangers 88.1% Giants 86.5%
Padres 92.9% Indians 88.1% Blue Jays 86.4%
Braves 92.4% Tigers 87.9% Nationals 86.3%
Twins 90.2% Phillies 87.9% Diamondbacks 85.9%
Reds 90.1% Red Sox 87.9% Angels 85.5%
Rays 90.1% Yankees 87.6% Reds 85.2%
Royals 89.1% Mets 87.2% Marlins 84.8%
Orioles 89.1% Brewers 87.1% Athletics 83.6%
Cubs 89.0% Rockies 87.1% Pirates 83.5%
Mariners 88.7% Cardinals 86.6% Astros 82.5%

And there you have it. The Dodger patrons leaving the game early weren’t being fair-weather or easily-distracted fans. Rather, they were simply exhibiting rational behavior. They follow the team for which the team leading after six innings was the most likely in the majors to hold on to win. They were the least likely fans to deprive themselves of the excitement of a late-inning comeback by leaving early.

I know what you’re thinking: Single-season fluke. There have to have been more comebacks in Dodger games in recent years, right? As it turns out, yes, but not a lot. The Dodgers were eighth in the majors in Foregone Conclusion Index in 2013 (87.8%) and seventh in 2012 (90.4%). Maybe 2014 is an outlier in which there were an extremely small number of comebacks in their games, but over the 2012-2014 timeframe, only the Braves (91.8% FCI) and Padres (90.9%) have played a higher proportion of games in which the team leading entering the seventh inning has gone on to win than the Dodgers (90.8%).

So keep it up, Dodger fans. Get into your cars during the seventh inning, turn on Charlie Steiner and Rick Monday on the radio, and drive on your incrementally less crowded highways on the way to your premieres and foam parties. You probably won’t be missing a comeback, and by leaving early, you’re expressing your deep understanding of probabilities.


*TBS managed to botch a fun fact about Kansas City’s bullpen. At one point, they posted a graphic stating that the Royals are the first team to have three pitchers–the aforementioned Herrera, Davis, and Holland–to compile ERAs below 1.50 in 60 or more innings pitched. They forgot the key qualifier: Since Oklahoma became a stateThe 1907 Chicago Cubs featured three starters with ERAs below 1.50: Three-Finger Brown (1.39), Carl Lundgren (1.17), and Jack Pfiester (1.15). The Cubs’ team ERA was 1.73.


Bill James Awards

The piece below is not endorsed by Bill James, writer and sabermetrician, or, for that matter, anyone else named Bill James. Mr. James did not contribute to this piece and I make no claim that it expresses his views.

It’s award season in MLB. Gold Gloves, Silver Sluggers, MVPs … it’s a lot of fun, so let’s review some other, less official awards that should be recognized. Some of these were inspired by The New Bill James Historical Baseball Abstract, while others are just off-the-wall trivia. After the jump, we’ll distribute:

* The George Grantham Award, for above-average performance in every offensive statistic.

* The other George Grantham Award, for errors at a key defensive position.

* The Joe Morgan Award. This honors the best percentage player in baseball, not idiocy in public statements.

* The Craig Biggio “little stats” award.

* The Ernie Lombardi Award, for great hitting despite slowness afoot. Measured as the difference between BA and BABIP.

* The other Ernie Lombardi Award, for worst GDP rate.

* The Ned Garvin Trophy, recognizing valorous performance by a pitcher on a bad team.

* The George Brett Citation, for exceptionally balanced offensive skills. Related awards include the Barry Bonds Distinction and the Jesus Alou Demerit.

* The Ozzie Guillen Trophy for fewest walks per plate appearance.

* The Jim Palmer Award, for outperforming one’s FIP, and its opposite, the Nolan Ryan Trophy.

* Also some quick ones: the Tris Speaker Trophy, the Sam Crawford Medal, the Mulcahy Award, and the Roger Maris Decoration.

Read the rest of this entry »


The Outcome Machine: Predicting At Bats Before They Happen

A player comes up to the plate. He’s a very good hitter; he’s hitting .300 on the year and has 40 home runs. On the mound stands a pitcher, also very good. The pitcher is a Cy Young candidate, and his ERA sits barely over 2.00. He leads the league in strikeouts and issues very few walks.

After a 10-pitch battle, the pitcher is the one to crack and the batter slaps a hanging curveball into the gap for a double. The batter has won. His batting average for the at bat is a very nice 1.000. Same for his OBP. His slugging percentage? 2.000. Fantastic. If he did this every time, he’d be MVP, no question, every year. The pitcher, meanwhile, has a WHIP for the at bat of #DIV/0!. Hasn’t even recorded a single out. His ERA is the same. He’s not doing too great. But let’s be fair. We’ll give him the benefit of the doubt, since we know he’s a good pitcher – we’ll pretend he recorded one out before this happened. Now his WHIP is 3.000. Yeesh – ugly. If he keeps pitching like this, his ERA will climb, too, since double after double after double is sure to drive every previous runner home.

Now, obviously, this is a bit ridiculous. Not every at bat is the same. The hitter won’t double every single at bat, and the pitcher won’t allow a double every time either. Baseball is a game of random variation, skill, luck, quality of opponents and teammates, and a whole bunch of other elements. In our scenario, all those elements came together to result in a two-bagger. But, like we said, you can’t expect that to happen every single time just because it happens once.

So… how do we predict what will happen in an at bat? Any person well-versed in baseball research knows that past performance against a specific batter or pitcher means little in terms of how the next at bat will turn out, at least not until you get a meaningful number of plate appearances – and even then it’s not the best tool.

Of course, if we knew the result of every at bat before it happened, it would take most of the fun out of watching. But we’re never going to be able to do that, and so we might as well try to predict as best we can. And so I have come up with a methodology for doing so that I think is very accurate and reliable, and this post is meant to present it to you.

To claim full credit for the inspiration behind this idea would be wrong; FanGraphs author and baseball-statistics aficionado Steve Staude wrote an article back in June 2013 aiming to predict the probability of a strikeout given both the batter’s and the pitcher’s strikeout rates, which led me to this topic. In that article he found a very consistent (and good) model that predicted strikeouts:

Expected Matchup K% = B x P / (0.84 x B x P + 0.16)
Where B = the batter’s historical K% against the handedness of the pitcher; and P = the pitcher’s historical K% against the handedness of the batter

He then followed that up with another article that provided an interactive tool that you could play around with to get the expected K% for a matchup of your choosing and introduced a few new formulas (mostly suggested in the comments of his first article) to provide different perspectives. It’s all very interesting stuff.

But all that gets us is K%. Which, you know, is great, and strikeouts are probably one of the most important and indicative raw numbers to know for a matchup. But that doesn’t tell us about any other stats. So as a means of following up on what he’s done (something he mentioned in the article but I have not seen any evidence of) and also as a way to find the probability of each outcome for every type of matchup (a daunting task), I did my own research.

My methodology was very similar. I took all players and plate appearances from 2003-2013 (Steve’s dataset was 2002-2012; also, I got the data all from retrosheet.org via baseballheatmaps.com – both truly indispensable resources) and for each player found their K%, BB%, 1B%, 2B%, 3B%, HR%, HBP%, and BABIP during that time. This means that a player like, say, Derek Jeter will only have his 2003-2013 stats included, not any from before 2003. I further refined that by separating each player’s numbers into vs. righty and vs. lefty numbers (Steve, in another article, proved that handedness matchups were important). I did this for both batters and pitchers. Then, for each statistic, I grouped the numbers for the batters and the numbers for the pitchers, and found the percentage of plate appearances involving a batter and a pitcher with the two grouped numbers that ended in the result in question. That’s kind of a mouthful, so let me provide an example:

1

These are my results for strikeout percentage (numbers here are expressed as decimals out of 1, not percentages out of 100). Total means the total proportion of plate appearances with those parameters that ended in a strikeout, while batter and pitcher mean the K% of the batter and pitcher, respectively. Count(*) measures exactly how many instances of that exact matchup there were in my data. Another important point to note – this is by no means all of the combinations that exist; in fact, for strikeouts, there were over 2,000, far more than the 20 shown here. I did have to remove many of those since there were too few observations to make meaningful assumptions…

2

…but I was still left with a good amount of data to work with (strikeout percentage gave me just over 400 groupings, which was plenty for my task). I went through this process for each of the rate stats that I laid out above.

My next step was to come up with a model that fit these data – in other words, estimate the total K% from the batter and pitcher K%. I did this by running a multiple regression in R, but I encountered some problems with the linearity of the data. For example, here are the results of my regression for BB% plotted against the real values for BB%:

3

It looks pretty good – and the r^2 of the regression line was .9653, which is excellent – but it appears to be a little bit curved. To counter that I ran a regression with the dependent variable being the natural logarithm of the total BB%, and the independent variables being the natural logarithms of the batter’s and pitcher’s BB%. After running the regression, here is what I got:

4

The scatterplot is much more linear, and the r^2 increased to .988. This means that ln(total) = ln(bat)*coefficient + ln(pitch)*coefficient + intercept. So if we raise both sides from the e, we get total = e^(ln(bat)*coefficient + ln(pit)*coefficient + intercept). This formula, obviously with different coefficients and intercepts, fits each of K%, BB%, 1B%, 3B%, HR%, and HBP% remarkably well; for some reason, both 2B% and BABIP did not need to be “linearized” like this and were fitted better by a simple regression without any logarithm doctoring.

Here are the regression equations, along with the r^2, for each of the stats:

Stat Regression equation r^2
K% e^(.9427*ln(bat) + .9254*ln(pit) + 1.5268) 0.9887
BB% e^(.906*ln(bat) + .8644*ln(pit) + 1.9975) 0.9880
1B% e^(1.01*ln(bat) + 1.017*ln(pit) + 1.943) 0.9312
2B% .9206*bat + .95779*pit – .03968 0.7315
3B% e^(.8435*ln(bat) + .8698*ln(pit) + 3.8809) 0.7739
HR% e^(.9576*ln(bat) + .9268*ln(pit) + 3.2129) 0.8474
HBP% e^(.8761*ln(bat) + .7623*ln(pit) + 2.995) 0.8963
BABIP 1.0403*bat + .9135*pit – .2573 0.9655

The first thing that should jump out to you (or at least one of the first) is the extremely high correlation for BABIP. It totally blew my mind to think that you can find the probability, with 96% accuracy, that a batted ball will fall for a hit, given the batter’s BABIP and pitcher’s BABIP.

Another immediate observation: K%, BB%, and HBP% generally have higher correlations than 1B%, 2B%, 3B%, and HR%. This is likely due to the increased luck and randomness that a batted ball is subjected to; for example, a triple needs to have two things happen to become a triple (being put in play and falling in an area where the batter will get exactly three bases), whereas a strikeout only needs one thing to happen – the batter needs to strike out. Overall, I was very satisfied with these results, since the correlations were overall higher than I expected.

Now comes the good part – putting it all together. We have all the inputs we need to calculate many commonly-used batting stats: AVG, OBP, SLG, OPS, and wOBA. So once we input the batter and pitcher numbers, we should be able to calculate those stats with high accuracy. I developed a tool to do just that:

For a full explanation of the tool and how to use it, head over to to my (new and shiny!) blog. I encourage you to go play around with this to see the different results.

One last thing: it is important to note that I made one big assumption in doing this research that isn’t exactly true and may throw the results off a little bit. The regressions I ran were based off of results for players over their whole career (or at least the part between 2003-2013), which isn’t a great reflector of true talent level. In the long run, I think the results still will hold because there were so many data points, but in using the interactive spreadsheet, your inputs should be whatever you think is the correct reflection of a player’s true talent level (which is why I would suggest using projection systems; I think those are the best determinations of talent), and that will almost certainly not be career numbers.


Hitting Wins Championships(?)

Over the past week or so, there have been baseball playoffs. And, like you, I have heard so many different opinions about what it takes to win a World Series Championship. Usually you hear “pitching wins championships”. This year, it’s “destiny”, “shut down bullpens”, and being a member of the San Francisco Giants. But what about hitting? Why is everyone so down on hitting? Isn’t it weird that the part of baseball people marvel at is brushed aside when trying to explain success in the postseason? Why have we never heard this?

Since I mostly despise the people that exclaim “THEY JUST KNOW HOW TO PLAY IN THE POSTSEASON” without any regard to statistics, I went back and looked at the World Series winners since 2002. I only went to 2002 because some data isn’t available on FanGraphs for the stats that I wanted to use.

The stats I used for this article

Starting Pitching and Relief Pitching

I used Wins, Saves, and Beard Length GB%, K%-BB%, and WAR because these are generally the three most looked at stats in terms of success for starting pitchers. I also felt it would give me a broader picture of the staff instead of just looking at WAR and being done with it.

Hitting

I used Runs, RBI, Bunts wRC+ instead of WAR because I wanted to isolate what the player did at the plate. We’ll look at defense and base running later. I also used K%, BB%, BB/K, ISO, and O-Contact%. I used the percentage and ratio stats to see if good discipline or free swinging mattered most. ISO is a better indicator of power than SLG and home runs. Using O-Contact%, however was a niche of mine that I threw in because I’ve always been scared of guys that have a bigger strike zone than others. It was also inspired by this Ken Arneson series of tweets. In theory, guys with higher O-Contact% rates are also harder to strike out, are more prone to BABIP luck, and also “put more pressure on the defense.”

Baserunning

I used BsR to measure both the weight in stolen bases and base running performance.

Defense

Even though it is far from perfect, I used UZR to quantify defense. Inspired by the Kansas City Royals, I also included outfielder UZR for this exercise.

Methodology

I picked out every WS winner since 2002 and wrote down the number of each stat mentioned above, and the league rank that went along with it. Here is my Excel spreadsheet, if you’re interested. I picked out the importance of each statistic based on top-5 and top-10 rank, and, to mirror the successes, bottom-10 and bottom-5 rank.

Results

If you looked at the spreadsheet that I linked to, you’ll notice that the statistic with the most top-5 rankings, the fewest bottom-10 rankings, AND the highest average ranking is wRC+. In fact, four of the top five stats with the highest average rank were hitting statistics. The top-5 with average rank: wRC+ 7.58, BB/K 9.17, SP WAR 10.17, ISO 10.25, O-Contact% 10.42. I’m not trying to say nothing else matters, but the data seems to suggest that teams need a better offense more than they do starting pitching, if only slightly so.

On the flip side of things, the statistic with the most bottom-10 ranks, and lowest overall ranking (K% would be lowest, but remember, lower is better with K%) is GB% for starting pitchers. Only the ’04 and ’11 Cardinals had a top-5 GB% while also getting league average (Rank > or = to 15) WAR from their starting pitchers. Six out of the 12 teams listed here posted bottom-10 ranks in GB%, which is incredibly interesting, given the theories behind ground ball pitchers that are so commonly found on the web nowadays. Does this mean ground balls are not important? Well, no. But it does mean that they may not be as important as they once were thought to be.

Base running didn’t end up being as big of a factor as I thought it would be, the Cardinals apparently care not for good defense, but look at O-Contact%! It was the fifth most important stat by average rank, and finished with only one team (’04 Red Sox) in the bottom ten, as opposed to six top ten placements. Furthermore, the rate at which teams struck out mattered more than how often they walked, but BB/K is the peripheral that seems to be the most telling.

We’ll probably never hear about how an offense won a team a World Series. In fact, we’ll probably instead hear it spun as a pitcher blowing the game. But at least now we have statistical evidence (even if it is only the past 12 years) that offense IS a major player in deciding who wins the World Series. We also have evidence to suggest that maybe hitters who expand the strike zone to their advantage are more valuable than has been discussed recently. Admittedly, this would take another article to deduce. Any takers?


Searching for a Postseason Fatigue Effect

Introduction:

If you had to pick one specific topic as baseball’s most prominent overarching narrative over the past couple years, there’s a good chance you would say “pitcher injuries”.  An era of high speeds and higher strikeout rates has been colored by constant announcements of elbow blowouts.  This year’s injuries alone included two guys who easily could have won their league’s Cy Young, Masahiro Tanaka and Jose Fernandez.

If you think the problem might be pitcher overuse, you’re in esteemed company. Since the famous “Joba Rules” of 2007, teams have experimented with limiting pitcher workloads to lessen the chance of injury.  The Washington Nationals famously limited Stephen Strasburg to 160 innings in 2012 in his first year back from Tommy John surgery.  (That storyline, by the way, was some of the greatest debate fodder baseball has seen in recent years.)

But sometimes an innings limit just isn’t feasible.  Sometimes a workhorse propels his team to the playoffs in a 33-start season, and then has to crank it up a notch for a playoff run. Surely that’s a form of overuse, right?  After a 250+ inning season — and a short off-season to boot — shouldn’t we be worried about fatigue or injury-susceptibility?  Let’s find out!

Methodology:

Obviously we can’t directly observe the answers to our questions, since we can’t observe the alternate-universe in which the previous year’s postseason pitchers didn’t go to the playoffs (though I hear Trackman is working on this). However, we can compare actual performance to projected performance. There are various projection systems out there, and for this study I chose Marcel. Though it’s not the most sophisticated system–you can find the basics here–Marcel compares well to the rest of the field. Keep in mind that all we need here is an unbiased system, not necessarily the most accurate one. Marcel is such a system, and it also has the advantage of being easy to download for multiple seasons (thanks to Baseball Heatmaps) and coming in a very similar format to the Lahman database, including identical player IDs. This makes comparisons between projections and actual performance a breeze.

So what we’re looking for now is whether postseason pitchers show a tendency to underperform their projections the next year, relative to pitchers who did not pitch in the postseason.  This could take the form of pitching less than expected or worse than expected.

Sample:

For the test group, I took all pitchers who started at least 28 regular-season games and at least 3 postseason games in a single year. I used all seasons from from 1995 to 2012. Basically, this means that the test group pitched (more or less) a full season and then pitched at least until the Championship Series, and they did so in the wildcard era.  For the control group, I took all pitchers with 28+ starts who did not appear in the postseason. For both groups I compared their Marcel projections with their actual performances from the next year (1996-2013).  I did not include 2014 because Lahman data is not yet available for this year.

A note about the samples: the test group pitchers are generally better than the control group pitchers. After all, they helped their teams reach the playoffs, and then were good enough to get a few postseason starts. There’s no reason to think this should taint our experiment, though. Remember, we aren’t worried about raw performance, but rather performance relative to projections.

Results:

First let’s look at playing time. If there really is a postseason effect here, we should expect our test-group pitchers to miss more time due to injury and ineffectiveness. In the case of our null hypothesis (no postseason effect) however, our test group should actually pitch more than the control group, since they’re better pitchers in general and therefore deserve to be given the ball more often.

Table1
N=161 and N=994 for the Test Group and Control Group, respectively.

As we can see both groups started more games than Marcel projected. This is actually unsurprising, since by definition our sample pitchers are more durable than average. The Marcel projection system regresses players to the mean (to varying degrees based on confidence levels), so the less durable and fringier pitchers we omitted pull the samples’ projections down.

The takeaway, however, is that the postseason pitchers exceeded their projected GS by much more than the control group did. This certainly refutes the hypothesis that postseason pitchers are more likely to go down next season. Let’s take a more detailed look with some density plots.

try2

The higher peak for the test group near 32 games started confirms what we just saw, that the test group generally pitched more. We also see that the control group is more densely populated at the left tail, which means that a higher proportion of these starters pitch very little the next year.  Again, they’re worse in general, so that’s not surprising from the perspective of the null hypothesis.

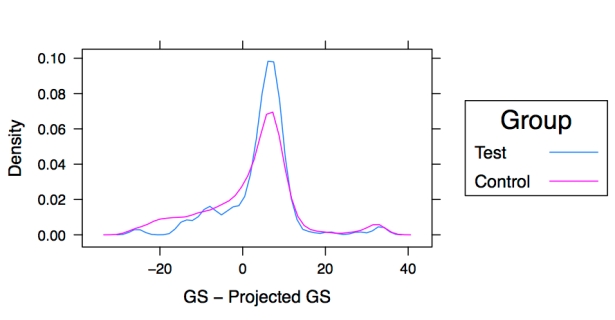
Now let’s look at the density plot for Games Started minus Projected Games started, to see in detail the ways in which both groups exceeded their projections.

try1

Both groups are equally (un)likely to exceed their projected starts by a great deal, as demonstrated by the near-identical right tails (this makes sense — you can’t exceed a 30-start projection by much).  For both groups, the most common result was to pitch a few games more than projected. However, the control group was somewhat more likely to fall far short of their projected starts. This gives more support to our null hypothesis: assuming no unique fatigue or injury effect, the test group is less likely to be ineffective enough to lose starts, since they’re better overall and may furthermore have built up some organizational goodwill from the previous year’s playoff run.

That seems to put the matter of playing time to rest. But what about results? Do postseason pitchers show a change in per-game performance the next year?  The below tables show the mean rates for both groups over various important pitching categories.

Tables

Tables
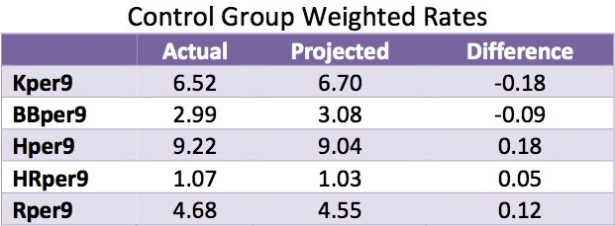
Note that in every category except Kper9, a small number is preferable. Thus, a positive value for (Actual Kper9 minus Projected Kper9) means the group outperformed projections, but a positive difference for all other categories means it underperformed.

In all five categories, the postseason pitchers did better relative to their projections than the non-postseason pitchers. Granted, some of those margins are thin, but this certainly provides more evidence that postseason fatigue doesn’t affect performance going forward.

This table is a bit misleading, however.  Calculating the mean rates for each group gives equal weight to all pitchers.  For our purposes, this is both good and bad. On the one hand, pitchers who only pitched a bit — and are thus liable to have some wacky rates — have a disproportionate effect on the group.   On the other hand, if a pitcher becomes so bad that his team has to pull him from the rotation, we want that to affect our calculations, since that’s exactly the kind of decline we’re researching.

With that in mind, let’s look at the same categories, but with both actual rates and projected rates weighted by actual innings pitched, so that we can get a good sense of each group’s real-world contribution.

Tables

Tables

As expected, this brings the difference between actual and projected performances closer to zero.  Still though, the test group is better than the control group relative to projections in all areas.

Conclusions:

In our search to find an impact of full season + postseason overuse, we’ve found nothing. In fact, if anything, results suggested a long season and postseason might be better for pitchers going forward. However, it’s unlikely that that’s a general truth. As I mentioned with Games Started, Marcel’s regression to the mean makes less sense when you single out durable pitchers as a whole. In terms of rate stats, differences between the two groups were generally small. As before, we can explain a bit of this difference through regression:

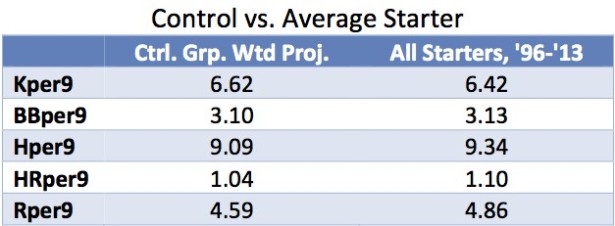
Marcel projections include a value for relative confidence, which signals how much the system regresses a player’s projections. The control group had a slightly lower overall value for this (0.78 vs. 0.80, weighted by actual IP), indicating that its values were regressed slightly more. Since the control group — despite being worse than the test group — was projected to be better than average for starters —

Tables
The left column is the control group’s projected rates weighted by projected IP (wheras in the previous charts everything was weighted by actual IP). The right column was calculated using Fangraphs data for K, BB, H, HR, R, and IP for all “Starters” over the same time span.

— we can tell that both groups were pulled in the direction of mediocrity. The lower confidence value for the control group means that those starters were pulled a bit harder. This extra pull could account for the fact that the control group was slightly worse relative to projections than the test group.

Overall, we’ve seen absolutely no evidence to suggest that a postseason run has a negative impact on a pitcher for the subsequent year. Perhaps a similar study of relievers would yield different results; pitching frequently in short bursts may have a different cumulative fatigue effect.

It’s also possible that the postseason fatigue effect does exist for starting pitchers but is not apparent after just one year, or it requires multiple full seasons plus postseasons to manifest itself. However, those questions pretty much boil down to, “can lots of difficult physical activity over a long period of time cause physical damage?” which is both boring and obvious.  The present study is interested in the immediate consequences of a long season.

We could also re-do the study with a more sophisticated projection system, but such a study would be unlikely to uncover something significant given that Marcel didn’t even hint at an effect. For now, at least, it seems wise not to argue “postseason fatigue” if James Shields has a poor April in 2015.

Player-season data comes from Sean Lahman’s database, both the “Pitching” and “PitchingPost” tables.  As stated in the piece, Marcel projections were downloaded from BaseballHeatmaps.com.  Finally, data for all starters over the relevant time span was obtained with Fangraphs’ “Custom Table” feature.


Albert Almora’s Inability to Walk

In 2012, the Chicago Cubs used the 6th overall draft pick to select Albert Almora, a high school outfielder from Miami. Almora was considered one of the top prospects in Chicago’s system and all of baseball entering 2014, ranking 36th on Baseball America’s Top 100, 28th on Keith Law’s Top 100, and 25th on Baseball Prospectus’s Top 101.

Almora struggled at the plate for a couple months in High-A this season before finally showing some brief improvement. This led to a promotion after just 89 games despite an OPS of .712. He performed even worse in Double-A, posting an OPS of .605 in the 36 games he played at the level. One of Almora’s most glaring flaws is his low walk rate—in 530 combined PA between the two levels at which he played this year, Almora walked just 14 times, a miniscule 2.6% of his plate appearances.

One explanation for Almora’s low walk rate is that his innate ability to make solid contact on most pitches prevents him from getting deep into counts and working walks. As Keith Law noted last offseason, “[Almora] has great hand-eye coordination that allows him to square up a lot of pitches, but has to learn to rein himself in and wait for a pitch he can drive to make full use of his hit and power tools — and if that means taking a few more walks, well, both he and the Cubs could use that right about now.”

We know that drawing walks is a good offensive skill to possess, but how problematic is it to be unable to do so? I wanted to better understand if it is possible for Almora to still have a successful major league career even if he is never able to overcome his inability to see ball four, and if so, how he might accomplish that.

I was a little surprised to find that out of all qualified major league hitters this year, the five lowest walk rates all belong to players who provided at least 2 WAR to their team, meaning they were at least average players. I examined how each player was able to do so despite posting a walk rate of 3.7% or lower.

Ben Revere owned the lowest walk rate in the MLB this year, coming in at 2.1%. Despite this, he was able to put up a respectable wRC+ of 92. Most of Revere’s offensive value comes from his ability to make contact (7.8% strikeout rate) and a high BABIP aided by his tremendous speed. He also provides a lot of value on the bases, where he is once again helped by his speed. While UZR hasn’t loved him in center field this year, he does play a premium position, and he has had better defensive numbers in the past. Revere mostly posted walk rates around 7-8% coming up through the minors, but his complete lack of power means that MLB pitchers are able to challenge him with strikes without having to worry about giving up extra-base hits. Revere has relied upon his speed to find success in the majors.

Adam Jones is the most successful of this bunch, posting a 5.4 WAR even with a walk rate of just 2.8%. Jones rates well in UZR this year and has won three Gold Gloves, but generally defensive metrics have not loved his defense, rating him below average in 2009-2013. Solid baserunning has helped Jones provide value to the Orioles, but his production mainly comes from his power, as he has a career ISO of .181. He has hit at least 25 home runs in each of the past four seasons, topping 30 twice. Jones’s power is his biggest asset and has allowed him to succeed, even with low walk rates and OBPs.

Salvador Perez posted a WAR of 3.3 in 2014, ranking him sixth among all catchers. Perez derives most of his value from two areas: his power and his plus defense at the most difficult position on the defensive spectrum. While the problems with measuring catcher defense have been well-noted, both stats and humans seem to agree that Perez is really good at it. On offense, his .148 career ISO has helped warrant a spot in the lineup, even while posting an OBP under .290 this year.

Next on the list is Alexei Ramirez. Ramirez’s greatest contributions come from playing an above average shortstop and running the bases well. He has put up solid, if unspectacular, offensive numbers thanks to good contact rates and decent power. Ramirez has been an average or above average player for five straight seasons even while walking only 4.4% of the time during that span.

The final player in this group is another Royal—Alcides Escobar, a shortstop known for his plus defense. His walk rates in the big leagues have mostly been around 3-4%, and his offensive production has fluctuated with his BABIP, as he relies on his average to carry his OBP. His strong defense at a premium defensive position and solid baserunning have provided enough value to keep him in the big leagues when his BABIP is low and to make him an average or above average player when it is high. 2014 was Escobar’s best season in the majors, but even when his offensive production is down, his defense and baserunning are able to make up for it enough to warrant a spot on a major league team.

Succeeding in the major leagues with a low walk rate is certainly possible, and these five players show there are multiple ways to do it. I think there are a few major takeaways from this exercise.

1) Players who rarely walk must get most of their value from defense and baserunning. All of these five players play a premium defensive position, allowing them to provide a lot of value on defense while requiring less of them at the plate. Most of them are also above average on the basepaths.

2) Players who rarely walk don’t necessarily have to be even an average offensive player, but they can’t be helpless either. They need to derive some sort of offensive value, whether it’s from hitting for power or making lots of contact and having a high BABIP to boost their OBP to a respectable level.

So where does this leave Almora? He checks off the first point, as most people seem to agree he is a plus defensive centerfielder, and although he’s not described as a burner on the basepaths, his instincts will likely allow him to be at least an average baserunner. At the plate, though, Almora still has a ways to go. While he doesn’t necessarily need to get his walk rate up a ton to be successful, he will have to find a way to provide more value than he has shown he can do this year.

It seems most likely that if Almora is to be a successful major leaguer, he will wind up in the Escobar/Ramirez mold—a player who makes plenty of contact and hits for a high average to support his OBP enough to keep him in a major league lineup while his defense accounts for most of his value. He still has a ways to go to reach even this level of competency at the plate, but he showed an ability to do it in the Midwest League in 2013, and he is still just 20 years old. 2014 was a step backward for Almora, and he’ll have to prove that he can provide some sort of offensive value if he wants to patrol centerfield on the north side, but he is not a lost cause and has the necessary skill set to succeed in the majors even with the impatience he has shown at the dish in his minor league career.


It Must Be Something: Explaining the Nationals-Giants series

Last week, the Washington Nationals lost their opening-round playoff series against the San Francisco Giants, falling 3-2 in Game 4 in San Francisco. The series offered a lot of gripping, exciting baseball; and for one Nationals fan, at least, it was an enriching experience even with the loss. (This post is written from a Nationals fan perspective, but may be of wider interest). After a close playoff series, it is natural to try to understand what happened. I’d like to look at an idea which has surfaced in prominent places in recent days:

** The Nationals suffered from a lack of poise in the face of the heightened pressure in the playoffs; and the Giants exhibited more poise, in a manner which contributed significantly to their victory.

This idea can be found in two recent columns by the Washington Post’s Thomas Boswell (“Washington Nationals must recognize, and embrace, that October is whole new ballgame” and “Hard truth is Nationals are not yet a match for the poised, traditional powers of the NL”, both from October 8). There is similar praise of the Giants in Jayson Stark’s ESPN article “For Giants, it’s ‘ugly, but it works’” (also October 8).

I’m afraid I think reactions like this are superficial. Both teams scored nine runs over four games, so by this familiar measure they were equal. But we all share a tendency to think that the Giants must have won for a good reason: there must be something which distinguishes the two teams. Rather than being unique to inquisitive baseball fans, this desire for an explanation has deep roots far outside the sporting world; it is codified in some circles as “the principle of sufficient reason.”

Regarding the baseball playoffs, this principle is often applied as follows:

Playoff contests between evenly matched teams are often won by the team which possesses more poise. As compared to the regular season, there is more pressure in the playoffs, and what really matters is whether you respond to this with poise. In fact, poise is so important in the playoffs that it often allows a less talented team to beat a more talented team.

Several factors combine to make the poise theory an inevitable diagnosis of the Nationals-Giants series. The Nationals had a better regular season record (96 wins vs. 88 for San Francisco) and are perceived as having more talent. Also, the Giants had established a reputation as a very poised playoff team by winning two of the previous four World Series. From my side of the country, it sounds like they also picked up a reputation for outperforming their regular season record in the playoffs.

Not only that, but in 2012 the Nationals had another excellent regular season before losing to the Cardinals in a five-game first round playoff series. As you know, the Cardinals also have a reputation for being a poised playoff team. And it should not be a surprise that the 2012 Nationals-Cards series seemed to lend itself to the explanation that the Cardinals exhibited more poise.

Our series matched a post-season poise team against a regular-season performer with question marks surrounding its playoff poise. So, after the series concluded in the manner that it did, a logical next step was the appearance of the poise theory.

The problem with the poise theory is that it starts with the winner and works backwards. It cherry-picks moments that are easy to remember, at the expense of more gradual or incremental dynamics. The theory routinely assigns these moments too much significance. Often, this mindset looks at only one side of what happened at various points in the game. The analytical result is that the winner won via poise, and the loser gets no credit for exhibiting poise, or any other positive qualities.

The poise account of the Giant-Nationals series is that the Nationals were frozen by the moment and didn’t hit well, that the Giants tied game 2 when down to their last out (and won it with a poised HR in extra time 9 innings later), that the Nationals made several on-field errors in game 4, and made two questionable (or just bad) bullpen-decisions in games 2 and 4…and that the Giants played gritty, opportunistic, mistake-free baseball throughout the series.

One obvious flaw in the poise account is that the last idea is false: Madison Bumgarner’s throwing error in game 3 allowed the Nationals to score 2 runs in their 4-1 victory. In addition, this error was triggered by a two-strike bunt from Wilson Ramos, which would seem to qualify as an exhibition of playoff poise (and of a player adapting to the moment, etc.).

Why doesn’t Bumgarner’s two-run throwing error count against our attribution of poise to the Giants? One reason is because we are working backwards from the fact that the Giants ultimately won the series. Since the Giants won a close series which can only be explained in terms of poise, elements of the series which clash with this narrative are suppressed to preserve the integrity of the explanation.

The “poise” explanation of the Giants’ victory is also challenged if we admit that the Nationals exhibited poise, because then the two teams do not differ in a way that explains the Giants’ victory.

Unfortunately for the poise theory, the Nationals displayed loads of this quality throughout the series – for example, via a two-strike bunt, via Jordan Zimmermann’s game 2, or via Doug Fister’s game 3. (If you are currently protesting that Ramos’ bunt was very improbable, you are just tracking the series outcome and the prior reputations of the teams).

Also, in game 4, although the Nationals certainly struggled in innings 2 and 7, including loading the bases twice, walking in a run, and throwing a wild pitch — they kept themselves in the game by limiting the total damage to 3 runs. This fact would have played very well in “poise” articles written in the scenario where the Nationals went on to win. It is now somewhat difficult for us to see poise at work in those innings. But again this is perception well shaded by the outcome. This illustrates how in baseball the attribution of poise just tracks who won a close game or series.

The poise theory cherry-picks parts of games; it also cherry-picks parts of plays. In the seventh inning of game 4, after his wild pitch, Aaron Barrett threw a ball over the catcher Ramos’ head; they were trying to walk the batter. But Ramos was able to recover the ball, Barrett covered the plate; and, in a poised, well-executed play, they threw out Buster Posey at the plate, thus preventing another run.

In game 2, with Drew Storen pitching in the 9th, Pablo Sandoval hit a ball down the left-field line which scored one run, which tied the game, and which threatened to score two. But the Nationals made two accurate throws starting from deep left field, and a good tag at the plate, to get Buster Posey (again, so to speak) at the plate.

The poise theory presumably gives Posey credit for pushing the action in close games; and here I agree. But we should also give credit to the Nationals for showing the poise, and, relatedly, the baseball fundamentals, to throw him out twice to prevent runs.

I think a normal look at poise finds it in abundance on both teams in this series. However, the baseball variant of this concept has a different logic. This variant just tracks the winner when the outcome is close.

In addition to the poise issue, there were other interesting aspects of the series.

Although the Nationals were regarded as the better team, the two clubs were not far apart with respect to many regular-season statistical measures.

Nationals batting (pitchers excluded):
.261 avg. / .330 oba / .407 slg. *** 107 wRC+, 151 HR *** 8.6% BB / 20.0% K

Giants batting (pitchers excluded):
.263 avg. / .319 oba / .401 slg. *** 107 wRC+, 128 HR *** 7.2% BB / 19.3% K

The two teams had very similar offenses, although the OBA and HR numbers represent real differences. Also, their K and BB rates cohere (to a small degree) with the idea that the Giants are more of a contact hitting team, in that they swung more (i.e., walked less) and struck out less than the Nationals. One suggestion I’ll make below is that some of the Nationals should have swung a bit more.

Turning to pitching, although the Nationals came in with a better pitching reputation, and although the Nationals have better pitching, this point is not straightforwardly validated by the full range of ERA-like measures made available by contemporary analysis:

Nationals: 3.03 ERA / 3.18 FIP / 3.43 xFIP
Giants: 3.50 ERA / 3.58 FIP / 3.59 xFIP

The pitching stats converge as we move to measures which factor out balls in play (roughly, FIP) and then factor out the home run/fly ball rate (roughly, xFIP).

FIP and xFIP bring the teams together; so do somewhat blunter measures like runs allowed per game:

Nationals: 3.43
Giants: 3.79

The teams’ xFIP’s were very close, and they were closer than I would have guessed in terms of Runs Allowed. The Nationals had a better record, but I think this was due in part to the Giants just playing the Dodgers more! These teams were closer than the lead-in fanfare communicated.

I’ll offer two observations about the Nationals’ hitting, both of which cut somewhat against the playoff poise theory. The first is that while the Nationals’ offense certainly has a high-gear mode, this is not the only face they present to the world on an ongoing basis. For instance, the non-pitchers were .252 avg. // 101 wRC+ in the first half of this season…vs. a .273 avg. // 115 wRC+ in the second half of the season.

The streakiness is due in part to a group of more or less low-average, high-power players (LaRoche, Desmond, Ramos). These players are somewhat prone to 4-0-0-0 nights anyway, and in the playoffs series the Giants appeared to have good plans for them. My subjective recollection is that there were many at-bats when these players were not close to getting a hit.

But what about the Nats’ better hitters? I am thinking of Rendon and Werth in particular, and again the Giants appeared to have a plan. Here I do have a concrete suggestion about what was going on. Werth and Rendon each had 20 plate appearances in the series, and they both had 10 appearances where they took the first pitch as a called strike. This may be a surprise to you, but I doubt it’s a surprise to the Giants. Werth and Rendon are both deliberate hitters, and I think the Giants resolved to take advantage of this, and to keeping throwing early strikes until Werth and Rendon made them pay.

Of course, Rendon batted .368 for the series, and Werth batted .056. However, Rendon’s hits were all singles, from a 21 HR / 39 2B hitter. The Giants gained an edge here – in a specific, tangible way – and Rendon and Werth didn’t make the requisite adjustment. But this is one piece of a story which could easily have been different. For example, Rendon hit a very deep fly ball in extra-innings game 2, which might have made it to the wall or farther in different wind conditions. Werth had similar misfortune on deep fly balls, the most memorable of which was Hunter Pence’s excellent catch late in Game 4.

The Giants deserve credit for executing a good approach against the Nationals’ hitters. On the other side, the Giants did not exactly light up the Nationals’ pitching. After game 2, the Giants did not score a run off a hit. So I suspect that the Nationals’ pitchers executed similar strategies as well. These layers of the competition are more remote to those of us who observe the game from the outside; but they are probably more significant than psychological differences between the teams.

What about Bryce Harper?

Bryce Harper did more than exhibit poise in this series. Bryce Harper displayed the superlative animal dynamism which our games can extract from us and showcase, the best they can offer. More than any other player, Harper elevated a series marked largely by deadlock and attrition. A series like that does require poise, which both teams showed. A series like that is exciting, but not transcendent. Poets celebrate poise when a contest offers little other inspiration.

OK, what are the proper takeaways?

Boswell writes

If you send the winning run home on a wild pitch (Aaron Barrett); if you can’t field a two-hop grounder back to the mound (Gio Gonzalez); if three players look at each other and none of them picks up a sacrifice bunt attempt (Gonzalez, Anthony Rendon, Ramos); if you can’t throw a strike with the bases loaded and walk home a run (Gonzalez); if you get confused and throw home when no Giant is actually running toward the plate (LaRoche), squandering an out, then you have no business staying at baseball’s October party.

Amen! But why not issue a similar edict against the Giants, who, again, did not score a run off a hit in the last two games? Out of context, that doesn’t sound like a terribly promising formula either.

Boswell also draws an analogy to golf: “Right now, the Nationals are like professional golfers who win a bunch of weekly Tour events but falter under the pressure in major championships.” His remark connects us with a long-running discussion in golf about competitors with various records in the majors (the Masters, the US Open, the British Open, and the PGA Championship) and in regular events. This discussion of golf players is characterized by an all-too-familiar blend of mythology, pop psychology, and information gaps. Nonetheless, I think there are instructive parallels between the majors and the baseball playoffs, which help us understand the recent Nationals-Giants series, and perhaps offer some lessons for the Nationals looking ahead.

Boswell’s peroration about disqualifying mistakes is wrong. Golfers win major tournaments despite serious, embarrassing, incriminating blow-ups. At Carnoustie’s 18th hole on Sunday of the 2007 British Open, Padraig Harrington twice hit his ball into a narrow, winding waterway, but ended up winning a playoff against Sergio Garcia. I am fine with the idea that you have no business trying to win a major if you find the water twice on the 18th hole. But this plausible moral stance is falsified by events. Similarly, in 1999, on the same final hole at Carnoustie, Jean van de Velde elaborated an even greater disaster; he blew a three-shot lead, but still qualified for a playoff.

The significance of an error depends on where you are in the competition and on what your opponents are doing. In a high-pressure situation, they may not be doing very much. At Carnoustie in 2007, the golf course and the moment got the better of everyone, in that the top three finishers (Harrington included) were a combined six over par for the last two holes. At Carnoustie in 1999, the course had been winning all week, in that no one finished under par for the tournament. In fact, van de Velde’s blow-up brought him back to a three-way tie for the lead at 6 over par. Looking at a different golf course, in the 2006 US Open, won by Geoff Ogilvy, the top four finishers all suffered serious damage on the final day, with Phil Mickelson and Colin Montgomerie taking double bogeys on the final hole.

The Nationals should work on their play inside the diamond, but they shouldn’t beat themselves up about it. Everyone is likely to screw up in the furnace of playoff pressure, including the Giants…who yielded two runs on one bunt.

Let’s say that an attrition contest is one in which even the winner takes a beating. Although this model is prominent in major golf, it is not universal. (I’m sure it isn’t in baseball either. But I have a better grasp of recent golf). Some players get a lead early and are never seriously threatened. Many of Tiger Woods’ victories fit this pattern. A recent, more mortal example is Martin Kaymer’s 8-shot victory in the 2014 US Open.

Another interesting major winner is Charl Schwartzel, who birdied the final 4 holes at the 2011 Masters, to resolve a highly fluid final-day horse race in which 8 different players had at least a tie for the lead at different times during the day. Five past or future major winners finished behind Schwartzel in the top 10, as well as Rory McIlroy, who lost a two-stroke lead, shot an 80 for the day, and finished out of the top 10. (McIlroy won the next major in 2011 and has since won three more majors). Schwartzel elevated his play above his competitors at the climax of one of the world’s great sporting events. In this setting, against this group, poise is out as an explanatory variable. Schwartzel won with the sort of imperious dynamism which I have already praised as the most admirable character trait athletic competition reveals to us.

I think the Nationals can win an attrition playoff series, because they almost did. (Just ask the Giants in a candid moment). But playoff success for them is likely to go by a different path. A team which can post a second-half 115 wRC+ (pitchers excluded) without a healthy Ryan Zimmerman and Bryce Harper, while posting a team 2.96 ERA over the same period, may not need to change the way it plays. It may need to embrace the way it plays.

Less poetically, I’m optimistic about what the team can do with a full season of Zimmerman and Harper, Harper, Harper :-).


Roster Doctor: Colorado Rockies

It was a grim year for the Rockies, with the once proud franchise sagging to 96 losses, just ahead of the woeful Snakes in the NL West. For this Dan O’Dowd, one of baseball’s longest serving GM’s, was finally shown the door, resigning rather than accepting the inevitable blindfold and cigarette. Rockies player development director Jeff Bridich now takes the reins, and he has a daunting challenge as he seeks to reinforce Colorado’s status as a purple state.

Faced with numerous roster holes, Bridich will confront perhaps the biggest decision of his GM career almost immediately: whether to trade Troy Tulowi(t)zki. Tulo was having an epic offensive season (.340/.432/.603, wth 21 HR in just 91 games) before injuries felled him, as they frequently do. In his 9-year career, Tulo has reached 600 plate appearances just 3 times. On the other hand, Tulo has failed to reach 5.0 bWAR (or, for the more traditionally minded, has failed to hit at least 20 HR) just 3 times. He recently turned 30, and is owed $20 million per year through 2019, during which his performance will inevitably decline as time’s relentless march claims another career. His contract will pay $14 million in 2020, followed by what will likely be a $4 million team buyout.

Trading Tulo is probably the only way the Rockies could even attempt to obtain young, impact starting pitchers who are at or near major-league ready. And the Rox staff is bad. Yes, Coors continues to waterboard pitchers, but the Rox were bad on the road too, regardless of your statistical weapon of choice (last in ERA, last in FIP, and 24th in xFIP). Bridich will need to examine innovative options (humidors? animal sacrifices? precision air strikes?) to aid in constructing an effective staff, but he’ll also need to at least consider trading the Rockies only real star.

The Mets, Reds, and Marlins have holes at SS and (perhaps) high-end pitching to trade, although only the Mets have it in quantity. What none of these teams probably has, however, is the will to take on a huge contract. Tulowitzki doesn’t have a no-trade clause, but the high value (both total and average annual) of his contract tends to act like one. If the Rockies could pry one or two of the Mets’ top young starters away, they should probably make the trade, but in the absence of that (and the Mets seem much more likely to trade with the Cubs, who have a glut of young, cheap, and potentially very good middle infielders), the Rockies should hold onto Tulo, and my guess is that they will. He has a legitimate shot at the Hall of Fame and is either still in his prime or just slightly past it.

This puts increased emphasis on finding solutions from the farm; that the team’s owners promoted Bridich, the player development chief, to the GM’s role suggests they have some confidence in the system he has overseen. The reviews this year on the pitching front are mixed: 3 of the Rockies’ top 5 prospects, as ranked by Baseball America during the preseason, were pitchers. Of those, Jon Gray (#1) had a good but not great year at AA Tulsa. His modest 3.91 ERA was worse than the team’s mark, but he was the youngest pitcher on the staff and his peripherals stacked up well. Eddie Butler (#2) on the other hand went backwards, as his strikeouts disappeared. While posting a decent 3.58 ERA at Tulsa, he only managed a 5.2 K/9 rate. Chad Bettis (#5) has already been moved to the pen, where he put up 24 Innings of Horror in the majors. Danny Winkler, not among BA’s Top 30 Rockies prospects, had a breakout year at Tulsa, posting a 1.41 ERA and strikeout and walk rates of 9.1 and 2.2, respectively. This is, however, about it; there aren’t many other horses in this cavalry brigade. It’s likely that none of these guys will develop into a true ace (though Gray still has an outside shot), but as the Orioles have demonstrated this year, it is possible to win without having a starter who even sniffs the Cy Young race.

Another but probably more tractable problem is the Rockies offensive ineptitude on the road. This is isn’t solely because of a drop in power; Rockies hitters on the road this year were last in on-base and 26th in slugging, leading to a wOBA of .278 on the road, better only than the San Diego Padres. Since their last postseason appearance in 2009, the Rox have been rock-bottom in road wOBA.

The good news for Bridich is that the damage isn’t uniformly spread throughout the batting order. Tulowitzki, Justin Morneau, Michael Cuddyer, Corey Dickerson, and Nolan Arenado were all effective on the road in 2014, with Arenado having the lowest road wOBA among that group at .314, a respectable mark compared to the MLB average of .310. The rest of the lineup was … well … let’s just go to the numbers (2014 wOBA):

Wilin Rosario           .235

DJ LeMahieu             .240

Carlos Gonzalez       .242

Ray Oyler                    .252

That’s Ray Oyler’s wOBA for his “career year” of 1967. Alert readers will have noted that Oyler did not in fact play for the Rockies in 2014, but his demon spawn did. Even Kershaw would struggle to win games with a 3-Oyler lineup behind him. Each of these guys presents a slightly different problem, so let’s take them in turn.

Wilin Rosario had a face-plant campaign for most of the year, but rallied at the end to put up batting and on-base averages (.267/.305) pretty close to his career numbers.  His power, however, receded (.435 SLG, compared to a career rate of .483). And oh my oh my oh my was he bad on the road, as Scott Strandberg covered in detail a few days ago. But there is some hope; while Rosario has always been weaker on the road than at home, he’s never been anywhere close to his abysmal 2014 performance. For his career (from 2012-2014) his road wOBAs are .305, .342, and <gulp!> .235 (I’m leaving out 24 PAs in 2011).

As Strandberg noted, Rosario actually improved his plate discipline this year, while dealing with rumors that he would eventually be forced to move to first because of his subpar catching skills. I’d be willing to bet that his late-season surge (.470 wOBA in September) was a sign that the swing-tinkering (if that’s what it was) was beginning to take effect, and that Bridich won’t write off his starting catcher based on 184 road PAs, even 184 as bone-chilling as Rosario’s last year. But the team will need to work with Rosario to either improve his fielding enough to keep him behind the plate long-term, or to improve his hitting enough to justify a move to first.

DJ LeMahieu can’t hit on a train. He can’t hit on a plane. He can’t hit a la mode. He can’t hit on the road. From 2012 – 2014, LeMahieu had the third worst wOBA on the road among players with more than 500 road appearances:

Darwin Barney    .237

J.P. Arencibia      .259

DJ LeMahieu           .260

Like Rosario, LeMahieu had some success on the road in the past, but much less of it. For the last three years, LeMahieu’s road wOBAs are .318, .252, and .240. He’s an excellent defender with plus speed who puts up ok numbers in Coors, but this skill set fits much better on the bench. Unlike Rosario, LeMahieu’s 2014 road performance was very much in character. It’s time for the Rox to look elsewhere for their second baseman. Minor leaguer Taylor Featherston might be able to help by the 2015 All-Star Break.

Carlos Gonzalez is a two-time All-Star who is only 28. He also hit like Ray Oyler on the road this year, which entirely accounts for his disappointing 2014 results. He was still very effective at home, posting a .407 wOBA in what was clearly his worst overall season. His road wOBA in 2014 was a full 80 points below his career road number. Some of this (perhaps a lot) is down to bad luck. CarGo had a miniscule .181 BABIP on the road, and he struggled (as usual) with injuries. It’s possible that he had the bad luck to suffer more from these on the road, or that the Rox medical staff did a better job keeping him healthy at home. In any case, Gonzalez is a much better player than his ghastly road numbers this year would suggest, and the Rockies have few alternatives available, in part because CarGo  will be hard to trade after this down year. Their best bet here is to stay the course, and to give the plate appearances he inevitably misses to Corey Dickerson if Dickerson’s not starting in center.

Bridich starts his new job with a wonderful ballpark, enthusiastic and knowledgeable fans, and a media market relatively free of piranhas. He won’t face pressure to make splashy moves, which is good, because he doesn’t have many to make.


Job Posting: Manager of IT and Technical Support, TrackMan Baseball

Manager of IT and Technical Support

TrackMan Baseball is looking for a resourceful, innovative, self-starter to take ownership of IT and Technical support for our network of stadium and remote data collection systems.


About TrackMan

TrackMan develops, manufactures and sells 3D ball flight measurement equipment used in a variety of sports. Today, TrackMan is the world leader in golf ball flight and club data measurements and the company is considered to have set the industry standards for accuracy in golf and baseball.


TrackMan Baseball measures stuff – the location, trajectory and spin rate of pitched and batted balls – and provides real-time feedback for coaching and a new set of statistics for analyzing player performance. TrackMan Baseball is used by the majority of Major League baseball teams and premier NCAA, international and amateur baseball programs. Additionally, TrackMan is used for R&D, marketing, and media purposes by equipment manufacturers to develop more effective products and broadcasters to enhance content and analytical capabilities.


Position Description / Responsibilities

Candidate will be responsible for overseeing and maintaining internal IT, Cloud services and supporting a network of distributed system located in Major League, Minor League and NCAA baseball stadiums, and amateur baseball tournaments. Responsible for effective installation/configuration, operation, and maintenance of systems hardware and software, proactive monitoring of critical and network systems and troubleshooting. Candidate will support the company in the overall design and implementation of IT systems.


Responsibilities include, but are not limited to the following

  • Optimize, develop and implement monitoring efforts and system building.
  • Design, develop and document solutions for troubleshooting
  • Interact with internal and external IT and non-IT personnel when setting systems and diagnosing problems.
  • Manage a team, set schedules and develop escalation policies for a network operations center

Required skills:

  • Comfortable working on Windows & UNIX operation systems
  • Proficient with backup and disaster recovery plans
  • Experience system building and automation
  • Strong organizational, analytical and problem solving skills
  • Strong ability to multi-task /change focus quickly, ability to deal with unexpected events
  • Strong technical documentation skills

Desired Skills

  • Experience in programming both scripted and compiled languages.
  • Proficient with Microsoft SQL Server, working knowledge of relational database.
  • Knowledge of No-SQL databases
  • Experience with Cloud Services like Azure and Amazon


Education and Work Experience

  • Degree in Computer Science or related field experience.
  • 2+ years of experience managing IT

Location, Compensation & Application

Location: This position is full time and based in Stamford, CT. Salary

Compensation: Commensurate with experience.

Application: Send resume and cover letter to: np@trackman.dk


About TrackMan Inc.

TrackMan Inc. is a US based subsidiary of TrackMan A/S.


TrackMan A/S has developed a range of products for the golf market and is considered the gold standard in measurement of ball flight and swing path. TrackMan’s golf products are used by top touring professionals, teaching pros, broadcasters and governing bodies.


TrackMan Inc. is based in Stamford, CT, about 30 miles north of New York City.  TrackMan, Inc. introduced 3D Doppler radar technology to the baseball industry and the technology is now used by more than half of Major League Baseball teams.  TrackMan, Inc. is revolutionizing baseball data by measuring the full trajectory of both the pitch and hit and has been featured in publications such as the New York TimesSports Illustrated and ESPN.