Allow me to start this post off with a couple of charts without any context about the player we are talking about.
Let’s talk about this player for a second. His name is not of consequence, yet. This player has fluctuated from being an above-average producer of runs and slightly-below-average producer of runs for close to 10 years now. This means he’s been around a long time, so his profile as a hitter is solidified; he has a reputation. Something funny has happened in 2016 and 2017 as evidenced by the LARGE upward line. That’s good! Can you guess who this player is? No? Come on, one guess. Okay, fine. It’s Mark Reynolds! Yes, that Mark Reynolds!
Mark Reynolds once hit 44 home runs. Do you remember that? When I said, he had a reputation, I meant to say that he’s well-known for the three true outcomes: walks, strikeouts, and home runs. Not much else. He’s a first baseman, which means his defensive value is minimal at best. So basically, his value is his offense. He’s signed for $1.5 million this year and is currently a top-10 first baseman in the MLB by fWAR. He’s top-8 by wRC+, and top-4 by wOBA. He’s already exceeded the value of his contract. The obvious caveat here: it’s May 9th. The other obvious caveat is he plays for the Rockies now, which means he gets to play 81 games (give or take) at Coors Field.
I don’t know if he can sustain this. I too see the name Mark Reynolds and think, 30% K rate, with a decent amount of power. The thing is, he’s not striking out in 30% of his plate appearances. He’s not even striking out in 25% of his plate appearances. You want to know how often he’s striking out? After today’s day game with the Cubs, he’s striking out only 21.1% of the time. That’s, dare I say, below league average (League wide K% currently is 21.5%). I’m going to throw some more numbers together to try and articulate an idea: Mark Reynolds is up to something.
This doesn’t seem to be a one-year fluke. Reynolds is a slightly different player than he was two years ago. His K% has been on the decline since 2015, when it was 28%. Last year it was 25.4% and obviously now it’s 21.1%. So let’s go to his plate discipline to see what’s changed.
Looking at his O-Swing% and PITCHf/x O-Swing%, there isn’t a huge difference. They both hover in and around his rate of 26-27%, though PITCHf/x has him at 29.5%. The real difference is in his Z-Swing%, where he has decreased his percentage over the last two years. In 2015, it was around his career norm of 70% by Baseball Info Solutions and 67% by PITCHf/x. The last two years: 69.4% and 66.2% respectively by Baseball Info Solutions, 66.2% and 64.9% respectively by PITCHf/x. He seems to be pickier in the zone overall and there is a tangible result.
His Z-Contact% career average as calculated by PITCHf/x and Baseball Info Solutions is 74.3% and 74%, respectively. In 2015, he made contact with pitches in the zone 80% of the time by both systems. Last year? 81.9% by Baseball Info Solutions and 84.6% by PITCHf/x. This year? 85.4% and 84%. He’s making more contact overall for the last two years, as it’s been in the 70% range rather than the 60% range. His SwStr% has been decreasing too! It’s been below 13% the last two years, where his career average is 15.7%. This is a different Mark Reynolds.
Maybe Reynolds is trying to take more pitches in the zone so he can focus in on his best pitch. The power is there — his ISO is .339, with 12 home runs thus far. Probably not sustainable, but 30 home runs can be reached even with a return to the average.
About that park factor, though. He really hasn’t hit much differently at Coors versus away from Coors.
The same amount of hits, admittedly more home runs, same amount of strikeouts, same amount of walks. Slightly odd thing — he has a reverse platoon split. Let’s chalk that up to small sample size. One more chart that I feel is important:
This chart befuddles me. He’s hitting fewer fly balls than league average (opposite league trend as touched on at FG main page), more ground balls than league average, and slightly more line drives than league average. Something funny is happening here. So, here’s the thing. His HR/FB is 44%. Aaron Judge is at 46.4% and no one expects him to sustain it. League average is 12.8% and Reynolds’ career high is 26%. His career average is 19.4%, which he hasn’t reached since 2011.
It all comes back to small samples, but even if he comes crashing back down, there’s still proof he’s trying to make a change. He’s making more contact and we know contact is a good thing, and this has been happening for more than just 30 games. If he sustains a fraction of this pace, he becomes trade bait at the deadline, or he stays part of a contender, and he may even get a pay raise in free agency. Mark Reynolds has made himself interesting.
Center fielder/sabermetric superstar Kevin Kiermaier signed an extension with the Tampa Bay Rays for 6/$53.5M this week. Dave Cameron of FanGraphs notes that he will receive roughly $30M for three arbitration seasons and $12M per year for three free-agency seasons. There will also likely be a $12M team option. Cameron’s article, while rightfully criticizing Major League Baseball’s flawed arbitration system, will run counter to my argument. Kiermaier is an excellent player, no doubt – a defensive whiz, a great base runner, and a league-average bat to boot. One thing that is not on his side is age. Kiermaier will be 27 this season, would have been 30 in free agency, and will be 33 or 34 when his contract is over. Much of Kiermaier’s value is derived from his defensive prowess; he has recorded a 44 UZR for his work in center field in his career. While this is impressive, the precedent for Kiermaier to continue this excellence through his free-agent years is unlikely. Let’s consider the center fielders of the UZR era who have signed significant free-agent contracts.
Major Free Agent Center Fielders’ UZR
Player
FA Age
Contract
CF UZR (Pre-Contract)
CF UZR (Post-Contract)
Carlos Beltran
28
7/119M
16.1
15.1
Juan Pierre
29
5/44M
32.6
-0.8
Gary Matthews Jr.
32
5/50M
12.4
-24.4
Torii Hunter
32
5/90M
11.9
-17.7
Aaron Rowand
30
5/60M
46.2
7
Melvin Upton Jr.
28
5/75.25M
18.6
1.6
Angel Pagan
31
4/40M
-1.5
-25.6
Michael Bourn
30
4/48M
51.6
-14.2
Jacoby Ellsbury
30
7/153M
28.9
-2
*data via FanGraphs
Here we see a list of center fielders with (mostly) fantastic defensive records before signing a free-agent contract around the age of 30. With the exception of Carlos Beltran, the youngest player on this list, every single one of these players’ defensive values in center cratered. All of them were or will be rendered unplayable in center before the expiration of their contracts. Kevin Kiermaier is a fantastic center fielder, but even he is no immortal among these men. With the stench of the Jacoby Ellsbury deal still fresh in the air, it is likely that most executives around the game will prefer developing defense rather than buying it.
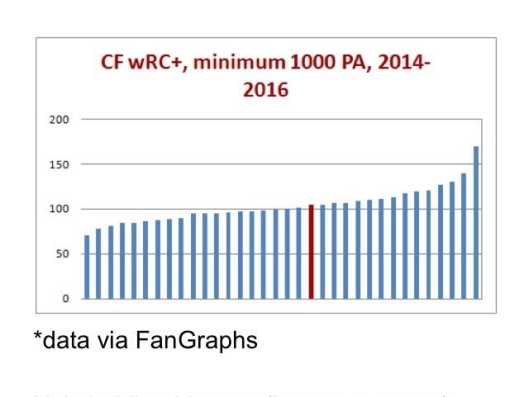
The Rays get to pay Kiermaier $24-36M for 3-4 free-agent seasons in exchange for the guaranteed money during his arbitration years, but if Kiermaier the hypothetical free agent isn’t going to be paid for his defense, is his bat really going to be worth 3/$24M or 4/$36M? Looking at Kiermaier’s place among center fielders with at least 1000 plate appearances in the previous three seasons, his wRC+ made him this red mark on the graph.
He’s holding his own (league average), and this is around where he has been for his whole career, but this is also supposed to be his prime. If this is the offensive peak (plateau?) of Kevin Kiermaier, it’s hard to imagine him creating $24-36M worth of value if the plateau crumbles around the age-30 mark.
While Kevin Kiermaier is a bona fide stud, it’s likely he will only be one until he reaches what would have been his free-agent years. By signing this extension, I believe Kiermaier increased his career earnings, while taking that money guaranteed. However, don’t presume that Tampa was reckless about the $24-36M they will allocate to Kiermaier over those last three or four years; precedents can be broken, and he is an awesome player. It’s also important to consider the new asset that Tampa upgraded to, a nice Adam Eaton-esque carrot to dangle in front of interested teams – seven years of control of Kevin Kiermaier.
Following up on excellent recent pieces by Travis Sawchik and Jeff Sullivan, I had a hypothesis: If there is truly a swing-path revolution underway in MLB, perhaps the best hitters by wOBA and wRC+ showed more marked FB+LD%’s (Air%) tendencies in 2015-2016 than in years past? If not them, then perhaps there is a trend among the middle and/or lower classes of hitters?
The hypothesis was wrong, but the investigation still gave some interesting context to the 2016 power spike and the profiles of recent successful/unsuccessful MLB hitters in general.
Here’s a plot of the average FB%+LD% (Air%) for each year, 2009-2016, for all qualifying MLB hitters per FanGraphs leaderboards, divided into three roughly even buckets of 40-50 players by wRC+ (<100wRC+ left, 100-120wRC+ center, >120 wRC+ right):
Here’s a plot of the average FB%+LD% (Air%) for each year, 2009-2016, for all qualifying MLB hitters per FanGraphs leaderboards, divided into three roughly even buckets of 40-50 players by wOBA ( <.320 left, .320-.350 center, >.350 right):
The consistency of these numbers is remarkable. The writing has been on the wall for some time with regards to the benefits of hitting it in the air.
Perhaps plenty of hitters are (and always have been) trying to hit it in the air more often and are either failing to make the change stick, or not finding success quickly enough to stick with the change / stay in the league?
We aren’t seeing across-the-board nor player-class-specific changes that stand out beyond random variation by this method (yet).
There could be an equilibrium point here where given the best pools of pitching and hitting talent available (regardless of how they arrived at said status), the outcomes will be pretty similar at a macro level, save for major fundamental changes to how the game is played.
This does not mean that individual players cannot aspire to find more optimal approaches. Surely there have always been hitters finding success via these means, and only recently have we been focusing on batted-ball data and focusing on these traits of the transformations.
So I got a little carried away with the new splits leaderboard when I was looking up some wRC+ data. I was curious about which players performed the best/worst in high-leverage situations and one thing led to another and it led me to looking at top performers across the three leverage situations (low, medium, and high). If you want to know more about how leverage is calculated there is an old article in The Hardball Times here.
I used the splits leaderboards to gather 2016 hitter data by leverage situation and I only included players who had a minimum of 20 PA per split. Once I gathered all the data I converted each player’s wRC+ by leverage situation to a percentile and calculated each player’s mean percentile rank along with the variation around the mean using standard deviation to produce the following plot.
The blue line is just a LOESS line showing the general trend of the data. What the line is telling us is that players on the extreme end of the percentile ranks also seem to have the lowest variation or, more simply put, good players seem to be consistently good and bad players seem to perform poorly across all leverage situations. Using that plot as my baseline, I started exploring the data to answer some question about player performances in 2016. I included the top 10 players in ordered tables going from from least interesting to most interesting, at least in my opinion. First, let’s look at the top performers from this year.
Players who ranked highest in wRC+ across all leverage situations
Leverage Rank
Name
Low
Medium
High
Mean Rank
SD
Mike Trout
98
97
99
98
1
Freddie Freeman
97
88
94
93
4.6
Josh Donaldson
97
94
88
93
4.6
Anthony Rizzo
93
88
97
92.7
4.5
Joey Votto
96
98
84
92.7
7.6
David Ortiz
96
99
77
90.7
11.9
Matt Carpenter
91
82
94
89
6.2
Paul Goldschmidt
88
86
88
87.3
1.2
Tyler Naquin
93
81
87
87
6
Ryan Schimpf
80
86
93
86.3
6.5
Boring, Mike Trout leads the way as the top performer. Apparently it doesn’t matter when he comes up to the plate; he is going to smash the ball. But I’m not going to focus on Trout, as I’m not qualified to write about him and he’s above my pay grade, so let’s leave him to the professionals. Like I said before, least interesting first and hopefully it’ll get more exciting as we go. Here’s a fun fact to keep you going: In high-leverage situations among players with a minimum of 20 PA, Ryan Howard led the league in ISO with a 0.640 mark. Ryan Schimpf was second with an ISO of 0.542. And Howard did that with a 0.118 BABIP, too.
Second, let’s take a look at the worst performers of the season.
Players who rated as the worst performers across all leverage situations
Leverage Rank
Name
Low
Medium
High
Mean Rank
SD
Yan Gomes
17
23
0
13.3
11.9
A.J. Pierzynski
17
21
9
15.7
6.1
J.B. Shuck
25
16
11
17.3
7.1
Nick Ahmed
15
35
3
17.7
16.2
Jake Marisnick
37
19
6
20.7
15.6
Ramon Flores
21
20
21
20.7
0.6
Gerardo Parra
33
29
1
21
17.4
Juan Uribe
19
38
11
22.7
13.9
Adeiny Hechavarria
20
34
15
23
9.8
Alex Rodriguez
19
30
22
23.7
5.7
After a pretty impressive career, although it also came with its fair share controversy, we see A-Rod make this list. And it doesn’t look like he is going to be playing again this year, which casts some doubt on whether he is going to make it to 700 career home runs (he’s currently at 696). But more importantly, our poorest performer of 2016 looks to be Yan Gomes. I was inclined to say A.J. Pierzynski should actually be considered the poorest performer of the year since his standard deviation was about half of Gomes’, but then I noticed that Yan Gomes was in the 0th percentile in high-leverage situations — literally the worst. Not all-time worst, but still pretty bad! And I guess if you want to argue that the worst percentile should actually be 1, as in the 1st percentile, then you could make that argument, but the value was rounded to 0 when Yan Gomes registered a whopping -72 wRC+ in high-leverage situations. The second-worst was Gerardo Parra at a -59 wRC+; that’s a pretty significant gap between first and second. Fun-fact time: In high-leverage situations, Mike Zunino ran a 30.8% walk rate, although he also struck out 30.8% of the time too. Yasmani Grandal had a 30.4% walk rate to go with a much smaller 13% K%.
Everyone always seems to be looking for players who are on the extreme ends of the leaderboards, but let’s give some love to the unsung heroes of the world, the completely average performers! I wasn’t sure if I simply wanted to use mean percentile rank as a measure for averageness, so I decided to go with what I called Deviation in the table. Deviation is calculated by adding the standard deviations (SD) of a players percentile ranks to the Δ50 column. The Δ50 column is calculated as the absolute value of a players mean rank minus 50.
The most average performers of 2016 in wRC+
Leverage Rank
Name
Low
Medium
High
Rank
SD
Δ50
Deviation
Scooter Gennett
55
46
49
50
4.6
0
4.6
Ezequiel Carrera
46
44
51
47
3.6
3
6.6
Leonys Martin
44
54
47
48.3
5.1
1.7
6.8
Matt Duffy
41
49
49
46.3
4.6
3.7
8.3
Avisail Garcia
45
51
42
46
4.6
4
8.6
Howie Kendrick
46
59
52
52.3
6.5
2.3
8.8
Johnny Giavotella
40
44
42
42
2
8
10
Jason Castro
47
49
62
52.7
8.1
2.7
10.8
Jonathan Schoop
62
53
54
56.3
4.9
6.3
11.2
Brandon Phillips
55
48
63
55.3
7.5
5.3
12.8
And Scooter Gennett comes away as the most average performer of the season! He also ran a 0.149 ISO on the season and I think 0.150 is usually considered average. Look how wonderfully average these guys were; we should all take a minute to enjoy the little things in life. I realize this may not be the sexiest table, but it’s still interesting. You might not be getting a whole lot out of these guys over an entire season, but they are going to go up there and do average things whether you like it or not.
Two tables left — hopefully you’re still with me here. Let’s look at consistency. People always say consistency is key. I guess that’s good advice except when you’re on the terrible end on the spectrum.
Table looking at the most consistent performers based on percentile rank
across the 3 leverage situation (low, medium and high)
Leverage Rank
Name
Low
Medium
High
Mean Rank
SD
Ramon Flores
21
20
21
20.7
0.6
Ivan De Jesus
32
32
33
32.3
0.6
Mike Trout
98
97
99
98
1
Paul Goldschmidt
88
86
88
87.3
1.2
Johnny Giavotella
40
44
42
42
2
Yunel Escobar
66
69
65
66.7
2.1
Hunter Pence
79
76
80
78.3
2.1
Wilson Ramos
81
80
85
82
2.6
Alexei Ramirez
26
32
28
28.7
3.1
Austin Jackson
43
38
37
39.3
3.2
Ramon Flores and Ivan De Jesus both had extremely consistent seasons; it’s just too bad they are on the wrong end of the spectrum. But I have to say Ramon Flores beats out Ivan De Jesus as he registered on average 12 percentile ranks poorer. In third we see Mike Trout showing incredible consistency while being the top performer in the league, followed closely by Paul Goldschmidt. It’s interesting see the top four players on this list from opposite ends of the spectrum, but the rest of this list bounces back and forth as well.
And here we are, the last one or as the title says “the Funky”. I found that volatility was the most interesting question, or which players showed the most boom or bust in 2016. Most of the players in this list performed best in low- and medium-leverage situations, often above the 90th percentiles.
Looking at players who showed the highest volatility based on percentile rank
across the 3 leverage situation (low, medium and high)
Leverage Rank
Name
Low
Medium
High
Mean Rank
SD
Sandy Leon
96
84
2
60.7
51.2
David Peralta
95
29
1
41.7
48.3
Dansby Swanson
23
99
15
45.7
46.4
Yangervis Solarte
93
73
5
57
46.1
Mac Williamson
59
95
4
52.7
45.8
Alex Avila
36
99
12
49
44.9
Jarrod Saltalamacchia
41
9
97
49
44.5
Pedro Alvarez
86
85
9
60
44.2
Ryan Zimmerman
21
85
1
35.7
43.9
Kris Bryant
98
91
19
69.3
43.7
After perusing though the list, one of the most interesting names that jumps out should be Jarrod Saltalamacchia and his 97th percentile rank in high-leverage situations last year. And here’s another twist, would it surprise you to hear that in 2016 Miguel Cabrera was the least-clutch hitter among all Tigers qualified hitters? Check out the Tigers leaderboard here. But the 2016 volatility award goes to Sandy Leon, who absolutely mashed balls in low-leverage situations, was no slouch in medium-leverage spots, but dropped off the map in high-leverage situations. I have no idea how BABIP relates to wRC+, but with Sandy Leon it looks like his BABIP reflects what was happening in the different situations (0.434, 0.393 and 0.190). There is probably some combinations of descriptive stats that would explain some of the variance, and BABIP may very well be included, but I’m not going to go into that here.
Hope you enjoyed this. If anyone wants a copy of the R code I used to make the graph and tables, leave a comment below and I’ll pass it along. I ended up finding a pretty cool library to create html tables in R so you don’t have to mess around with formatting and manual inputs. As long as you’re willing to put a little work into understanding css you can basically customize the look of your tables.
Similarly to a large portion of the FanGraphs community, I am a Philadelphia Phillies fan. I was born in South Jersey just 20 minutes away from the stadium and grew up watching every game. I was there for the tough times in the late 90’s / early 2000’s, and I was there for the glory days of 2007-2011. After an abysmal last few seasons of baseball in Philadelphia, we have finally seen some promise this season leading us to believe that better days are coming soon. One of the bright spots on the team so far this year has been Rule 5 pick, Tyler Goeddel.
After being selected in the first round of the 2011 MLB Rookie Draft, Tyler Goeddel began his professional career with the Tampa Bay Rays. Goeddel was drafted out of high school as a third baseman and for the first three years of his minor league career that would be the only position he played. In 2015, however, the Rays decided to move Goeddel to the outfield. His athleticism allows him to play all three outfield positions and that type of versatility is very sought after by big league clubs. While defense was never his problem, Goeddel’s bat didn’t develop as quickly as the Rays had hoped. He was a career .262 hitter with 31 home runs across four full seasons in the minor leagues. Ultimately the Rays made a tough decision and left him off their 40-man roster, knowing there was a great chance another team would select him in the Rule 5 Draft. Shortly after, the Phillies did just that and selected Goeddel with the first overall pick of the 2015 Rule 5 Draft.
The Philadelphia Phillies have historically been excellent in finding talent in the Rule 5 Draft. (2004 – Shane Victorino, 2012 – Ender Inciarte, 2014 – Odubel Herrera). In the early going, I (like most Phillies fans) was very skeptical as to whether or not Goeddel could follow in the footsteps of players like Shane Victorino and Odubel Herrera and become a valuable contributor to our big league team. Goeddel had a mediocre spring training but with no other serious competition in the corner outfield spots, there was no harm in keeping him around for a rebuilding year and seeing what the kid could do.
The beginning of Tyler Goeddel’s major league career could not have gone much worse. Take a look below at his stats through his first nine games:
In only 16 at-bats, Goeddel recorded only one hit (a single), and struck out a whopping eight times! Now obviously this is a VERY small sample size, and we should expect some struggles while adjusting to big league pitching. Up until this point, Goeddel has never seen pitching above the Double-A level. Now let’s take a look at his plate discipline stats over the same time frame:
O-Swing % – Percentage of time a batter swings on pitches outside the strike zone Z-Swing % – Percentage of time a batter swings on pitches inside the strike zone Swing % – Percentage of time a batter swings at a pitch, regardless of location O-Contact % – Percentage of times a batter makes contact with a ball when swinging outside of the strike zone Z-Contact % – Percentage of times a batter makes contact with a ball when swinging inside of the strike zone Contact % – Percentage of times a batter makes contact with the ball when swinging Zone % – Percentage of overall pitches thrown to batter that were in the strike zone
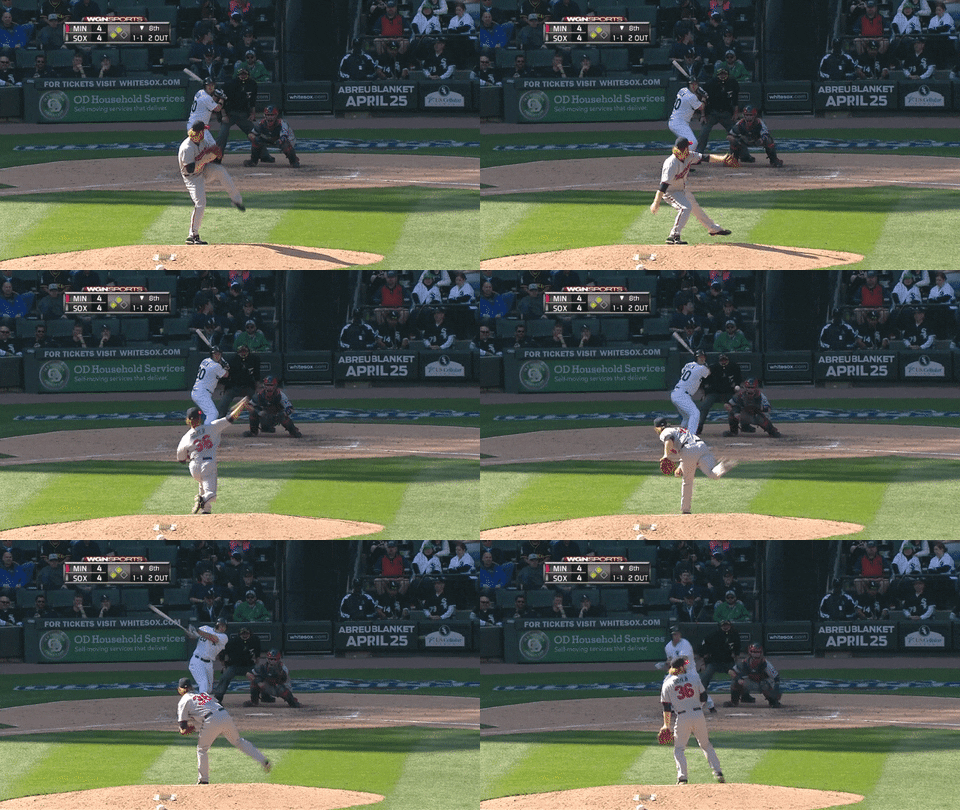
There is nothing noteworthy about his swing percentages as they are all just about equal to the league averages, but the contact percentages are quite alarming. Through his first nine games, Goeddel only made contact 53% of the time he swung his bat. Rather than just writing this off as a rookie being over-matched by big league pitching, I decided to dig deeper into these stats and figure out exactly where Goeddel was struggling. Check out the video below that I put together which basically sums up the beginning of Goeddel’s career in 30 seconds:
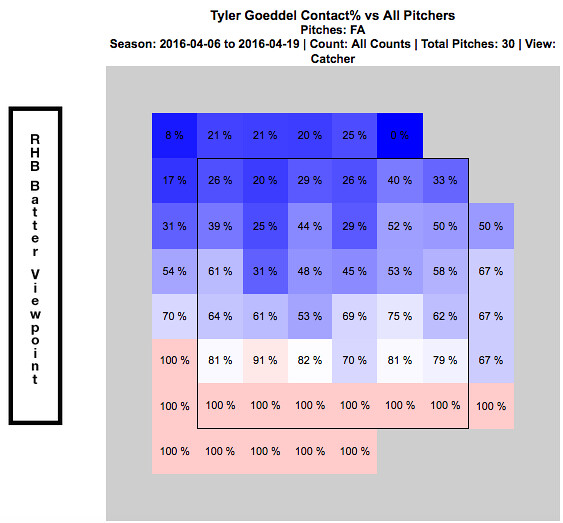
Whether or not you realized from watching the above video, every one of these swing and misses came on a fastball. They all also came in the upper portion of the strike zone. Just by watching Goeddel’s at-bats through this point of the season, it was clear as day to see opposing pitchers were attacking Goeddel with fastballs up in the zone. The chart below shows every fastball that was thrown to Goeddel over his first nine games. It is broken up by hot and cold zones and shows his contact percentage versus the fastball at every portion of the strike zone:
This chart verifies for us what we saw in the video…Goeddel really struggled to hit fastballs up in the zone to begin the season. At this point, everyone was frustrated. Tyler Goeddel was frustrated because he knew he was much more talented than his results thus far have showed. The Phillies organization was frustrated because they had such high hopes for Goeddel entering the season. And most importantly, the Phillies fans were frustrated and began questioning what the Phillies could possibly see in this guy. (Search for Tyler Goeddel’s name on Twitter and read old tweets from this time period if you don’t believe me!!)
An important thing to remember while looking at these stats, is that up until this point of his career Goeddel has been an every-day player. Not only is he adjusting to big league pitching, but he is also trying to adjust to not having consistent at-bats. Since the Phillies unexpectedly got off to such a hot start, an important decision needed to be made. On one hand, they have this young promising player who will need consistent at bats in order to show his true potential. But on the other hand, this team is surprisingly in the hunt in the NL East and may not want to allow Goeddel to go through his growing pains while they are competing for the division title. Eventually, a decision was made and manager Pete Mackanin started to put Goeddel in the every-day lineup. Below are some quotes from Goeddel at this time speaking of the decision:
“Getting regular playing time and the confidence [from that] is huge, but I try to get started a little earlier on my swing so I can be on time with the fastball. You need to hit the fastball if you want to play up here, obviously. I feel like I’ve made that adjustment and it’s been a huge help.” – Tyler Goeddel
“I didn’t play how I wanted to play in April. And I’m glad he’s (Pete Mackanin) giving me a chance, because I really didn’t play my way into a chance; he just gave it to me. So I’m trying to make the most of it.” – Tyler Goeddel
The video below (from 4/23/16) summarizes Goeddel’s early season struggles and the decision to give him more playing time:
The Phillies coaching staff deserves a lot of credit. They recognized early on that Goeddel was struggling with fastballs up in the zone and prior to this game really worked with him in that area and promised him more playing time moving forward. Here is a video of his next at bat in the game, where the pitcher tries once again to attack Goeddel with some high heat:
Goeddel responds with another base hit and his first RBI of the season. Take a look below at how his stats over his next seven games compare to his stats from his first nine games.
You can very easily see that Goeddel drastically improved his contact percentage over this time frame, which resulted in a huge drop in his strikeout rate. The video below is from 5/8/16, right after the stretch of stats we just evaluated. Goeddel had a big hit late to tie the game for the Phillies and later came in to score the winning run.
As you could see, the hit came on a high fastball. A few weeks ago, Goeddel could not touch this pitch…but all of a sudden he is beginning to prove that he can. The next video is from after that game. Tyler discusses the adjustments he has made and also how playing every day has contributed to his recent success:
This hit was the start of a new Tyler Goeddel. Pitchers continued to attack him with fastballs up in the zone and Goeddel really started to make them pay. This is what he did to a Brandon Finnegan fastball just a few days later:
Ever since that hit on May 8th against the Marlins, Goeddel has been the player the Phillies could have only hoped he one day would become. He has flashed signs of brilliance in just about every game since that have Phillies fans drooling over what the future outfield could look like. Even though he has made adjustments and is seemingly now catching up to big league fastballs, opposing pitchers continue to test him. Check out the video below that I put together showing what Goeddel has done to fastballs in the upper portion of the strike zone over the last few weeks.
As you can clearly see, this is a different player than we saw early on in the season. Take a look at how his recent stats compare to those early on:
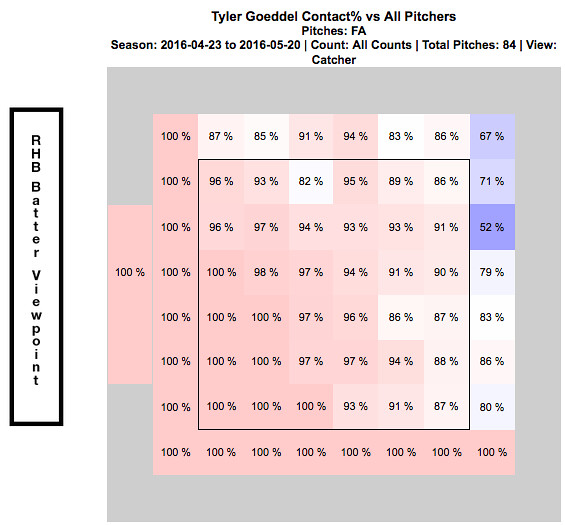
Goeddel’s contact percentage over his first nine games was only 53%. Over his last 10 games, it is 91%. That is an incredible difference and clearly his adjustments are paying off. In turn, his improved contact has led to a strikeout percentage of only 5.4% over his last 10 games. The chart below shows how Goeddel has fared against the fastball since he noted his adjustments on April 23, 2016.
Now go back up to the top of the article and compare this chart to what it looked like at the beginning of the season. More consistent at bats have clearly translated into him catching up to the fastball and the results thus far have been phenomenal. I have to admit that I was a doubter early on, but I am now completely on board the Tyler Goeddel bandwagon. This kid is only 23 years old and the fact that he was able to so quickly make an adjustment like this and immediately see results is remarkable. Now that he is having some success, opposing pitchers will start to change their game-plan against him. While the pace he is on now may not be sustainable over the course of a full season, I am confident that Goeddel will continue to make the necessary adjustments and help this Phillies team continue to find ways to win ball games. Although the video below doesn’t exactly relate to his success at the plate, I had to throw this in here and it is a must watch if you have not seen it already:
The last video I will show features Goeddel’s post game interview after this throw:
Recent Quotes:
“It’s exciting. Coming to the field everyday I’m expecting to see myself in the lineup. That’s a feeling I didn’t have last month. It’s a lot more relaxing, less stressful.” – Tyler Goeddel
“It was definitely a big adjustment, going from playing everyday my whole career to having a specific role, and then not performing well in my role, it was a little tough. But, you know, they’re giving me an opportunity now and I feel like I’m playing better, which is nice. I’m happy for myself. I always knew I could play up here, but I needed some results to prove it to myself. I’m glad, finally, there are some results to show.” – Tyler Goeddel
I love how confident Goeddel is when he speaks of his game and I am so glad the numbers back him up. I continue to be blown away watching him play every day, especially due to the fact that he has only been playing the outfield for one year.
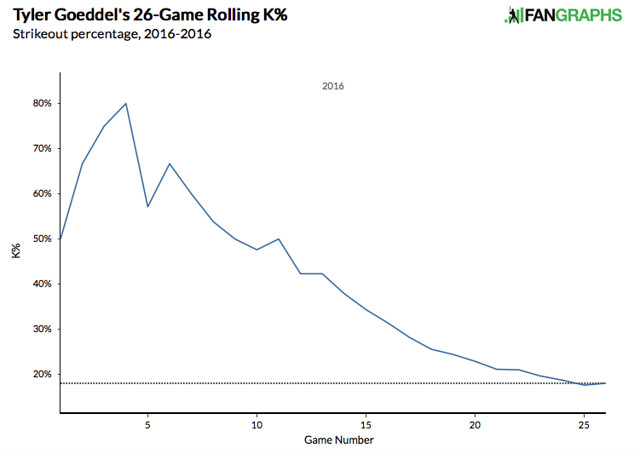
Lastly, I want to show a few graphs. The first one shows a rolling total of Goeddel’s strike out percentage so far this season. The statistics earlier show you that it has decreased, but this graph makes it much easier to see his progression:
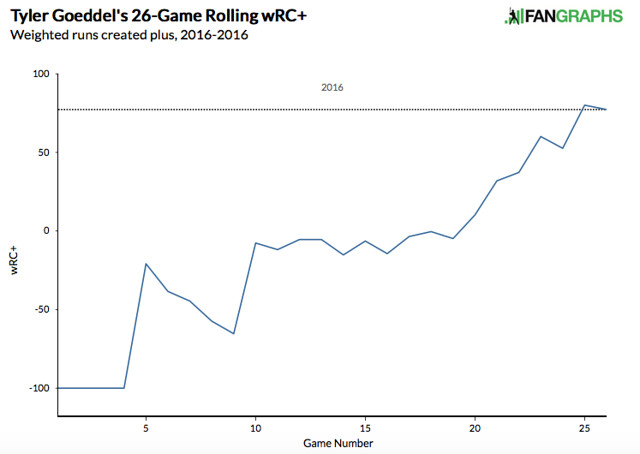
The next graph is another rolling total showing how Goeddel’s wRC+ has progressed throughout the season. For those of you who are unfamiliar with the stat, wRC+ stands for weighted runs created plus. It attempts to quantify a player’s offensive value in terms of runs. An average wRC+ is 100. Check out how Goeddel’s wRC+ has improved throughout the season:
What do you think, Phillies fans? Can Tyler Goeddel keep this up? Is the Tyler Goeddel that we have seen over the last few weeks the real Tyler Goeddel? Are you ready to hop on the bandwagon yet or do you need to see more from him to believe? Only time will tell, but I’m buying into the hype and am excited to see what the future holds for this promising young player.
Dynasty leagues are a little bit like the stock market. What makes a good owner is finding things that may go up in value; this can be players, draft picks, or even money (not all leagues allow trading money, but ours does). When you find a player that you think will go up in value you try to trade for him, pick him up, or draft him. Anyone can sign good players in the auction for a lot of money, but what sets the good teams apart is their ability to find the players that are going to go up in value, or as we say “break out.” I’m a fan of David Peralta. He has already made quite an impact for teams in 2015. Hitting .312/.371/.522 will do that. The good thing for us is that he is not being properly valued right now in fantasy baseball leagues.
Now is the time of the year for rankings. Every single site out there is coming out with their rankings getting everyone all set for their leagues. Thankfully, we have sites like FantasyPros to get us consensus rankings and average draft positions. Right now experts rank David Peralta an average of 40th among outfielders. He is being drafted on average as the 38th outfielder off the boards.
David Peralta came up as a starting pitcher with the St. Louis Cardinals. After multiple shoulder injuries he decided to bow out and head back home to Venezuela where he remade himself into an offensive player. After an impressive year in an independent league he was signed by the Diamondbacks. He quickly shot up through the system, learning fast for a player already in his mid 20s. He’s only had a year and a half in the big leagues now, but he’s still been improving. From what I understand, he is a very hard-working and upbeat player.
Numbers? How about an improved hard-hit rate, going from 30% in 2014 to 35% in 2015? A wRC+ jump from 110 to 138? A HR/FB jump from 9.6% to 17.7%? Even within 2015 he improved all three of those stats, getting up to a 38% hard-hit rate and a 162 wRC+ in the second half. That’s destroying the baseball. He’s spend most of his time batting fourth behind Goldschmidt and Pollock, so the RBI opportunities will continue.
You want to know what the most shocking thing is? He only started 116 games. The logjam in the Arizona outfield was to blame. Well guess what, Ender Inciarte is gone and Yasmany Tomas sucks. David Peralta is going to have no problem being the permanent cleanup hitter. If we just took his 2015 stats and ignored any improvement whatsoever and prorated them for a reasonable 150 games we would be looking at 79 runs, 22 home runs, 101 runs batted in, and 12 stolen bases. That’s even giving him two whole weeks off. If you bake in some improvement due to his second-half numbers it’s not very hard to see 25-30 home runs with 200 combined runs and RBI. Those numbers look a lot like what we’d expect from someone like Ryan Braun, Adam Jones, or Matt Kemp, all of whom are going in the 15-25 range.
The only website I’ve seen give Peralta his due was ESPN when Tristen Cockroft put him 25th among outfielders. So at the very least that means I am not the only one thinking this is a huge value opportunity. For dynasty leaguers, you need to go out and get him now. He’s more than likely got a nice cheap contract or he might even be available in an auction because someone didn’t think he’s worth keeping around. Listen to me, get him now and lock him up. It’s a done deal. Guess what, I’ve already done that in my league. I traded Ken Giles ($1/3) for Peralta ($4/1) and a second-round draft pick back in November, so I put my money where my mouth is. That was before Giles was in Houston and in our league contracts can be doubled up each additional year so I traded away about seven years of a top-10 closer for three or four years of Peralta and a second-round pick (for the minor-league draft). But enough about me, don’t worry about my deal. Go and get him. Rarely are breakouts this easy to predict.
2015 was the year of Bryce Harper. He led qualified hitters with a 197 wRC+, the highest since the turn of the century among players not named Barry Bonds. This was a vast improvement on his already-impressive 2014 season, in which he totaled a 115 wRC+.
Depending on how you look at things, you could say Bryce Harper was the most improved batter in 2015. I choose not to for two reasons: 1) it’s too easy, and 2) it makes this article more fun. There’s also another more objective reason: with only 395 plate appearances in 2014, Harper didn’t qualify for the batting title.
This poses a question: what minimum do we set to determine who improved the most between 2014 and 2015? If we say that the player needed to qualify for the batting title each year, we get Chris Davis as the most improved batter, who increased his wRC+ from 94 in 2014 to 147 in 2015. If we set no minimum, our wonder-boy is none other than notorious slugger Carlos Torres, the Mets pitcher who upped his wRC+ from -100 to 491.
Clearly, there needs to be some minimum. For the purpose of the article, I’ve decided to set it at 100 PA. This seems a reasonably small enough number to include a wide array of players, but large enough to get rid of anomalies (I’m looking at you Carlos). When we set this minimum, we discover that the batter whose wRC+ increased the most between 2014 and 2015 is… Ryan Raburn. However, since Jeff Sullivan already talked about Raburn, I decided to go with the next name on the list: J.B. Shuck.
If you don’t know who that is, I don’t blame you. I didn’t until I started this research. If you do know him, I’m going to guess that you’re either a White Sox, Indians, or Angels fan. Either that, or you have more time to watch baseball than a college student taking a full course-load of credits. Who’s to say?
The reason the casual fan might not know Shuck is because, well, he’s not exactly a star player. Here are the players with the lowest wRC+ in 2014 of those with at least 100 PAs:
That’s right, he was literally the worst batter that year. Almost as bad as if I were to join the majors. It should be no surprise, then, that he was able to improve so much — he had the lowest starting point. Even so, he still had needed to improve quite drastically in order to surpass Harper’s wRC+ improvement. And that’s exactly what he did:
In 2015, Shuck improved so much that he almost managed to be an average player. But how did he manage to do it? Was it a matter of luck, or did he actually get better?
The number that stands out the most in Shuck’s 2014 season is his .146 BABIP (batting average on balls in play). For those of you that don’t know, that number is quite bad. Like, less than half of what it should be. His BABIP in other seasons is right around league average, so something must have gone amiss last year. Looking at the underlying numbers, some things showed up:
So. His FB% and Pull% numbers were way up as compared to other years. For some context, the league-average FB% has been approximately 34% the past two years, while Pull% has been approximately 40%. These numbers suggest that Shuck spent too much time trying to pull the ball over the fence two years ago, and the video suggests the same thing. Here’s an example of him trying to do just this to a pitch on the outside corner, but instead weakly grounding to first. You can see how he opens his hips before he even starts his swing, forcing him to simply slap at the ball if he wants to make any contact:
And here he is in 2015, driving a similar pitch into left field:
The cause of his change in approach is hard to say. He did get a new hitting coach to start off the year, switching from Jim Eppard to Don Baylor. From 2013 to 2014, the Angels as a team increased their FB% from 33% to 34% and their Pull% from 37% to 42%, so that argument does have some merit. Regardless of the reason, it’s clear that it had an effect. Here’s Shuck’s ISO by zone:
As can be seen on the left, Shuck had trouble hitting anything not on the inside edge of the plate in 2014. This past year, he learned to control more of the strike zone, and even though there’s less red than there was in 2014, there’s also a lot less dark blue. Shuck drove the ball from all parts of the zone to all parts of the field, and his numbers improved because of it.
While Shuck may not be an All-Star anytime soon, his year-to-year improvement is truly remarkable. If he can go from being the worst hitter in baseball to an average one, anyone can. And if that doesn’t inspire the Brendan Ryans of the world, I don’t know what will.
2nd Base hasn’t been a particularly stacked position in the major leagues in the past five years. Entering the 2015 season, the 2nd base position was headlined by Jose Altuve and Robinson Cano. The second tier arguably consisted of Ben Zobrist, Neil Walker, Dustin Pedroia, and Ian Kinsler, and maybe Brian Dozier. Then the next level housed names like Jason Kipnis, Daniel Murphy, and maybe DJ LeMahieu. I’m here to analyze what has possibly happened to this group of baseball players in the past few months.
According to the Depth Charts pre-season projections, the top eight second basemen ranked by wOBA were Robinson Cano, Neil Walker, Ben Zobrist, Jose Altuve, Dustin Pedroia, Ian Kinsler, Howie Kendrick, and Chase Utley. The projections are usually somewhat accurate, but if you’ve been following baseball at all this season, just by looking at those names, you know that we’ve found an exception to that.
These are the top 10 second baseman thus far in the 2015 season ranked by wOBA:
Name
Team
G
PA
HR
BB%
K%
ISO
BABIP
wOBA
wRC+
Jason Kipnis
Indians
69
322
5
10%
13%
0.17
0.396
0.409
169
Brian Dozier
Twins
70
310
14
9%
19%
0.257
0.276
0.363
133
Logan Forsythe
Rays
72
284
8
9%
15%
0.161
0.325
0.363
139
Joe Panik
Giants
69
296
6
9%
12%
0.156
0.326
0.362
137
Dustin Pedroia
Red Sox
68
311
9
9%
12%
0.147
0.325
0.358
127
Dee Gordon
Marlins
68
311
0
3%
15%
0.071
0.418
0.347
120
Danny Espinosa
Nationals
62
229
8
9%
22%
0.187
0.317
0.345
118
DJ LeMahieu
Rockies
68
274
4
7%
16%
0.103
0.373
0.344
102
Kolten Wong
Cardinals
69
284
8
7%
14%
0.163
0.3
0.336
114
Jace Peterson
Braves
66
270
2
11%
17%
0.103
0.337
0.327
107
If I told you in April that Logan Forsythe would be the 3rd best second baseman in the league, you would think I’m ridiculous. He came absolutely out of nowhere to raise his BABIP nearly 60 points and raise his ISO 55 points! Joe Panik’s beautiful swing has moved him up to be the 4th best-hitting 2nd baseman. Jason Kipnis has shut up all the critics. He took his .310 2014 OBP as confidence going into this year, and now has a wOBA over .400. Danny Espinosa, who has been previously known as a ‘defensive’ second baseman, has skyrocketed his offensive production into a player who Matt Williams is comfortable having run onto the field every day. Cardinals 2B Kolten Wong is pulling the ball more and more every season. He’s also upped his LD% from 19% to 25%. Braves utility-infielder Jace Peterson is doing a bit of hitting in his rookie year, after being traded from San Diego (who, it turns out, could really use him) to the Braves in December. Think back to when I mentioned the tiers up top. Where is Robby Cano on the list above? Where’s Altuve? I don’t see Zobrist, Walker, or Kinsler on this list either. It is not an error.
So we talked about the breakouts at 2nd; now lets talk about the guys who haven’t or haven’t yet lived up to expectations.
Lets start with the guy who all of his fantasy owners hate this year. Robinson Cano. Yeah, the six-time All-Star Robinson Cano. The 32-year-old — the guy who has a wRC+ of 76. This is easily, by far, his worst season of his 11-year career. Why? Lets talk about it.
Cano has raised his Hard% and his Pull% over 4% each! What does jump out at you is that he’s making a ton less contact than he did last year. Actually, the least of his whole career. His Contact% has plummeted down almost 5%. Along with a raised K%, his BABIP has jumped down nearly 50 points.
The next guy is Altuve. Altuve hasn’t been that bad this year, but compared to his 2014 campaign, he’s not playing like Jose Altuve. He’s even fighting with a mild hamstring injury, but in his 287 PA’s, every single one of his numbers are down. His wOBA has decreased .363 to .304. BB% is down, strikeouts are up, OBP and SLG are both way down. He’s swinging more, and making less contact which isn’t a combination that pulls you in a positive direction.
Same can be said for Neil Walker. Almost all his numbers are down. One of the positives that I found, though, is that he’s hitting the ball harder. My prediction is that the .303 wOBA will start to show positive regression. Ian Kinsler isn’t having a horrible season. He’s raised his OBP a bit, but he’s becoming more of a singles hitter, dropping his SLG from .420 to .338.
Almost every starting second baseman in the big leagues has totally changed their style of hitting this year. Guys like Forsythe and Panik, who were projected to be replacement level or below, have made their names rise to the top of many leaderboards. Cano and Altuve’s value have fallen. Here’s your homework: Think of all the 2nd baseman in the major leagues. How many of them have close to similar stats from their projections? Comment down below.
The Oakland Athletics may have finally completed their roster turnover on Wednesday with their most recent deal sending Yunel Escobar to Washington for RP Tyler Clippard. However, you can never know if Billy Beane is finished making moves. With that being said, I’d like to break down the roster from last year to this year and assess whether or not the team will actually regress in 2015. The fact is that the Athletics got quite a bit younger this offseason and acquired many players with a lot of team control remaining. The distant future appears brighter now than it did prior to this offseason, but the main question is, will the Athletics be able to compete in 2015 as well as they would have prior to the roster turnover? Lets take a look at the numbers:
STARTING LINEUP
I will start by comparing the most common nine players in the A’s lineup last year to their projected starting nine this year, using WAR and wRC+:
[All stats give on the chart will represent the 2014 season in the MLB only. In further commentary I may bring up career numbers or minor league numbers for some players.]
2014
WAR
wRC+
2015
WAR
wRC+
C – Derek Norris
2.5
122
C – Stephen Vogt
1.3
114
1B – Brandon Moss
2.3
121
1B – Ike Davis
0.3
108
2B – Eric Sogard
0.3
67
2B – Ben Zobrist
5.7
119
3B – Josh Donaldson
6.4
129
3B – Brett Lawrie
1.7
101
SS – Jed Lowrie
1.8
93
SS – Marcus Semien
0.6
88
LF – Yoenis Cespedes
3.4
109
LF – Sam Fuld
2.8
90
CF – Coco Crisp
0.9
103
CF – Coco Crisp
0.9
103
RF – Josh Reddick
2.3
117
RF – Josh Reddick
2.3
117
DH – Alberto Callaspo
-1.1
68
DH – Billy Butler
-0.3
97
2014 AVG WAR = 2.1 / Total wRC+ = 929
2015 AVG WAR = 1.7 / Total wRC+ = 937
As shocking as it may seem, this displays that the A’s should in fact score more runs with their lineup in 2015 than they did with Donaldson, Moss and Cespedes in the heart of their lineup last season. Although, this chart only accounts for 2014 stats, in which Billy Butler (among others) had an off year. If the A’s can get him back to, or even near his 2012 form, in which his WAR was 2.9 and his wRC+ was 139, they could be in for a significant upgrade on offense as a whole. One of the reasons why this lineup has the potential to be more successful even after losing a guy like Donaldson is because of the acquisition of Ben Zobrist. While Brett Lawrie is -4.7 to Donaldson in WAR and -28 to Donaldson in wRC+, Zobrist is +5.4 to Sogard in WAR and +52 to Sogard in wRC+, more than making up for the loss of Donaldson. While the A’s did use a lot of other DH besides Callaspo in 2014, he totaled the greatest amount of plate appearances from that spot, which might lower the 2014 numbers a little.
The average WAR is down slightly from last season, but with Stephen Vogt behind the plate and Marcus Semien most likely getting the every day job at SS, the A’s feel they are upgrading defensively. Semien’s numbers represent his slim 255 plate appearances in the majors last season, but in TripleA his wRC+ was 142. You cannot expect that out of Semien at the major league level, but it shows that he has potential to improve in 2015. The A’s did use a lot of players at each position last season and they will again in 2015; that is why it is important to also take a look at the bench players from last year and the projected bench for this year.
BENCH
While the 25-man roster is not set in stone for 2015 just yet, here is last year’s most commonly used bench players versus next year’s projected bench.
2014
WAR
wRC+
2015
WAR
wRC+
Nick Punto
0.2
73
Craig Gentry
1.4
77
Craig Gentry
1.4
77
Josh Phegley
0.2
92 – 132(AAA)
John Jaso
1.5
121
Eric Sogard
0.3
67
Sam Fuld
1.3
73
Mark Canha
N/A
131(AAA)
2014 AVG WAR = 1.1 / TOTAL wRC+ = 344
2015 AVG WAR = .48 / TOTAL wRC+ = 367(407)
While these numbers are a bit skewed due to the fact that Canha has not yet reached the majors and also because Jaso was actually a starter while he was healthy, they do give a good idea of what to expect in 2015. Sogard takes over for Punto as the reserve infielder. Fuld and Gentry will most likely platoon in LF, same goes for Vogt and Phegley at C. Since Fuld and Vogt are LH, they will see more time in the starting lineup, leaving Gentry and Phegley on the list of bench players for 2015. Gentry and Phegley will see most their time against lefties, which will likely help their overall numbers. The A’s always do a great job shifting their lineup to create the match ups they want, expect more of the same with platoons and late pinch hitting in 2015.
STARTING ROTATION
The starting rotation is an area where a lot of people say they A’s have question marks. This may be due to the fact that they lost Jon Lester and Jason Hammel to free agency and traded away Jeff Samardzija to the White Sox earlier this off season. However, the A’s held the best record in baseball for months in 2014 with a rotation featuring Sonny Gray, Scott Kazmir, Jesse Chavez, Drew Pomeranz and Tommy Milone. Four of those guys will be returning in 2015, with a slew of other young arms fighting for a spot in the rotation. Anyone from Chris Bassitt, Jesse Hahn, Sean Nolin or Kendall Graveman would be an upgrade or at worst an equal replacement of Milone. Let’s take a look at the numbers for the five players who started the most games for the Athletics last season VS the A’s projected rotation for next season using ERA, WHIP and WAR from the 2014 season:
2014
ERA
WHIP
WAR
2015
ERA
WHIP
WAR
Sonny Gray
3.08
1.19
3.3
Sonny Gray
3.08
1.19
3.3
Scott Kazmir
3.55
1.16
3.3
Scott Kazmir
3.55
1.16
3.3
Jesse Chavez
3.44
1.30
1.7
Jesse Hahn
2.96
1.13
0.8
Jeff Samardzija
2.99
1.07
4.1
Jesse Chavez
3.44
1.30
1.7
Tommy Milone
4.23
1.40
0.4
Drew Pomeranz
2.58
1.13
0.7
2014 AVG: ERA = 3.46 / WHIP = 1.22 / Avg WAR = 2.56
2015 AVG: ERA = 3.12 / WHIP = 1.18 / WAR = 1.96
Keep in mind that ERA and WHIP are better when they are lower and WAR is better if it is higher. While this list does not consist of Jon Lester, the A’s were at their best when they still had Chavez and Milone in their rotation. Also, it was a small sample size for Pomeranz, so we cannot expect numbers quite that solid again in 2015. However, with all that being said, the A’s, despite losing All-Stars, should not take more than a tiny step back in 2015. This rotation is still very solid and is in fact younger this year than last. Not only that, the A’s now have a lot more depth with three other pitchers not on this list that could fill a rotation spot, Chris Bassit, Sean Nolin and Kendall Graveman. Also, we cannot forget about the Tommy John rehabbers Jarrod Parker and AJ Griffin, who could make their way back into this rotation before the All-Star break. Both Parker and Griffin were huge contributors to the A’s success in both 2012 and 2013.
BULLPEN
There are a lot of similar faces coming back to the Athletics’ bullpen in 2015. So, instead of continuing with the format I’ve used for position players and the starting rotation I’m quickly going to compare Luke Gregerson and Tyler Clippard, the one main difference in the bullpen for 2015.
Player ERA / WHIP / WAR
Luke Gregerson 2.12 / 1.01 / 0.9
Tyler Clippard 2.18 / 1.00 / 1.5
These numbers are very similar, making Clippard a perfect replacement for Gregerson, taking over the 8th inning duties in front of incumbent closer Sean Doolittle. I don’t think many people expected the A’s to make a move to acquire another back end of the bullpen piece. Even after losing Gregerson, they seemed to have a very solid bullpen, but now it is even more solidified with a proven set-up man in Tyler Clippard. Another important thing to note about Clippard is his ability to create fly balls. His FB% in 2014 was 49.4% also, his IFFB% was 19.3% and that will likely increase mightily with him now pitching in Oakland. He is the perfect pitcher for the o.Co Coliseum. The A’s will pay Clippard more than they would have paid Escobar in 2015, but they are saving money in the long run due to the fact the Escobar is owed 14 million over the next two seasons and Clippard becomes a free agent after this season (in which he will make around 9 million).
Now let’s take a look at 12 potential options for the Athletics bullpen in 2015. Some of them are locks, but the others will either gain a spot due to the fact that they did not make it into the rotation or if they have a solid showing in spring training.
Name
Team (2014)
IP
ERA
WHIP
WAR
Sean Doolittle
Athletics
62.2
2.73
0.73
2.4
Tyler Clippard
Nationals
70.1
2.18
1
1.5
Dan Otero
Athletics
86.2
2.28
1.1
0.7
Chris Bassitt
White Sox
29.2
3.94
1.58
0.7
Fernando Abad
Athletics
57.1
1.57
0.85
0.6
Ryan Cook
Athletics
50
3.42
1.08
0.3
Eury De la Rosa
Diamondbacks
36.2
2.95
1.39
0.2
R.J. Alvarez
Padres
8
1.13
1
0
Kendall Graveman
Blue Jays (AAA)
38.1
1.88
1.02
N/A
Sean Nolin
Blue Jays (AAA)
87.1
3.5
1.25
N/A
Eric O’Flaherty
Athletics
20
2.25
0.95
-0.1
Evan Scribner
Athletics
11.2
4.63
0.94
-0.2
There are a lot of very solid options for the A’s bullpen in 2015. I’d expect to see, Doolittle, Clippard, O’Flaherty, Cook, Otero and Abad for sure, but I expect all of these guys to make an impact at some point, if not this season then in 2016.
TAKEAWAY
The Athletics have a very deep pitching staff. With Sonny Gray and Scott Kazmir headlining the rotation, they have a plethora of options to fill the remaining three spots. Pomeranz, Hahn and Chavez look to be the leading candidates, although Billy Beane himself has mentioned Kendall Graveman as someone he sees making the rotation out of spring training. The A’s also have a very strong bullpen, especially after the recent acquisition of All-Star set-up man Tyler Clippard. After losing Josh Donaldson, Brandon Moss, Yoenis Cespedes and Derek Norris (four All-Stars), the A’s lineup for 2015, according to wRC+ actually got better. It’s not always the big name All-Stars that make a team successful. Oakland has proven this many times in the past, most recently in 2012, right after an offseason makeover similar to this year’s. The one piece that has remained since before the 2012 makeover and after this 2015 makeover, is Coco Crisp. There cannot be enough said about the value of Crisp to the A’s organization. With Crisp healthy in CF and the newly acquired pieces filling in around him, I expect the A’s to be back competing for another American League West division title in 2015.
This article is a follow-up to my previous one in which I will work through some examples. You should try to get an intuition on it. If the concept seems too complicated I have to apologize for not explaining myself well because I sincerely think this is very straightforward and no voodoo and could help improve fWAR even further… which is mindboggling if you think about it. It could improve projection systems as well as the correlation of WAR and actual wins while also handling players changing from the AL to the NL or vice versa more elegantly.
I will simply follow my steps 1-4 from my previous article to figure out the proper league adjustment and continue with some WAR calculations. I will use the 2014 season as my guinea pig.
While playing around with it I also stumbled upon a wRC+ adjustment that has to be done because of a) the independence of both leagues and b) the differing league strengths. I will tackle this issue in my next article.
All right, here are steps 1) –4).
1) I need to figure out the wOBA values, R/PA, FIP, R/W, cFIP for each league individually. These can normally be found here. I will not list every single wOBA value here because that doesn’t add much to the explanation and saves me some time.
AL (2014):
wOBA: .312
R/PA: .110
FIP: 3.82
R/W: 9.25
cFIP: 3.16
NL (2014):
wOBA: .308
R/PA: .105
FIP: 3.66
R/W: 8.97
cFIP: 3.10
The exact values for all of MLB found on the Guts! page is conveniently exactly the arithmetic mean of my AL and NL values.
2) All right, we now move on to step 2 which is to figure out the interleague record. I suggested that a 3 year rolling regressed average could be a possibility with years N-1, N and N+1 as inputs. I cannot see into the future, for that reason I will simply use the 2012-2014 interleague record based on pythagenpat. This comes out to a .539 W% for the AL. Conveniently, the actual W% is exactly the same. For demonstration purposes let’s just do a farmer’s regression and call that a “true talent” .530 W%.
3) This is the seemingly tricky part but once you got your head around it is is very easy to grasp. As a reminder: the three necessary “true” replacement levels needed for all WAR calculations are .294 in general for teams – this is where the fixed 1,000 WAR each year comes from – the .380 replacement level for starting pitchers and the .470 for relievers.
Imagine an NL team that is a .500 team within the NL. This team plays a .500 AL team within the AL. That needs to be stressed. Those teams are NOT of equal strength, even if both have a .500 record. Why, you ask? Because if they were, we would not see an advantage for the AL in interleague play. We would see a balanced .500 interleague record. That is not our reality and we can confidently conclude that the NL is the weaker league as of today.
Following this line of thought, what happens if two replacement teams out of each league play each other? Well, this means a .294 NL team plays a .294 AL team. What would the outcome be? A .530 winning percentage in favor of the AL. This comes straight out of the interleague record.
How much better than a .294 W% would this NL team have to be in order to win exactly half of its games against this .294 AL team? This is where the odds ratio comes into play and it spits out a .320 winning percentage. That means if a .320 NL team faces a .294 AL team in an environment, in which the AL wins 53% of all interleague games, we would finally expect parity. A .500 interleague record. This .320 is our new “artificial” replacement level for the NL in 2014.
On the other hand we have to ask the question: How much worse than a .294 can an AL team be when facing a .294 NL team and still win half of its games? Odds ratio says a .270 AL team would still win 50% of all games against a .294 NL team in a context where the AL wins 53% of all interleague games. This .270 is our new “artificial” replacement level for the AL in 2014.
4) Remember that our “regressed” interleague record suggests the AL to be the stronger league, thus worthy of receiving more share of the WAR-pie. Now it is time to figure out how much more they deserve.
We figured out a .270 “artificial” replacement level for the AL. Therefore, we can distribute (.500-.270)*15*162 = 559 WAR towards the AL. This is split up 57/43 between position players and pitchers.
In the National League we found a .320 “artificial” replacement level. Therefore, we can distribute (.500-.320)*15*162 = 437 WAR towards the NL. Same 57/43 split.
Now 559+437 = 996, which is not equal to 1,000. This is because of the odds ratio being non-linear the closer it gets to the extremes but I might be totally mistaken here. This usually is where Tangotiger appears out of the dark and helps out with fancy math or steps in when the math gets hurt. I don’t really see it as a problem.
We could either distribute the remaining 4 WAR 50/50 between both leagues or adjust the replacement levels slightly to arrive at exactly 1,000 WAR. Both would change individual WAR figures only on an atomic level.
I want to point out that this kind of inconsistency is very common in the implementations of WAR. rWAR and fWAR both have some adjustment runs to match inconsistencies like that. This doesn’t even make a difference on a player level. It would not even change a team’s WAR figure by 1/10 I guess.
WAR calculations
After you have come this far you are probably interested in how much certain player’s WAR figure might change. Again, I won’t list every step necessary but only the actual results. If you ask yourself how I have done it, you should take a look here, here and here. If that doesn’t help out, just comment with your question and I will walk you through.
My example will be Mike Trout. I will show the differences of some of the more important and interesting stats as (OLD/NEW). Forgive me for not being a formatting wizard.
NOTE: For sake of better comparison I will present the “new” run values with an exchange rate of 9.117 R/W (currently used). Otherwise 1 run wouldn’t have the same meaning since in my WAR calculations 1 win equals 9.25 runs.( See step 1 ) This makes this an apples to apples comparison.
Trout:
wOBA: (.403 /.402)
wRC+* : (167 / 170)
WAR**: (7.8 / 8.0)
batting: (52.1 / 54.0)
UBR: (3.0 / 3.0) unchanged
wSB: (1.8 / 1.7)
Fld: (-9.8 / -9.8) unchanged
Pos: (1.4 / 1.4) unchanged
Lg: (2.9 / 2.9)
Rep***: (19.9 / 19.9 )
* I use a slightly different wRC+ calculation here. My league adjustment method would also improve the accuracy of wRC+ as a comparison tool between the two leagues. I will write another article dealing with the modified wRC+ calculation, as well as the wRAA and replacement runs modifications to improve the accuracy of fWAR.
** Fielding runs, UBR and positional adjustment were not changed. These three will never change, the league adjustment however will undoubtedly change, as well as wSB, although the changes would be tiny. It involves complete league stats, i.e. every single player’s stats.
*** The value of replacement runs will never be affected in my league adjustments even though I use different replacement levels for my calculations. Replacement runs will always be based on the .294 baseline. I hope this makes sense to you. If not I point out to the upcoming article of mine.
Outlook
In my next article I will lay out the modifications that have to be applied to wRAA, wRC+, batting runs and the replacement runs. I will show why my modifications make wRC+ more accurate in comparing both leagues and explain why this new league adjustment influences position player WAR more than pitcher WAR. Because right now, the fWAR-process for pitchers leans heavily, not entirely though, towards the independency treatment of both leagues – a cornerstone of my league adjustments.
Also look forward to a table of the players with the biggest and the smallest increase in WAR and the corresponding losses. In both the AL and NL there are players who gain or lose more than others. This has to do with the different run environments is my best educated guess so far. In the NL – the lower scoring league – extra-base hits become slightly more valuable. So does base-stealing. Opposite for the AL. So look forward to my next piece, fellows!