Archive for wOBA

RE+: Factoring Player & Team Hitting Ability Into Run Expectancy and the True Value of a Stolen Base

There are 24 different “states” in baseball. The three bases can be filled in eight different ways, and there can be 0, 1, or 2 outs at any given moment. Each of these 24 base-out states has an expected run value associated with them. Each value represents the average number of runs that the team is expected to score by the end of the inning. These values change each season depending on the run environment, but they generally don’t vary much.

2019 Average Run Expectancy by State
STATE 0 outs 1 out 2 outs
000 0.53 0.29 0.11
100 0.94 0.56 0.24
010 1.17 0.72 0.33
001 1.43 1.00 0.38
110 1.55 1.00 0.46
101 1.80 1.23 0.54
011 2.04 1.42 0.60
111 2.32 1.63 0.77

Consider the following situation: Lorenzo Cain is on first base with two outs. Now consider two possible hitters, one being Christian Yelich and the other being Ryan Braun. According to the 2019 averages, the run expectancy in this base-out state was 0.24, regardless of the hitter. While both players had impressive seasons, Yelich is unquestionably the superior player at this point in time.

2019 Player Comparison
Player wOBA ISO
Ryan Braun .354 .220
Christian Yelich .442 .342

As a result of their differences, the run expectancy should be higher when Yelich is at the plate. Consequently, the benefit Milwaukee gets from Cain attempting to steal second base should be adjusted as well. Why is this the case? Given Braun’s inferior power and hitting ability, there is more to gain from Cain putting himself in scoring position, but more importantly, there is less to lose if he were to get caught. On the other hand, Yelich is much more likely to drive the ball. With Yelich at the plate, the increase in run expectancy from a stolen base is slightly smaller than if Braun were hitting. However, the decrease in run expectancy from being caught is significantly greater. This is why we need RE+. Read the rest of this entry »


Introducing XRA: The New Results-Independent Pitching Stat

There are a multitude of ways that we can judge pitchers. Most people look at earned run average to gauge whether a pitcher has been successful, while many old school announcers will still cite a pitcher’s win-loss record. ERA is a nice, easy way of looking at how a pitcher has performed at limiting runs, but it doesn’t come close to telling the whole story. In the early 2000s, Voros McCracken created the idea of Defense Independent Pitching Stats or DIPS, which credited the pitcher only with what he could actually control. Fielding Independent Pitching was born from this theory and only took into account a pitcher’s strikeouts, walks and home runs allowed. It turns out that a pitcher’s home run rate is not terribly consistent, thus xFIP was created by Dave Studeman to normalize the home run aspect of the FIP equation by using the league home run per fly ball rate and the pitcher’s fly ball rate.

In 2015, a new metric was developed by Jonathan Judge, Harry Pavlidis and Dan Turkenkopf called Deserved Run Average or DRA. This new stat attempts to take into account every aspect that the pitcher has control over and control for everything that he does not, thus crediting the pitcher only for the runs that he actually deserves. DRA, however, is still dependent on the result of each batted ball. If the batter hits a ball deep in the gap and it rolls to the wall, the pitcher is charged with a double, but if the center fielder lays out and makes a remarkable catch, the pitcher is credited with an out. When evaluating pitchers, why should it matter whether they have a Gold Glove caliber defender behind them or not? It shouldn’t, and that’s where Expected Run Average comes in.

Expected Run Average or XRA gives pitchers credit for what they actually can control. FIP attempts to do this as well but assumes that pitchers have no control over batted balls. While the pitcher does not control how the fielders interact with the live ball, he does have an impact on the type of contact that he allows. XRA is based on a modified DIPS theory that the pitcher controls three things: whether he strikes the batter out, whether he walks the batter and the exit velocity, launch angle combination off the bat. After the ball leaves the batter’s bat, the play is out of the pitcher’s hands and should no longer have any effect on his statistics. The goal is to figure out a way to measure, independently of the defense and park, how each pitcher performs on balls in play. Since 2015, StatCast has tracked the exit velocity and launch angle of every batted ball in the majors. Each batted ball has a hit probability based on the velocity off of the bat and its trajectory. The probability for extra bases can also be determined. These batted ball probabilities have been linearly weighted for each event including strikeouts and walks to give each player’s xwOBA, which can be found on Baseball Savant. This is the perfect way to look specifically at how well a pitcher has performed on a per plate appearance basis.

Once xwOBA is found, then XRA can be calculated. The first objective is to find the pitcher’s weighted runs below average. To do this, I used the weighted runs above average formula from FanGraphs except I made it negative since fewer runs are better for pitchers.

wRBA = – ((xwOBA – League wOBA) / wOBA Scale) * TBF

For example, Max Scherzer has had a .228 xwOBA so far this season and has faced 487 batters. After finding the league wOBA and wOBA scale numbers at FanGraphs I can plug these numbers into the formula.

– ((.228 – .321) / 1.185) * 487 = 38.22

Max Scherzer has been 38.22 runs better than average so far this season, but now I need to figure out what the average pitcher would do while facing the same number of batters. To find this I need the league runs per plate appearance rate and multiply that number by the number of batters that Scherzer has faced.

League R/PA * TBF = Average Pitcher Runs
.122 * 487 = 59.41

So a league average pitcher would have been expected to surrender 59.41 runs facing the number of batters that Scherzer has so far this season. Now that we know how the average pitcher should have performed we can find the expected number of runs that Scherzer should have surrendered so far this season by subtracting his wRBA of 38.22 from the average pitcher’s runs.

Average Pitcher Runs – Weighted Runs Below Average = Expected Runs
59.41 – 38.22 = 21.19

Based on Scherzer’s xwOBA, he should have only given up 21.19 to this point in the season. If this sounds incredible it’s because this is the lowest mark of any starting pitcher though the first half of the season. Finally, XRA is found by using the RA/9 formula by multiplying the expected number of runs allowed by 9 and then dividing by innings pitched.

(9 * Expected Runs) / Innings Pitched = XRA
(9 * 21.19) / 128.33 = 1.49

Max Scherzer’s XRA of 1.49 is easily the lowest of any starter through the first half. The second best starter has been Chris Sale who has a 2.15 XRA. Of course these names are not surprising as they each started the All Star Game and are both currently the front runners for their leagues’ respective cy young award.

Here is a list of the top ten qualified pitchers:

Pitcher XRA
Max Scherzer 1.49
Chris Sale 2.15
Zack Greinke 2.26
Corey Kluber 2.33
Clayton Kershaw 2.34
Dan Straily 2.87
Lance McCullers 2.89
Chase Anderson 3.11
Luis Severino 3.17
Jeff Samardzija 3.23

And the bottom ten:

Pitcher XRA
Matt Moore 6.58
Kevin Gausman 6.47
Derek Holland 6.32
Matt Cain 6.26
Ricky Nolasco 6.26
Wade Miley 6.17
Johnny Cueto 6.10
Martin Perez 5.97
Jason Hammel 5.95
Jesse Chavez 5.84

Full First Half XRA List

It is interesting to see that three members of the Giants rotation rank in the bottom seven in all of baseball. In fact, AT&T Park is such a pitcher-friendly park that once you park adjust these numbers, Moore, Cain and Cueto become the three worst pitchers in baseball. It’s not surprising then why the Giants are having such a disappointing season.

One measure of a good stat is whether or not it matches your perception. Therefore, while it is interesting to see Dan Straily as one of the best pitchers in baseball and Johnny Cueto as one of the worst, it is much more assuring to see Max Scherzer, Chris Sale and Clayton Kershaw as some of the very best in the sport. The numbers for relievers also reveal how dominant Kenley Jansen and Craig Kimbrel have been. This is all good evidence that XRA is doing what it is supposed to do, accurately displaying how good pitchers have actually been, independent of all other factors.

Another important characteristic of a good stat is how well it correlates from year to year. While ERA is the most simple and popular way to look at pitchers, it is not very consistent. XRA is much more consistent than ERA and FIP and also compares favorably with xFIP. However, it is not as consistent as DRA. DRA controls for so many aspects of the game that it should be expected to be the most consistent. However, being the most predictive or most consistent stat is not necessarily the goal of XRA. The real goal is to show how well the pitcher actually did, and XRA seems to do this remarkably. While not being as consistent as a stat like DRA, the level of consistency is extremely encouraging and puts it right in line with the other run estimators.

XRA is a stat that takes luck, defense, and ballpark dimensions out of the equation. When evaluating a pitcher, he shouldn’t be penalized for giving up a 350-foot pop fly for a home run in Cincinnati while being rewarded for that same pop fly being caught for an easy out in Miami. With XRA, no longer will people have to quibble about BABIP, since it is results-independent and removes all luck from consideration. A ground ball with eyes will now be treated the same whether it squirts through for a single or is tracked down for an out. Pitching ability will no longer need to be measured with an eye on the level of the defense. It takes a good offense, a good pitching staff and a good defense to make a great team, and with XRA we can finally separate all of these important factions.


How to Make Yourself Interesting

Allow me to start this post off with a couple of charts without any context about the player we are talking about.


Let’s talk about this player for a second. His name is not of consequence, yet. This player has fluctuated from being an above-average producer of runs and slightly-below-average producer of runs for close to 10 years now. This means he’s been around a long time, so his profile as a hitter is solidified; he has a reputation. Something funny has happened in 2016 and 2017 as evidenced by the LARGE upward line. That’s good! Can you guess who this player is? No? Come on, one guess. Okay, fine. It’s Mark Reynolds! Yes, that Mark Reynolds!

Mark Reynolds once hit 44 home runs. Do you remember that? When I said, he had a reputation, I meant to say that he’s well-known for the three true outcomes: walks, strikeouts, and home runs. Not much else. He’s a first baseman, which means his defensive value is minimal at best. So basically, his value is his offense. He’s signed for $1.5 million this year and is currently a top-10 first baseman in the MLB by fWAR. He’s top-8 by wRC+, and top-4 by wOBA. He’s already exceeded the value of his contract. The obvious caveat here: it’s May 9th. The other obvious caveat is he plays for the Rockies now, which means he gets to play 81 games (give or take) at Coors Field.

I don’t know if he can sustain this. I too see the name Mark Reynolds and think, 30% K rate, with a decent amount of power. The thing is, he’s not striking out in 30% of his plate appearances. He’s not even striking out in 25% of his plate appearances. You want to know how often he’s striking out? After today’s day game with the Cubs, he’s striking out only 21.1% of the time. That’s, dare I say, below league average (League wide K% currently is 21.5%). I’m going to throw some more numbers together to try and articulate an idea: Mark Reynolds is up to something.

This doesn’t seem to be a one-year fluke. Reynolds is a slightly different player than he was two years ago. His K% has been on the decline since 2015, when it was 28%. Last year it was 25.4% and obviously now it’s 21.1%. So let’s go to his plate discipline to see what’s changed.

Looking at his O-Swing% and PITCHf/x O-Swing%, there isn’t a huge difference. They both hover in and around his rate of 26-27%, though PITCHf/x has him at 29.5%. The real difference is in his Z-Swing%, where he has decreased his percentage over the last two years. In 2015, it was around his career norm of 70% by Baseball Info Solutions and 67% by PITCHf/x. The last two years: 69.4% and 66.2% respectively by Baseball Info Solutions, 66.2% and 64.9% respectively by PITCHf/x. He seems to be pickier in the zone overall and there is a tangible result.

His Z-Contact% career average as calculated by PITCHf/x and Baseball Info Solutions is 74.3% and 74%, respectively. In 2015, he made contact with pitches in the zone 80% of the time by both systems. Last year? 81.9% by Baseball Info Solutions and 84.6% by PITCHf/x. This year? 85.4% and 84%. He’s making more contact overall for the last two years, as it’s been in the 70% range rather than the 60% range. His SwStr% has been decreasing too! It’s been below 13% the last two years, where his career average is 15.7%. This is a different Mark Reynolds.

Maybe Reynolds is trying to take more pitches in the zone so he can focus in on his best pitch. The power is there — his ISO is .339, with 12 home runs thus far. Probably not sustainable, but 30 home runs can be reached even with a return to the average.

About that park factor, though. He really hasn’t hit much differently at Coors versus away from Coors.

The same amount of hits, admittedly more home runs, same amount of strikeouts, same amount of walks. Slightly odd thing — he has a reverse platoon split. Let’s chalk that up to small sample size. One more chart that I feel is important:

This chart befuddles me. He’s hitting fewer fly balls than league average (opposite league trend as touched on at FG main page), more ground balls than league average, and slightly more line drives than league average. Something funny is happening here. So, here’s the thing. His HR/FB is 44%. Aaron Judge is at 46.4% and no one expects him to sustain it. League average is 12.8% and Reynolds’ career high is 26%. His career average is 19.4%, which he hasn’t reached since 2011.
It all comes back to small samples, but even if he comes crashing back down, there’s still proof he’s trying to make a change. He’s making more contact and we know contact is a good thing, and this has been happening for more than just 30 games. If he sustains a fraction of this pace, he becomes trade bait at the deadline, or he stays part of a contender, and he may even get a pay raise in free agency. Mark Reynolds has made himself interesting.

Prospect Watch: 5 Future All-Stars No One Is Talking About

I chose to stick with hitters in this article, because pitching prospects are extremely difficult to predict, and I think the pitchers who do get the hype are typically deserving. However, I do see a trend of some unnoticed hitting prospects turning out great careers in the majors. Let’s get right to it.

1. Travis Demeritte – 2B – ATL

In 2016, Demeritte went from the Rangers’ to the Braves’ system and spent the entire year in high-A ball, where he dominated at the plate. A 2B with power like Cano, good speed and the ability to get on base is such a rarity.

In my opinion, Demeritte has the highest chance of being a perennial All-Star out of these five prospects. The middle infield in Atlanta has an extremely bright future. I’m predicting that Demeritte will make his splash in 2018, and make his first ASG appearance by 2020 (age 25). Let’s look at his numbers from a season ago:


Name Age G AB PA H 2B 3B HR BB SO SB CS BB% K% OPS ISO wOBA wRC+
Travis Demeritte 21 145 547 635 145 33 13 32 78 200 20 4 12.3% 31.5% 0.905 0.283 0.393 139


Let’s compare these to the four All-Star 2B in 2016 and Brian Dozier.

Name G AB PA H 2B 3B HR BB SO SB CS BB% K% OPS ISO wOBA wRC+
Jose Altuve 161 640 717 216 42 5 24 60 70 30 10 8.4% 9.8% 0.928 0.194 0.391 150
Robinson Cano 161 655 715 195 33 2 39 47 100 0 1 6.6% 14.0% 0.882 0.235 0.37 138
Brian Dozier 155 615 691 165 35 5 42 61 138 18 2 8.8% 20.0% 0.886 0.278 0.37 132
Dustin Pedroia 154 633 698 201 36 1 15 61 73 7 4 8.7% 10.5% 0.825 0.131 0.358 120
Ian Kinsler 153 618 679 178 29 4 28 45 115 14 6 6.6% 16.9% 0.831 0.196 0.356 123


Some things to keep in mind as we compare these players: Demeritte was playing in A+ ball, but he did play an average of 12 less games than these major-leaguers. As you can see, it’s basically a two-man race (other than Dozier’s 42 HRs) between Altuve and Demeritte here. While we cannot expect these A+ ball numbers to translate directly against ML pitching, Demeritte definitely deserves more attention in top-prospect lists. While he’s not quite as speedy as Altuve, he has more power, and he walks at a far higher rate. The one glaring weakness is the K numbers for Demeritte. However, some of the top players in the league K at very high rates. As long as the OPS stays high, it doesn’t really matter how a guy makes outs anymore.

I should note that 2016 was a breakout year for Demeritte; in years past he didn’t quite live up to his potential, and also served an 80-game PED suspension. These could be the main reasons why he hasn’t garnered much attention yet. He still has to prove himself to most. However, I’m sold. I’d pencil him in for the majority of the 2020s’ ASGs right now.


2. Ramon Laureano – OF – HOU

Laureano has all the tools: he can play any OF spot well, he has speed and pop, and he gets on base. Houston’s farm has taken a bit of a hit due to some trades in the last two years, but that’s because they knew they had guys like Laureano who don’t have super high trade value, but have a chance to be great ML players like the guys they traded. Let’s look at Laureano’s 2016 numbers.

Name Age G AB PA H 2B 3B HR BB SO SB CS BB% K% OPS ISO wOBA wRC+
Ramon Laureano 21 128 461 555 146 32 9 15 73 128 48 15 13.2% 23.1% 0.943 0.206 0.418 159


The numbers speak for themselves. This is the making of a star; where is the hype? I know it’s not a huge sample size, and we don’t have much to go off from the previous year either, but in A+ and AA last year he put up those phenomenal numbers you see above.

If those aren’t All-Star numbers, then I don’t know what are. Laureano’s ability to play all three OF spots will keep him in the lineup everyday and help his chances of making it to the ASG. When he does get the call-up, if his numbers stay relatively close to this, there’s no way he doesn’t make three to four All-Star Games. As of now, he’s more of a speed threat, but as he develops, the speed/power combo will even out and he will be an Andrew McCutchen-type player. Keep tabs on this guy.


3. Christin Stewart – OF – DET

While researching Stewart, I couldn’t find an article more recent than September of 2015. There’s no one talking about him…why? As we know, Detroit is aging and looking to deal top players. So, I’m assuming we will be seeing a lot of opportunities for young guys to step up and prove themselves. Detroit’s system isn’t super deep, but that could change anytime if they do decide to move some key pieces. Regardless, I see Stewart as the prospect to watch moving forward; he has the tools to be an All-Star. Let’s check out his numbers from 2016.

Name Age G AB PA H 2B 3B HR BB SO SB CS BB% K% OPS ISO wOBA wRC+
Christin Stewart 22 147 514 622 132 29 2 31 93 154 4 2 15.0% 24.8% 0.883 0.245 0.407 156


The power is impressive, and by this chart he looks even a bit better than the two previous guys I mentioned. However, with the K numbers pretty high up there, and not a whole lot of speed, Stewart is a player that could fall into slumps. Often times, adjusting to the majors can be challenging, and some top prospects never quite figure it out. While Stewart’s MiLB numbers are pretty insane, his slump potential makes him a pretty risky pick here. However, I do believe that if he does indeed figure it out, he will make it to a few ASG and serve as an everyday player in this league for a decade. HRs and BBs get it done. Keep an eye on Stewart.


4. Jason Martin – OF – HOU

Another Houston OF prospect…another future All-Star? I think so. The future is certainly bright over at Minute Maid Park: Altuve is a cornerstone, Correa is a centerpiece, Springer is a baller, and they have prospects for days. If they can just figure out how to pitch, they could be a WS contender for the next eight years.

Why Martin, though? Let’s check out his 2016 numbers from high-A ball.

Name Age G AB PA H 2B 3B HR BB SO SB CS BB% K% OPS ISO wOBA wRC+
Jason Martin 20 121 431 502 114 25 7 23 63 112 22 12 12.5% 22.3% 0.874 0.251 0.382 131


Impressive, to say the least. At just 20 years old, he pumped out 23 homers in 121 games. He walks every eight at-bats, and he also grabbed 22 bags on the season. The ability to walk and run (lol) will typically keep guys out of major slumps. While Martin is not a highly-touted prospect at this point, I think he will be a household name by 2022. I expect him to get the call-up in 2019 and play a significant role during a pennant race that year. In 2020, he will burst onto the scene and prove his worth to this franchise.

With Houston’s current build, this might be a guy we see dealt if they are trying to add talent at the deadline this year. That doesn’t change my prediction, however. I see Martin suiting up for the ASG a few times throughout his career. Stay posted.


5. Tom Murphy – C – COL

You can’t keep putting Yadier Molina in there every year. And with Buster Posey most likely making that change to 1B full-time within three years, Jonathan Lucroy getting dealt to the AL, Kyle Schwarber playing OF, etc, pathways for guys like Tommy Murphy open up. Making the All-Star Game as a C is not saying as much as other positions, in my opinion. A decent hot streak in the first half will inflate your hitting numbers. For example, Derek Norris in 2014. It may seem like he was the best catcher in the league at the halfway point, but, as usual, it evened out by season’s end.

With that being said, Murphy has proven he has pop, and playing in Colorado is a huge advantage for him. While I don’t think he will be a Hall-of-Fame catcher, I do think he’s flying under the radar right now and will probably open some eyes in 2017. I’d say he makes two appearances in the ASG before 2022. However, once he gets up near 30 and he’s no longer playing in Colorado, I think he will have trouble keeping a job.

I have him on the list, first of all, because he meets the criteria, and also because I think people should pay attention to him, and lastly because he’s ML-ready, unlike the rest of these guys. Trevor Story didn’t have a whole lot of hype; most people didn’t expect him to make the team out of spring, but with the Jose Reyes situation, the kid got a shot and as we all know, he ran with it. I’m not saying Murphy will make a cannonball-esque splash like Story, but I think he will turn some heads and maybe even get some ASG votes this year. Anything can happen, especially in Colorado. Keep tabs on him.

Honorable Mentions

Dylan Cozens – OF – PHI

There’s not a lot of buzz surrounding Cozens, which is surprising to me, because usually when we see 40 HR in 134 games, we really perk up. In his age-22 season, he played all 134 games at the AA level for the Phillies affiliate, Reading Fightin’ Phils, a place where most Phillies prospects prosper. The reason why Cozens doesn’t quite make the cut here is because of the words, “future All-Star.” He is one of those lefties that mash in the right ballpark and against RHP, but usually career platoon hitters, even if they are highly effective, don’t make the ASG.

Rhys Hoskins – 1B – PHI

Hoskins is another AA player in the Phillies system. He probably has a little bit more of a well-rounded hitting ability than does Cozens, but he’s a 1B, and that’s an overloaded position. You have to be incredible to crack that ASG squad, and I just don’t think Hoskins will ever be quite at that level. I do believe he will pan out to be an everyday guy for a good amount of time in this league. He has really good power and he gets on base, two things that will keep you in the lineup more often than not.

Bobby Bradley – 1B – CLE

Bradley is another guy I would keep an eye on; I’m just not sold on him yet. He has a a lot of raw power, but a really high K rate in the low levels of the minors. Also, he’s a 1B, so once again, really hard to make the ASG at that position.


Which MLB Hitters Have Gotten Off the Ground?

Following up on excellent recent pieces by Travis Sawchik and Jeff Sullivan, I had a hypothesis: If there is truly a swing-path revolution underway in MLB, perhaps the best hitters by wOBA and wRC+ showed more marked FB+LD%’s (Air%) tendencies in 2015-2016 than in years past? If not them, then perhaps there is a trend among the middle and/or lower classes of hitters?

The hypothesis was wrong, but the investigation still gave some interesting context to the 2016 power spike and the profiles of recent successful/unsuccessful MLB hitters in general.

Here’s a plot of the average FB%+LD% (Air%) for each year, 2009-2016, for all qualifying MLB hitters per FanGraphs leaderboards, divided into three roughly even buckets of 40-50 players by wRC+ (<100wRC+ left, 100-120wRC+ center, >120 wRC+ right):

Here’s a plot of the average FB%+LD% (Air%) for each year, 2009-2016, for all qualifying MLB hitters per FanGraphs leaderboards, divided into three roughly even buckets of 40-50 players by wOBA ( <.320 left, .320-.350 center, >.350 right):

The consistency of these numbers is remarkable. The writing has been on the wall for some time with regards to the benefits of hitting it in the air.

Perhaps plenty of hitters are (and always have been) trying to hit it in the air more often and are either failing to make the change stick, or not finding success quickly enough to stick with the change / stay in the league?

We aren’t seeing across-the-board nor player-class-specific changes that stand out beyond random variation by this method (yet).

There could be an equilibrium point here where given the best pools of pitching and hitting talent available (regardless of how they arrived at said status), the outcomes will be pretty similar at a macro level, save for major fundamental changes to how the game is played.

This does not mean that individual players cannot aspire to find more optimal approaches. Surely there have always been hitters finding success via these means, and only recently have we been focusing on batted-ball data and focusing on these traits of the transformations.

Preach on, Josh Donaldson: Ground balls? They call those outs up here.


The Case for No Starting Pitchers in the National League

I’ve watched many a baseball game over my lifetime (that’s 50+ years), and I’ve cringed every time I see a National League manager send his starting pitcher up to bat any time prior to the seventh inning. Especially with runners on base! Doesn’t he know that pitchers can’t hit? Doesn’t he know that if he would just pinch-hit for the lame-batting starter he’d improve his team’s chances of winning?

So, after years of pondering this problem for five seconds at a time every couple of days, I decided to see if I could build a solid quantitative case for never letting a pitcher come to the plate for a National League team (obviously this is not an issue for the American League with their designated hitters). How would this change the look of the team’s pitching staff? And more importantly, how many more games would a team expect to win in a season if they adopted a “pitchers never bat” strategy?

The answer to the first question is pretty easy. The staff would “look” different. There were would be no more “starting pitchers.” A team’s pitching staff would consist only of “relievers.” Sure, one of the “relievers” would throw the first pitch of the game and could technically be called a “starter,” but given that he’ll be taken out of the game as soon as his spot in the batting line-up comes up, he’s effectively a “reliever,” just like the other 10 or 11 guys on the staff.

Now, the conventional wisdom would say that the current starting pitchers, especially the “aces,” get in a groove, and can give you six or seven solid innings. Why would anyone take them out the game in the second or third inning? Well, let’s do a “cost-benefit” analysis and see if we can make a case for “The Pitchers Never Bat” strategy.


Key Components of the Case:

The two primary components of the analysis are 1) how many more runs would a team expect to score in a season by pinch-hitting for every pitcher, and 2) how many more runs would a team expect to give up in a season because their starting pitchers are no longer going six, seven, or more innings in an outing? Or, maybe the team adopting such a strategy would actually give up FEWER runs per year by giving up on the century-old strategy of planning for the starting pitcher to pitch deep into the game.

A third component of the analysis could include the benefit of being able to choose from any of the team’s entire staff (probably 11 or 12 pitchers) and use only the ones that look like they’ve got their “stuff” while warming up before the game, instead of sticking with the “starter” who is scheduled to pitch today because it’s his turn in the “rotation.”

A fourth component of the analysis could include the benefit a team could achieve because the other team can no longer stack their starting batting order with a lot of lefties (to face a right-handed starter), or with lot of righties (to face a left-handed starter), because the team with no “starters” will pinch-hit for their first pitcher after one, two, or three innings. So, in total, the “handedness battle” tilts slightly more in favor of the team implementing the new strategy.

A fifth component could include the cost (or benefit) of reducing the size of the pitching staff by one or two, and adding one or two more everyday players, who would be needed to pinch-hit in the early innings.

A sixth component could be an added benefit that batters will not be able to get “used to” a pitcher by seeing them multiple times in a single game. Under the new strategy batters will see each pitcher once, or, at most, twice in a game.

I’m going to focus on the two primary components above, and let the lessor components alone for now. Perhaps others can weigh in on how to quantify the potential impacts of these changes.


Component #1: How much more offense will the “Pitchers Never Bat” strategy create?

This is the easiest of the components to quantify. I will use the wOBA (weighted On Base Average) statistic as defined and measured by FanGraphs to evaluate this component. Let’s start with some basic information and rules-of-thumb.

Using data from the National League for the 2015 season I find that pinch-hitters have a wOBA of .275 across the entire league, while pitchers, when batting, had a wOBA of just .148 across the entire league. The difference in wOBA between pinch-hitters and pitchers is .127 (that’s .275 minus .148.) Note that all position players in the NL combined for an average wOBA of .318 in 2015. I’m assuming that our new pinch-hitters won’t get anywhere near that figure, but will be comparable to the 2015 pinch-hitters, who came in way lower, at .275.

Now, let’s assume we can replace every pitcher’s plate appearance (PA) with a pinch-hitter. This improvement of .127 in wOBA needs to be applied 336 times per season, because that was the average number of times that a National League team sent their pitchers up to the plate in 2015. And lastly, we need to know two rules of thumb from FanGraphs that are needed to complete the analysis of the first component: 1) every additional 20 points in wOBA is expected to result in an additional 10 runs per 600 plate appearances, and 2) every 10 additional runs a team expects to score in season translates into one additional win per year. OK – so, let’s do the math:

If 20 additional points of wOBA translates into 10 runs per 600 PA, then our new pinch-hitters who are now batting for pitchers will provide the team with 63.5 incremental runs per 600 PA (which equals 127/20 * 10.) And since these pinch-hitters will be coming to the plate 336 times, not 600 times, we need to reduce the 63.5 incremental runs per season down to 35.6 incremental runs per season (which is 336 / 600 * 63.5).

Finally, the last step is to take our 35.6 incremental runs per season and translate that into incremental wins per year using the rule-of-thumb that ten runs equates to one win. Therefore, our 35.6 extra runs results in an expected 3.6 incremental wins per year. That’s a decent-sized pick-up in expected wins.

OK, so now, what about the pitching staff? Will replacing the conventional pitching staff with a staff consisting of no starters and all relievers cause the runs allowed to increase, and if so, by how much? Enough to offset our 3.6 extra wins that we just picked up on offense?


Component #2: How many more runs will pitchers give up using the “Pitchers Never Bat” strategy?

Imagine, for the moment, that a GM is to build his pitching staff from scratch. (We’ll worry about how to transition from a conventional staff to an all-reliever staff later.) And let’s just assume he’ll pick just 11 pitchers. (Most NL teams use 12-man staffs while some use 13, so that will give the team one or two additional position players.) Currently, starting pitchers typically throw 160-200 innings per season, and relievers tend to throw 50-80 innings per season. But with the new all-reliever strategy, and using only 11 pitchers, each of our new guys will need to average around 130 innings each, with perhaps some pitching as much as 160, and some as low as 100 innings per year. So, the GM is looking for 11 guys who can each contribute 100-160 innings per season. Each outing will be for about one to three innings for each pitcher. How will they fare?

Let’s look at the National League’s pitchers for 2015. Starting pitchers had an aggregate WHIP (Walks Plus Hits per Inning Pitched) of 1.299, while relievers, in total, recorded an identical WHIP of 1.299. So my takeaway from this is that the average starter was equally as good (or bad) as the average reliever. From this, I am going to take a leap of faith, and assume that a staff of 11 new-style relievers could be expected to perform equivalently. (And that doesn’t even factor in some of the lesser elements of the new strategy, as mentioned above, such as Components 3 and 4 of the analysis.)

From this, albeit simplified, evaluation of Component #2, I estimate that a team moving to an all-reliever pitching staff will have an expected change in Runs Allowed of zero, and therefore the change will neither offset, nor supplement, the offensive benefit evaluated in Component #1.


Conclusion and Final Thoughts

In summary, using the two primary components of my analysis, I estimate that adopting a “Pitchers Never Bat” strategy in the National League (a.k.a. an “All Reliever Pitching Staff” strategy) will improve a team’s offense by an expected 36 runs per year, which will increase the team’s expected win total by 3.6 games. I estimate that the impact on runs allowed will be near zero. Some lesser elements, Components #3 through #6, could also add some additional value to the strategy.

Implementing the strategy does not necessarily need to be a complete, 100% adoption of the “pitchers never bat” rule. Modifications can be made. Perhaps a pitcher is doing well through two innings and comes to bat with two out and no one on base. In this case the manager could let the pitcher bat, so that he can stay in and pitch another two or three innings. This would change the name of the strategy to something like the “Pitchers Very, Very Rarely Bat” strategy.

As far as transitioning to an all-reliever staff from a conventional staff, it could be done over time, or only in part, such that a team could maintain, say, its two top aces, and complement them with eight or nine relievers. This way, the aces could pitch as they do now, going six-plus innings, every fifth day, while limiting the “Pitchers Never Bat” strategy to the three out of the five days when the two starters are resting.

Finally, let’s try to put a dollar value on this new strategy. The guys at FanGraphs, and other places, have tried to estimate how much teams are willing to pay for each additional win. Without going into all the various estimates and approaches at trying to answer that question, let’s just go with a simple $8 million per win. I’m sure it could be argued to be more or less, but let’s just put $8 million out there as a base case. If that’s true, a 3.6-win strategy, such as the “Pitchers Never Bat” strategy, is worth about $29 million per year. Go ahead and implement the strategy now, and, if it takes, say, three years before any of the other NL teams catch on, you’ve just picked up a cool $87 million (3 * 29 million).

And if the other components of the analysis (#3 through #6) are quantified and it can be determined that they add another 0.5 wins per year, which I think is quite doable, then we can get the total up to 4.1 wins per year, for a value of $33 million per year, or just around a cool $100 million over the first three years. And that’s how you make $100 million without really trying!


Will the Real Tyler Goeddel Please Stand Up?

Similarly to a large portion of the FanGraphs community, I am a Philadelphia Phillies fan.  I was born in South Jersey just 20 minutes away from the stadium and grew up watching every game.  I was there for the tough times in the late 90’s / early 2000’s, and I was there for the glory days of 2007-2011.  After an abysmal last few seasons of baseball in Philadelphia, we have finally seen some promise this season leading us to believe that better days are coming soon.  One of the bright spots on the team so far this year has been Rule 5 pick, Tyler Goeddel.

After being selected in the first round of the 2011 MLB Rookie Draft, Tyler Goeddel began his professional career with the Tampa Bay Rays.  Goeddel was drafted out of high school as a third baseman and for the first three years of his minor league career that would be the only position he played.  In 2015, however, the Rays decided to move Goeddel to the outfield.  His athleticism allows him to play all three outfield positions and that type of versatility is very sought after by big league clubs.  While defense was never his problem, Goeddel’s bat didn’t develop as quickly as the Rays had hoped.  He was a career .262 hitter with 31 home runs across four full seasons in the minor leagues.  Ultimately the Rays made a tough decision and left him off their 40-man roster, knowing there was a great chance another team would select him in the Rule 5 Draft.  Shortly after, the Phillies did just that and selected Goeddel with the first overall pick of the 2015 Rule 5 Draft.

The Philadelphia Phillies have historically been excellent in finding talent in the Rule 5 Draft.  (2004 – Shane Victorino, 2012 – Ender Inciarte, 2014 – Odubel Herrera).  In the early going, I (like most Phillies fans) was very skeptical as to whether or not Goeddel could follow in the footsteps of players like Shane Victorino and Odubel Herrera and become a valuable contributor to our big league team.  Goeddel had a mediocre spring training but with no other serious competition in the corner outfield spots, there was no harm in keeping him around for a rebuilding year and seeing what the kid could do.

The beginning of Tyler Goeddel’s major league career could not have gone much worse.  Take a look below at his stats through his first nine games:

4:6 - 4:19 Stats

In only 16 at-bats, Goeddel recorded only one hit (a single), and struck out a whopping eight times!  Now obviously this is a VERY small sample size, and we should expect some struggles while adjusting to big league pitching.  Up until this point, Goeddel has never seen pitching above the Double-A level.  Now let’s take a look at his plate discipline stats over the same time frame:

4/6 - 4/19 Plate DisciplineO-Swing % – Percentage of time a batter swings on pitches outside the strike zone
Z-Swing % – Percentage of time a batter swings on pitches inside the strike zone
Swing % – Percentage of time a batter swings at a pitch, regardless of location
O-Contact % – Percentage of times a batter makes contact with a ball when swinging outside of the strike zone
Z-Contact % – Percentage of times a batter makes contact with a ball when swinging inside of the strike zone
Contact % – Percentage of times a batter makes contact with the ball when swinging
Zone % – Percentage of overall pitches thrown to batter that were in the strike zone

There is nothing noteworthy about his swing percentages as they are all just about equal to the league averages, but the contact percentages are quite alarming.  Through his first nine games, Goeddel only made contact 53% of the time he swung his bat.  Rather than just writing this off as a rookie being over-matched by big league pitching, I decided to dig deeper into these stats and figure out exactly where Goeddel was struggling.  Check out the video below that I put together which basically sums up the beginning of Goeddel’s career in 30 seconds:

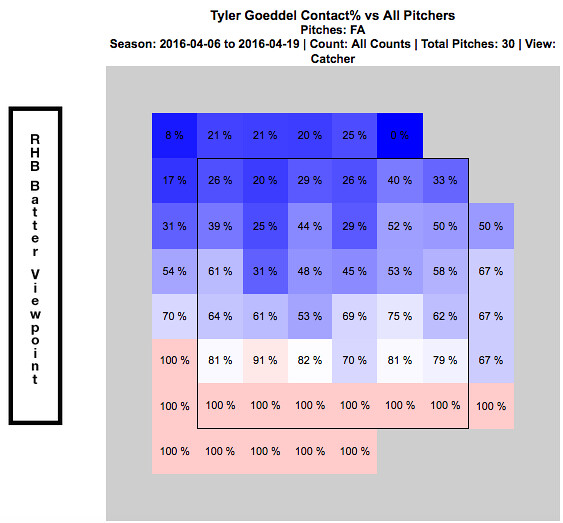
Whether or not you realized from watching the above video, every one of these swing and misses came on a fastball.  They all also came in the upper portion of the strike zone.  Just by watching Goeddel’s at-bats through this point of the season, it was clear as day to see opposing pitchers were attacking Goeddel with fastballs up in the zone.  The chart below shows every fastball that was thrown to Goeddel over his first nine games.  It is broken up by hot and cold zones and shows his contact percentage versus the fastball at every portion of the strike zone:

4:6 - 4:19 Contact % vs Fastball

This chart verifies for us what we saw in the video…Goeddel really struggled to hit fastballs up in the zone to begin the season.  At this point, everyone was frustrated.  Tyler Goeddel was frustrated because he knew he was much more talented than his results thus far have showed.  The Phillies organization was frustrated because they had such high hopes for Goeddel entering the season.  And most importantly, the Phillies fans were frustrated and began questioning what the Phillies could possibly see in this guy.  (Search for Tyler Goeddel’s name on Twitter and read old tweets from this time period if you don’t believe me!!)

An important thing to remember while looking at these stats, is that up until this point of his career Goeddel has been an every-day player.  Not only is he adjusting to big league pitching, but he is also trying to adjust to not having consistent at-bats.  Since the Phillies unexpectedly got off to such a hot start, an important decision needed to be made.  On one hand, they have this young promising player who will need consistent at bats in order to show his true potential.  But on the other hand, this team is surprisingly in the hunt in the NL East and may not want to allow Goeddel to go through his growing pains while they are competing for the division title.  Eventually, a decision was made and manager Pete Mackanin started to put Goeddel in the every-day lineup. Below are some quotes from Goeddel at this time speaking of the decision:

“Getting regular playing time and the confidence [from that] is huge, but I try to get started a little earlier on my swing so I can be on time with the fastball. You need to hit the fastball if you want to play up here, obviously. I feel like I’ve made that adjustment and it’s been a huge help.” – Tyler Goeddel

“I didn’t play how I wanted to play in April.  And I’m glad he’s (Pete Mackanin) giving me a chance, because I really didn’t play my way into a chance; he just gave it to me. So I’m trying to make the most of it.” – Tyler Goeddel

The video below (from 4/23/16) summarizes Goeddel’s early season struggles and the decision to give him more playing time:

The Phillies coaching staff deserves a lot of credit.  They recognized early on that Goeddel was struggling with fastballs up in the zone and prior to this game really worked with him in that area and promised him more playing time moving forward.  Here is a video of his next at bat in the game, where the pitcher tries once again to attack Goeddel with some high heat:

Goeddel responds with another base hit and his first RBI of the season.  Take a look below at how his stats over his next seven games compare to his stats from his first nine games.

4:23 - 5:6 Stats

4:23 - 5:6 Contact %

You can very easily see that Goeddel drastically improved his contact percentage over this time frame, which resulted in a huge drop in his strikeout rate.  The video below is from 5/8/16, right after the stretch of stats we just evaluated.  Goeddel had a big hit late to tie the game for the Phillies and later came in to score the winning run.

As you could see, the hit came on a high fastball.  A few weeks ago, Goeddel could not touch this pitch…but all of a sudden he is beginning to prove that he can.  The next video is from after that game.  Tyler discusses the adjustments he has made and also how playing every day has contributed to his recent success:

This hit was the start of a new Tyler Goeddel.  Pitchers continued to attack him with fastballs up in the zone and Goeddel really started to make them pay.  This is what he did to a Brandon Finnegan fastball just a few days later:

Ever since that hit on May 8th against the Marlins, Goeddel has been the player the Phillies could have only hoped he one day would become.  He has flashed signs of brilliance in just about every game since that have Phillies fans drooling over what the future outfield could look like.  Even though he has made adjustments and is seemingly now catching up to big league fastballs, opposing pitchers continue to test him.  Check out the video below that I put together showing what Goeddel has done to fastballs in the upper portion of the strike zone over the last few weeks.

As you can clearly see, this is a different player than we saw early on in the season.  Take a look at how his recent stats compare to those early on:

5:6-5:20 Stats

5:6-5:20 Contact %

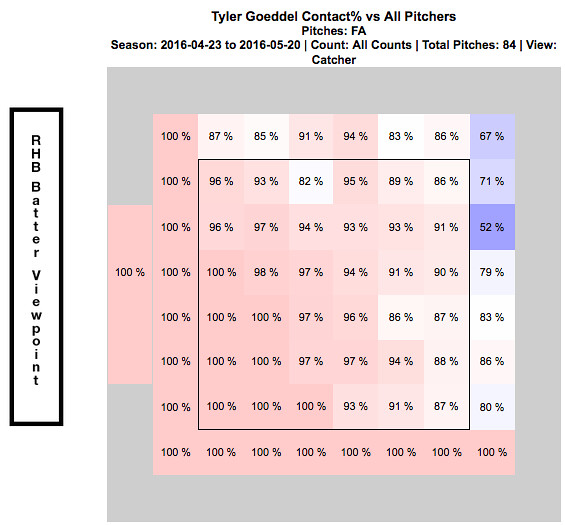
Goeddel’s contact percentage over his first nine games was only 53%.  Over his last 10 games, it is 91%.  That is an incredible difference and clearly his adjustments are paying off.  In turn, his improved contact has led to a strikeout percentage of only 5.4% over his last 10 games.  The chart below shows how Goeddel has fared against the fastball since he noted his adjustments on April 23, 2016.

4:23 - 5:20 Contact % vs Fastball

Now go back up to the top of the article and compare this chart to what it looked like at the beginning of the season.  More consistent at bats have clearly translated into him catching up to the fastball and the results thus far have been phenomenal.  I have to admit that I was a doubter early on, but I am now completely on board the Tyler Goeddel bandwagon.  This kid is only 23 years old and the fact that he was able to so quickly make an adjustment like this and immediately see results is remarkable.  Now that he is having some success, opposing pitchers will start to change their game-plan against him.  While the pace he is on now may not be sustainable over the course of a full season, I am confident that Goeddel will continue to make the necessary adjustments and help this Phillies team continue to find ways to win ball games.  Although the video below doesn’t exactly relate to his success at the plate, I had to throw this in here and it is a must watch if you have not seen it already:

The last video I will show features Goeddel’s post game interview after this throw:

Recent Quotes:

“It’s exciting.  Coming to the field everyday I’m expecting to see myself in the lineup. That’s a feeling I didn’t have last month. It’s a lot more relaxing, less stressful.” – Tyler Goeddel

“It was definitely a big adjustment, going from playing everyday my whole career to having a specific role, and then not performing well in my role, it was a little tough.  But, you know, they’re giving me an opportunity now and I feel like I’m playing better, which is nice. I’m happy for myself. I always knew I could play up here, but I needed some results to prove it to myself. I’m glad, finally, there are some results to show.” – Tyler Goeddel

I love how confident Goeddel is when he speaks of his game and I am so glad the numbers back him up.  I continue to be blown away watching him play every day, especially due to the fact that he has only been playing the outfield for one year.

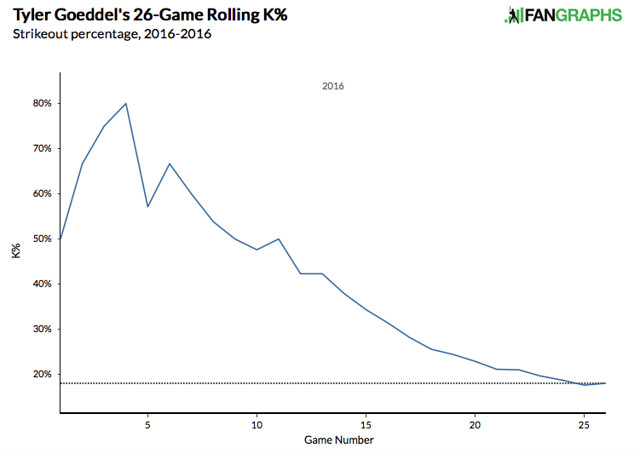
Lastly, I want to show a few graphs.  The first one shows a rolling total of Goeddel’s strike out percentage so far this season.  The statistics earlier show you that it has decreased, but this graph makes it much easier to see his progression:

Rolling K%

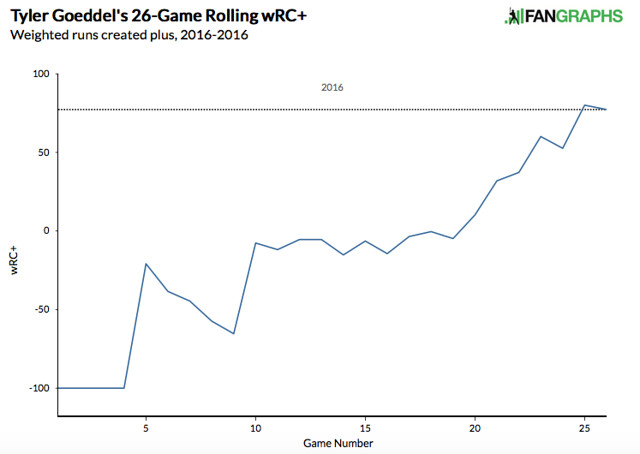
The next graph is another rolling total showing how Goeddel’s wRC+ has progressed throughout the season.  For those of you who are unfamiliar with the stat, wRC+ stands for weighted runs created plus.  It attempts to quantify a player’s offensive value in terms of runs.  An average wRC+ is 100.  Check out how Goeddel’s wRC+ has improved throughout the season:

Rolling WRC+

What do you think, Phillies fans?  Can Tyler Goeddel keep this up?  Is the Tyler Goeddel that we have seen over the last few weeks the real Tyler Goeddel?  Are you ready to hop on the bandwagon yet or do you need to see more from him to believe?  Only time will tell, but I’m buying into the hype and am excited to see what the future holds for this promising young player.

Twitter – @mtamburri922


Don Mattingly’s Dodgers In the Context of wOBA Expected Runs

Weighted On-Base Percentage (wOBA) is typically considered to be the best measure of offensive ability and effect on runs scored among other rate statistics such as batting average, slugging percentage, and on-base percentage. 89.8% of a team’s runs scored correlates to wOBA between 2005–2015. I decided to look at a team’s performance, measured by how many runs they scored in a season, against the amount of runs wOBA predicted* they would have scored.  (wOBA Expected Runs was calculated based on a linear regression model with runs modeled as wOBA. The adjusted r-squared value of R~wOBA is .898)

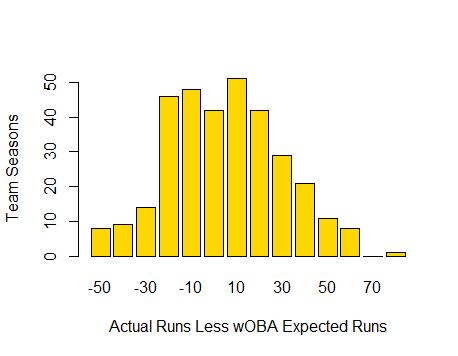
Generally, the results are what you would expect. Teams deviate from their wOBA Expected Runs, but the 50% of the teams (between the 25th and 75th percentile of the observations) range between -17.49 and 16.9 runs from their wOBA Expected Runs.

The outliers even fall within the uncorrelated portion of the relationship between runs scored and wOBA. As stated above, wOBA explains 89.8% of runs between 2005 and 2015. At the far right of the graph is the 2008 Minnesota Twins, who scored 829 runs against their 756 wOBA Expected Runs. The difference, 73 runs, is less than the 10% of runs that is theoretically not explained by wOBA. At the far left of the graph is the 2005 Arizona Diamondbacks who scored 696 runs against their expected amount of 756. Again, this 60-run differential falls within the 10% gap we would expect.

The mean difference of runs scored from the wOBA Expected Runs Scored is minuscule (.003 runs) and the standard deviation from that mean is 24.9 runs. This all strengthens wOBA’s position as the best offensive run predictor.

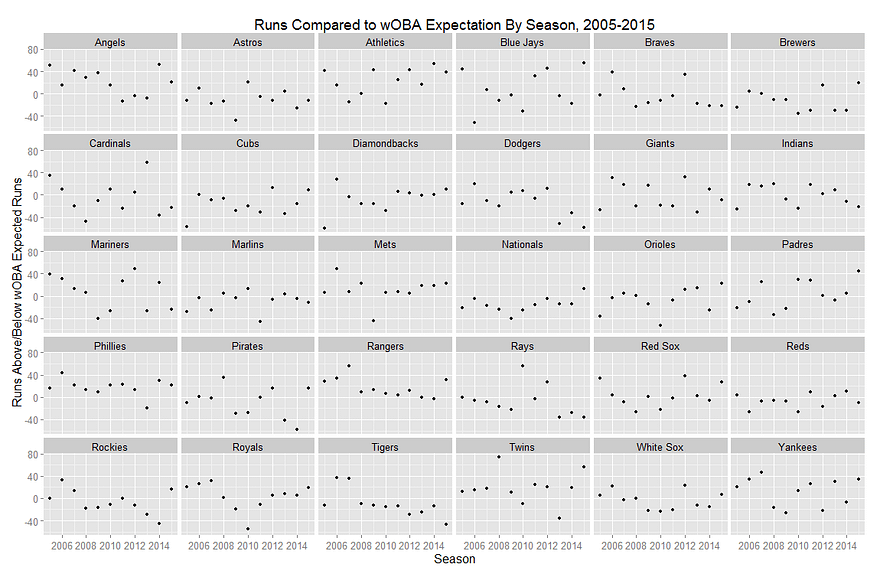
What does this all have to do with Don Mattingly and the Dodgers? The graphs below show each team’s runs scored below or above their wOBA Expected Runs Scored. You’ll see that teams fall within the standard deviation of runs scored less wOBA Expected Runs (-25.93–24.87), with some exceptions. The exceptions that fall outside of that range generally do not display a tendency for extreme over- or under-performance of their wOBA Expected Runs in consecutive seasons; however one team does stand out.

The 2013–2015 Dodgers consistently under-performed their wOBA Expected Runs, with the following differences in the respective seasons from 2013–2015: -51, -33, and -58 runs. To put this in context, only 8 of 330 of teams, or roughly 2%, that took the field between 2005–2015 under-performed their wOBA Expected Runs by more than two standard deviations (-49.8). The 2013 and 2015 Los Angeles Dodgers were two of those teams. No other franchise appears on the list twice, much less twice within three seasons.

In Mattingly’s first two seasons with the Dodgers (2011 and 2012) the results were standard, with a -6 and +12 runs to wOBA Expected Runs differential, but when the Dodgers came under new ownership and started spending to bring in new players things changed. The team got better but their performance in relation to what they were doing got worse.

A glance at the graphs above will show that teams have under-performed their expectations, but never this badly for a three-year stretch. There is luck and there are trends, and the Dodgers are a trend of under-performance. Does this mean Don Mattingly is a bad manager? Maybe. Does it mean that Mattingly was a bad fit for this Dodgers team as constructed? Probably.

It could all be on the hitters; it could all be bad luck, but those seem unlikely. The 2013–2015 Dodgers are the worst offensive under-achievers in the last decade. The results suggest that Mattingly was unable to shuffle a cast of talented and enigmatic hitters into the right order to produce the best sequencing of results. Alternatively, the other narrative is that Mattingly was handed a group of talented and enigmatic hitters that couldn’t execute situational hitting and hit inconsistently. Either way, the Dodgers cost themselves a lot of wins through one, or a combination of the two narratives. The team lost 5, 3, and 5 wins each year, compared to if they met their wOBA Expected Runs, as calculated using the Runs per Win for 2013–2015.

This doesn’t necessarily bode poorly for Mattingly in Miami. The Marlins don’t have the benefit of a deep and talented bench. They are a fairly straight-forward offensive team that should allow Mattingly to write-up consistent lineups so long as the team remains healthy. This is not to say the Marlins will out-perform the Dodgers. It is to say that the Marlins may perform closer to how we would expect them to perform.

However, if the problem did not lie with Mattingly, but instead the Dodgers’ roster, than things do bode poorly for the Dodgers. It will be interesting to see if Dave Roberts can unlock something Mattingly could not; or whether the players are to blame; or whether Los Angeles must wait for Gabe Kapler, baseball’s philosopher-king, to set the runs free.


The Leadoff Hitter: Is Speed the Answer?

Classical baseball line-up construction involves putting your fastest player in the lead-off spot. This is due to the belief that speed generates runs (a la Rickey Henderson). In order to test this theory I went back to 1998 (since the last expansion) and looked at how may runs were scored in each season and then looked at 3 indicators, OBP, wOBA and stolen bases to test which indicator would be most useful in predicting runs. Although OBP and wOBA are very similar stats I decided to include both of them in the analysis because of differences in calculation. To put simply OBP gives a home run the same weight as a single and considers them equal (which they are not) while wOBA gives different types of hits more weight (see the OBP and wOBA pages for more information). I’ll admit that I am a huge fan of stolen bases, there is nothing like watching a player steal second or third to try and get a rally started. But the question is, can you expect to score more runs by being fast or by getting on base?

To get started I only looked at data from 2015 and pulled out the top 25 players from each stat category in order to define the “fast” players and the players who get on base the most. I also standardized runs scored to runs per game (RPG) to account for rest days and injuries which may have kept players out of the lineup for short periods of time. In the plot below it appears that the leaders in stolen bases have been scoring fewer runs per game than players who get on base more often. Based on the 95% confidence intervals of the top 25 players the difference was not significant, but the results are interesting nonetheless.

Now let’s look at some long-term data with how many runs were scored each year since 1998. In the plot below we can see that there was a large spike in runs scored in 1999 and 2000 before scoring evened out. The trend seemed to remain relatively stable from 2001 up until around 2006 or 2007 and then we see a dramatic decrease in runs scored up until last year. MLB started testing for steroids in 2003 and perhaps this is why we’ve begun to see that decrease in runs scored, but that is outside the scope of this article so let’s just focus on runs.

Runs are the most important aspect in baseball, whether that means scoring runs or preventing them. In the end, if your team can’t score any runs then you can’t win any games and unless a team have a titan of an offense you need to prevent runs as well. Here we are going to focus on run generation so we can forget about run prevention from here on out. Let’s look at the seasonal stats for our indicators and see how they look over time. I’m going to note here that OBP and wOBA shown in the plots are the league average, while the stolen bases are the league total for each season. A quick look tells us that OBP and wOBA are very closely related to the trend we saw in the second figure while stolen bases have a lot of variability over time. This seems to give a lot of evidence to getting on base, but let’s go one step further and see if we can develop a linear model to predict how each predictor affects the expected runs scored in a season.

In the final plot below I’ve put runs per game on the y axis and each stat on the x axis. In order to test how changes in league performance affects run scored I predicted the number of runs scored based on the 10%, 50% and 90% quantiles to see how many runs a player would generate over a 162-game season.

I’ve created a summary table for easy comparison of each stat and the thing that really jump out is that stolen bases doesn’t have any effect on runs scored. Based on the model, in a season where players steal almost 700 more bases collectively they generate less than 1 extra run.

OBP Expected Runs (Per Season)
0.319 56.51
0.333 60.93
0.340 63.15
wOBA Expected Runs (Per Season)
0.315 56.64
0.328 60.77
0.336 63.31
Stolen Bases (Season) Expected Runs (Per Season)
2583 59.74
2918 60.21
3281 60.72

In the end, getting on base is the most important (Thanks Moneyball!). For many the results should be unexpected, players who get on base more give their teams more opportunities to score runs. There doesn’t seem to be a significant advantage to using OBP or wOBA to predict runs, but based on advanced analytics people should probably consider wOBA more useful since singles, doubles, triple and home runs are all treated differently in the calculation.


What Has Happened to the Second Basemen?

 2nd Base hasn’t been a particularly stacked position in the major leagues in the past five years. Entering the 2015 season, the 2nd base position was headlined by Jose Altuve and Robinson Cano. The second tier arguably consisted of Ben Zobrist, Neil Walker, Dustin Pedroia, and Ian Kinsler, and maybe Brian Dozier. Then the next level housed names like Jason Kipnis, Daniel Murphy, and maybe DJ LeMahieu. I’m here to analyze what has possibly happened to this group of baseball players in the past few months.

According to the Depth Charts pre-season projections, the top eight second basemen ranked by wOBA were Robinson Cano, Neil Walker, Ben Zobrist, Jose Altuve, Dustin Pedroia, Ian Kinsler, Howie Kendrick, and Chase Utley. The projections are usually somewhat accurate, but if you’ve been following baseball at all this season, just by looking at those names, you know that we’ve found an exception to that.

These are the top 10 second baseman thus far in the 2015 season ranked by wOBA:

Name Team G PA HR BB% K% ISO BABIP wOBA wRC+
Jason Kipnis Indians 69 322 5 10% 13% 0.17 0.396 0.409 169
Brian Dozier Twins 70 310 14 9% 19% 0.257 0.276 0.363 133
Logan Forsythe Rays 72 284 8 9% 15% 0.161 0.325 0.363 139
Joe Panik Giants 69 296 6 9% 12% 0.156 0.326 0.362 137
Dustin Pedroia Red Sox 68 311 9 9% 12% 0.147 0.325 0.358 127
Dee Gordon Marlins 68 311 0 3% 15% 0.071 0.418 0.347 120
Danny Espinosa Nationals 62 229 8 9% 22% 0.187 0.317 0.345 118
DJ LeMahieu Rockies 68 274 4 7% 16% 0.103 0.373 0.344 102
Kolten Wong Cardinals 69 284 8 7% 14% 0.163 0.3 0.336 114
Jace Peterson Braves 66 270 2 11% 17% 0.103 0.337 0.327 107


If I told you in April that Logan Forsythe would be the 3rd best second baseman in the league, you would think I’m ridiculous. He came absolutely out of nowhere to raise his BABIP nearly 60 points and raise his ISO 55 points! Joe Panik’s beautiful swing has moved him up to be the 4th best-hitting 2nd baseman. Jason Kipnis has shut up all the critics. He took his .310 2014 OBP as confidence going into this year, and now has a wOBA over .400. Danny Espinosa, who has been previously known as a ‘defensive’ second baseman, has skyrocketed his offensive production into a player who Matt Williams is comfortable having run onto the field every day. Cardinals 2B Kolten Wong is pulling the ball more and more every season. He’s also upped his LD% from 19% to 25%. Braves utility-infielder Jace Peterson is doing a bit of hitting in his rookie year, after being traded from San Diego (who, it turns out, could really use him) to the Braves in December. Think back to when I mentioned the tiers up top. Where is Robby Cano on the list above? Where’s Altuve? I don’t see Zobrist, Walker, or Kinsler on this list either. It is not an error.

So we talked about the breakouts at 2nd; now lets talk about the guys who haven’t or haven’t yet lived up to expectations.

Lets start with the guy who all of his fantasy owners hate this year. Robinson Cano. Yeah, the six-time All-Star Robinson Cano. The 32-year-old — the guy who has a wRC+ of 76. This is easily, by far, his worst season of his 11-year career. Why? Lets talk about it.

Cano has raised his Hard% and his Pull% over 4% each! What does jump out at you is that he’s making a ton less contact than he did last year. Actually, the least of his whole career. His Contact% has plummeted down almost 5%. Along with a raised K%, his BABIP has jumped down nearly 50 points.

The next guy is Altuve. Altuve hasn’t been that bad this year, but compared to his 2014 campaign, he’s not playing like Jose Altuve. He’s even fighting with a mild hamstring injury, but in his 287 PA’s, every single one of his numbers are down. His wOBA has decreased .363 to .304. BB% is down, strikeouts are up, OBP and SLG are both way down. He’s swinging more, and making less contact which isn’t a combination that pulls you in a positive direction.

Same can be said for Neil Walker. Almost all his numbers are down. One of the positives that I found, though, is that he’s hitting the ball harder. My prediction is that the .303 wOBA will start to show positive regression. Ian Kinsler isn’t having a horrible season. He’s raised his OBP a bit, but he’s becoming more of a singles hitter, dropping his SLG from .420 to .338.

Almost every starting second baseman in the big leagues has totally changed their style of hitting this year. Guys like Forsythe and Panik, who were projected to be replacement level or below, have made their names rise to the top of many leaderboards. Cano and Altuve’s value have fallen. Here’s your homework: Think of all the 2nd baseman in the major leagues. How many of them have close to similar stats from their projections? Comment down below.