Archive for St. Louis Cardinals

Marcell Ozuna Has a Slice

This article was originally published at Birds on the Black, a St. Louis Cardinals blog. You can find the blog (@birdsontheblack), author (@zjgifford), and artist (@cardinalsgifs) on Twitter.

Back in November, the FanGraphs staff ranked Marcell Ozuna as the seventh-best available free agent. In that article, Kiley McDaniel and the FanGraphs crowd both expected Ozuna would receive a four-year deal, with the median crowdsource estimate coming in at $64 million ($16 million per year) while McDaniel was a little higher at $70 million ($17.5 million per year). Teams could dream on Ozuna’s potential and a return to his 2017 production with relatively minimal risk — since his 2013 debut, Ozuna has consistently produced as an average or better player. Coming into this offseason, he had produced more than 2 WAR in four straight seasons dating back to 2016. Free agents are never a sure bet, but Ozuna seemed pretty close to one at a reasonable price.

Ozuna ended up betting on himself by taking a one-year deal with Atlanta, which was a bit of a surprise. With that context, I wanted to see what happened during his breakout 2017 campaign and what might be holding him back from tapping back into that potential. We’ll start with some numbers: Read the rest of this entry »


The Matt Carpenter U-Turn

Following a 0-for-4 performance against the Twins on May 15th, Matt Carpenter was hitting .140/.286/.272 with a 59 wRC+ over 140 plate appearances. That’s not, um, optimal. One of the Cardinals best players in recent memory was not starting the 2018 season on the right foot. At the time though, Carpenter’s underlying numbers indicated better times were ahead as his .371 xwOBA (expected wOBA) was much higher than his actual .257 wOBA. If you’d sort the largest underperformance difference between xwOBA and wOBA through May 15th for hitters with at least 75 plate appearances, Carpenter’s figure calls out for immediate attention.

Table 1. Underperformance by wOBA-xwOBA through May 15th, 2018 (Min. 75 PA)

Player Name               wOBA            xwOBA          Difference
Randal Grichuk           0.201             0.325                -0.124
Matt Carpenter            0.257             0.371                -0.114
Kole Calhoun               0.174              0.274               -0.100
Avisail Garcia              0.246              0.345               -0.099
Jason Kipnis                0.234              0.330              -0.096
Teoscar Hernandez    0.357              0.447               -0.090
Adam Duvall                0.284             0.371                -0.087
Ryan Zimmerman      0.298              0.384              -0.086
Jason Heyward           0.293              0.377               -0.084
Bryce Harper               0.381              0.463               -0.082

Despite xwOBA not being a “perfect” metric, it still provides a fair amount of insight into a player’s performance. Alas, the metric, to my knowledge, hasn’t accounted for speed data for every player. I am not as well-versed in the Statcast metrics as I would like to be, but that is one missing piece that would be critical in my opinion. At the same time, we can still make reasonable assumptions based on the data at hand.

Carpenter was clearly underperforming based on what one would expect from his batted ball data and historical results. This kind of rough start was surely not going to last an entire season. Eventually, the numbers would start to normalize. But could the shift have played a role in the early lackluster results? Perhaps as he has faced the highest percentage of shifts for a St. Louis hitter in 2018.

Table 2. Shift/Non-Shift Percentage Breakdown – 2018

Shift          Non-Shift
82.4%         17.6%

Look how opposing infields lined up against Carpenter when he stepped into the batter’s box this season. More times than not the infield shifted more towards the first base side, which makes sense against a left-handed hitter.

Screen Shot 2018-08-10 at 12.26.48 PM

Still, indications existed that pointed towards a rebound for the age-32 infielder as his 88.4 MPH average exit velocity through May 15th wasn’t too far off his yearly numbers per Baseball Savant. Starting on May 16th though, the sudden U-turn of Carpenter’s 2018 season took place.

Table 3. Top ML hitters by wRC+ since May 16th (Min. 100 PA)

Player Name               wRC+
Matt Carpenter             203
Mike Trout                     189
Mookie Betts                 188
J.D. Martinez                182
Max Muncy                    172
Jose Ramirez                 170
Paul Goldschmidt         165
Alex Bregman                164
Nelson Cruz                   163
Shin-Soo Choo              161

Holy expletive! Carpenter has been a better hitter, by wRC+, than Mike Trout. That’s something.

Since May 16th, Carpenter has arguably been the best hitter in baseball. His 203 wRC+ leads the majors since mid-May, and his .336/.434/.730 slash line looks darn right impressive. His 32 home runs is a new career-high. Since May 16th, Carpenter has an average exit velocity of 91.5 MPH. Yes, he started to hit the ball harder than he has in years past. In a National League without a clear-cut MVP candidate, I’d think Carpenter will receive plenty of attention. Honestly, he should.

Concerning xwOBA and wOBA, Carpenter went from underperforming to performing closer to what the batted ball data would suggest. In fact, he is now exceeding his expected numbers.

Table 4. xwOBA/wOBA since May 16th

xwOBA      wOBA
.453            .475

Carpenter has also found a way to excel against, or least mitigate, the shift throughout the summer months. For example, his wOBA against the shift was a measly .243 with a .356 xwOBA through May 15th.

Screen Shot 2018-08-10 at 5.15.43 PM

Since May 16th, he has posted a .467 wOBA with a .445 xwOBA against an infield shift.

Screen Shot 2018-08-10 at 5.15.18 PM

If you examine his batted ball data, it is clear that Carpenter has started hitting more fly balls and pulling the ball as the season has progressed.

Table 5. Monthly FB%, Pull%, Cent%, Oppo% – 2018

Monthly       FB%       Pull%       Cent%       Oppo% 
Mar/Apr       44.1%    45.0%       33.3%       21.7%
May               50.8%    47.7%       26.2%       26.2%
June              45.1%     40.9%      36.6%       22.5%
July               49.3%     52.0%      24.0%       24.0%
August          56.0%     64.0%      20.0%       16.0%

Carpenter adjusted to what the defense was giving him. The shift worked for a short while then he essentially shifted where he hit the ball. That’s awfully impressive. In turn, he now has a .401 wOBA against the shift for the entire season. His .320 isolated power would easily be a career-best and has already posted 4.9 wins above replacement with 46 games to go in the regular season for the Cardinals. His results could be a reason to point out why hitters can conquer the shift, yet it remains a difficult task actually to accomplish. Thanks to this adjustment at the plate, Carpenter has made a sudden U-turn into baseball’s best hitter since mid-May.

**Statistics and information as of August 10th, 2018, and courtesy of FanGraphs and Baseball Savant**


Marcell Ozuna has Changed, Again

Writing about Marcell Ozuna has become a sort of an annual early-summer tradition. Back in 2016 on May 20th, Craig Edwards wondered if Marcell Ozuna, then 25 years old, was breaking out. That hot streak didn’t last, as Ozuna saw his 132 wRC+ pre-Edwards article drop to 97 post-Edwards article.

Just over a year later in June of 2017, Craig revisited another Ozuna hot streak. That one lasted the rest of the season, and qualified as a breakout in most minds.

Now, nearly a year after that second article, some things have changed. Ozuna is no longer a Marlin. He’s a Cardinal! He’s the Cardinals cleanup hitter. And, through May 20th, Ozuna has been the St. Louis Cardinals worst hitter.

What?

Among the twelve Cardinals with at least 25 plate appearances so far, Ozuna’s 63 wRC+ ranks twelfth. Last. Worse than Matt Carpenter, whose recent hot streak lifted his mark from 60 to 89. Worse than Dexter Fowler. Worse than Francisco Pena. Last. Dead last.

Compounding the issue, or at least the prevalence of the issue, is that every single one of Ozuna’s plate appearances have come from the cleanup spot in the batting order. Individually, he’s been the second-worst cleanup hitter with at least 75 plate appearances in that spot. He’s dragged the Cardinals as a team down to the third-worst cleanup hitter production.

Of course, we know players go through slumps. Early season slumps tend to stick in our heads more because they’re more noticeable. Even still, this has been Ozuna’s third-worst slump of his career. He’s only had a powerless stretch this long once before. And yet, it doesn’t appear that the Cardinals have an alternative for his lineup spot.  Ozuna is, or was supposed to be, the Big Bat.

On the surface, it seems like there’s hope for a bounce back. While I haven’t been as adamant as I was for Carpenter, I’ve noticed plenty of bad luck plaguing the St. Louis slugger.

According to Baseball Savant, his average exit velocity is at a personal Statcast-era best of 92.6 mph, up nearly 2 mph over last year and in the top 30 across the MLB. His average launch angle is up a half degree from last year and in line with his career norms. And with the tenth worst gap between his expected wOBA and actual wOBA so far, we can attribute much of his slump to luck.

Luck doesn’t explain all of the difference between this year and last, though. Even if Ozuna’s actual wOBA was in line with his expected, he’d own a .339 wOBA and a wRC+ similar to that of Harrison Bader. Don’t get me wrong, a wRC+ around 115 is good – it’s 15% better than league average – but it’s not what we wanted from the Cardinals biggest offseason acquisition and it’s not what we expected from a guy who just least season broke out to mash 37 home runs while hitting .312 en route to a career best 142 wRC+.

Two paragraphs ago, I cited Ozuna’s average exit velocity and average launch angle. In my opinion, that’s the most common fallacy in the widespread use of Statcast data. Neither of those metrics are best thought of as averages. Ozuna’s average exit velocity is up, but what if he’s hitting every ball 92 mph or one ball 112 mph and another 72 mph? What if he’s hitting them into the ground where that exit velocity will do less damage?

To answer that, I compared Ozuna’s average exit velocity on line drives and fly balls to his exit velocity on grounders over the last three years. To tease out some luck, good or bad, impacting his production, I used expected wOBA instead of actual wOBA.

Image and video hosting by TinyPic

In 2016, Marcell Ozuna hit his line drives and fly balls only 2 mph harder than his grounders. In 2017, he sacrificed exit velocity on his ground balls to increase his exit velocity on line drives and fly balls. So far in 2018, he’s back to a near-even exit velocity between his grounders and line drives or flies.

Sometimes a gain in air ball exit velocity at the expense of ground ball exit velocity is indicative of an uppercut. Sometimes it might indicate a player has lowered their hands. Maybe they’re selecting better pitches to drive. Usually, it means a player’s swing is directed more ‘upward’ than it used to be.

On the other hand, when a player gains ground ball velocity as the expense of air ball velocity, the opposite is likely true. A swing that’s flatter or on a more downward plane will generate harder hit ground balls at the expense of harder hit line drives and fly balls.

Going off the above, it looks like Ozuna had a downward swing in 2016. It looks like he had a more upward swing in 2017. Now, it looks like Ozuna is back to a downward swing.

I went to the video room to see if I could identify any difference between Ozuna’s swing this year and last. While I couldn’t find anything noticeably different in the swing, there are significant differences in his set up and trigger. I’m going to show you two pitches. He didn’t swing at either. There are still big differences.

First, a take from 2018:

Next, one from 2017:

And here’s a still side-by-side of his stance, below.

Image and video hosting by TinyPic

Don’t make anything of the bat placement. He moves it around, and I didn’t take care to match that up. But look at his feet. His back foot is a little closer to the plate and his front foot is a little more towards third base. I don’t know how much of a difference that makes, and whether it’s good or bad. But it’s different.

Then there’s this:

Image and video hosting by TinyPic

Now that’s something. Ozuna has a toe tap. He had a toe tap last year, and he had one the year before that. Last year, after tapping his toe, his stance was slightly closed. This year, it’s dead straight. Last year, he had a bend in both legs during his tap. This year, his front leg is straight. Last year, his butt looks a little lower than this it does this year – he used to attack the ball from a slightly lower position. All together, in 2017,  Ozuna looked more like a tightly coiled spring. He was in a more powerful and explosive position.

Next, compare his 2016 toe tap (far right), when his air ball / ground ball exit velocity splits were nearly identical to what we’ve seen so far in 2018.

Image and video hosting by TinyPic

It’s not identical, but it’s really close. In 2016, Ozuna used a stiffer front leg. It looks like 2018 Ozuna, following his monster 2017 season, has gone back to his 2016, pre-breakout toe tap.

The obvious follow-up question: why? Why change what wasn’t broken? It hasn’t helped his plate discipline. It hasn’t improved his contact quality. It’s made him, essentially, the same hitter he was back in 2016. Was it a coach’s decision? Ozuna’s? An accident? In any case, despite breaking out in 2017, Marcell Ozuna isn’t the same hitter he was a year ago.

The St. Louis Cardinals, riddled thus far with injuries, are desperate for someone to step-up offensively.  They might start by taking a closer look at his toe tap.


The St. Louis Cardinals Have a Type

This series will cover various trends I’ve observed major-league baseball teams following. Some trends will be analytical while others will be more…”conceptual.” Trends may span a season, or even several, it doesn’t matter, I don’t want to limit myself out of the box. Ideally, I’d like to cover all 30 teams, but I also don’t want to expect too much of myself out of the box, either. After all, I don’t have Francisco Lindor’s smile to pull it off.

Image result for francisco lindor trips on bat gif

Maybe that kind of thinking is limiting — not the part about Lindor’s smile (though in a weird way it does tie in), but maybe I like to undertake something with the caveat that I might not follow through because of experience, mine or others (see Stevens, Sufjan — 50 states project). Or maybe I don’t want to underestimate the extent of my laziness. Or maybe I’m just a glass-half-empty kind of guy…

And maybe all of this relates to my face.

From Wikipedia: “Physiognomy is the assessment of a person’s character or personality from his or her outer appearance, especially the face.”

It’s no secret that we’re all judged on our outer appearance. Some studies have shown it even relates to how well we’re paid. A predisposition towards handsome exists in baseball, too. It’s in the old scouting maxim, “the good face,” which essentially is the baseball colloquialism for “hottie.” But it can also refer to the potential presence of naturally-elevated levels of testosterone, as a strong jaw and well-defined cheekbones are sometimes indicative of the hormone.

Hogwash! Right? Well, have you ever wondered what it would be like to look like Brad Pitt and thought about how differently people would react to you? Now, I’m not talking about a matter of right or wrong, but people would generally respond more positively to you, both socially and professionally, and that does have an impact on confidence, which plays a massive, albeit intangible role in a baseball player’s on-field success.

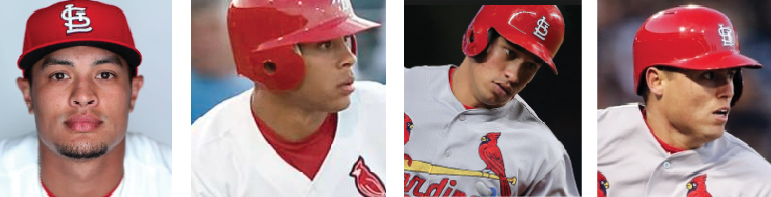
But, come on. With all the advanced methodology we have to evaluate players, isn’t the “The Good Face” adage a thing of the past? I’m sure it’s probably lost some of its weight in the player-evaluation process, but it hasn’t disappeared. In fact, in the evaluation process used by (arguably) the most successful team of this decade, it’s very much alive. In recent memory, there have been enough handsome doppelgangers in their mix to wonder if the “Cardinal way” isn’t some iron-clad philosophy the organization established to allow them to get the most out of their young players, but that it might just be a certain type of guy!

You’re at FanGraphs, and so I assume you’re a savvy individual and that you know a ruse when you read one, but I want to qualify this writing by saying that this proposition is roughly ~0.0000000000000001% serious. Okay, so essentially, there are six archetypes for Cardinals players’ faces.

  1. The Wain-Os

oval

Pseudoscience says: “If you have an oval face shape, you always know the right things to say.”
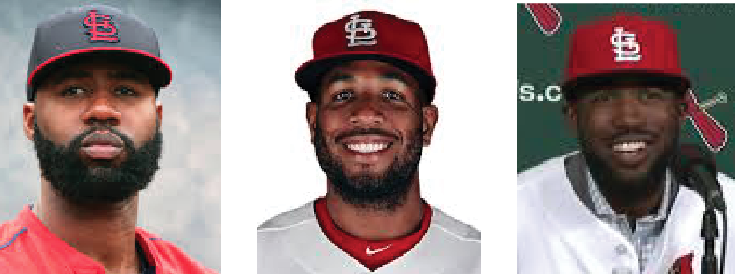
wain0

2. The Kozmakazies

square

Pseudoscience says: “If you have a square-shaped face, you are gung-ho and a total go-getter.”
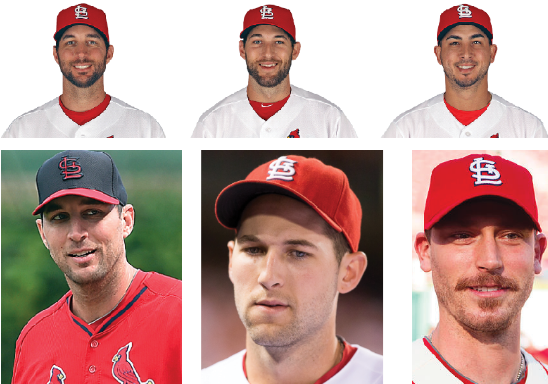
squaress

3. The DesCarpenSons

rectang

Pseudoscience says: “You value logic and you’re a really good thinker. Plus, you’re an awesome planner.”

4. The Lynnburger

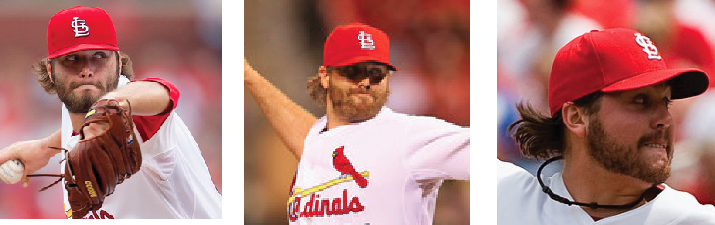
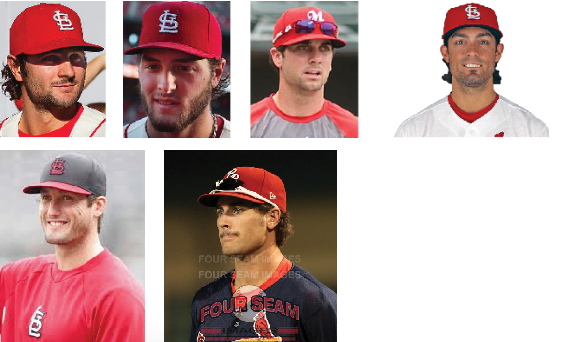
heart

5. The Ambiguous Pham

ambig

Pseudoscience says: “If you have a diamond face shape, you’re a control freak. You’re very detail-oriented…”
6. We Don’t Want No Scruggs

oblon

Pseudoscience says: See the Wain-Os

Yes, it helps they’re in the same uniform, and yes, I very obviously cherry-picked some of those, but aren’t you still a little floored? The variation here rivals the lack of distinguishability featured among the male contestants on the Bachelorette.

So isn’t this proof of old-school scouting at work? What gives with all the talk of the Cardinals’ cutting-edge front office — are they just masquerading with the hiring of NASA data analysts and organizational philosophies? Or have they truly married the new school and old school? Maybe there is something to building a roster of similar-looking players that prevents “fault lines” from forming.

Or maybe…

Think back to the hacking scandal of 2015. The Cardinals’ new Director of Scouting, Christopher Correa, hacked the Astros’ database for information on players regarding the draft, bonuses, and trade talks. Keep in mind, he was working for the Cardinals, not a brand-new expansion team; he could’ve hired anyone he wanted to work for him. He could’ve had his own NASA data analyst, just like Jeff Luhnow had done before him. I know that in the minds of these men, there’s a lot at stake, and so they look for any competitive advantage they can, but this scenario feels like it’s the smartest kid in class copying off the other smartest kid in class on a math test.

So what did Jeff Luhnow have access to that Correa didn’t?!

It was one file, actually. A file buried deep within the infrastructure of the Astros’ database. A file called “Stardust” (Yes, like in Rogue One). Allow me to explain.

This is daughter Luhnow. Her name and age are unknown (Jeff did not respond to my tweets), but my wife estimates her to be 19 in this photo. If we work off that number, she’s at least 20 now, and that means she’s probably been able to identify boys she thinks are cute for around 15 years, which lines up perfectly with when her dad was hired by the Cardinals in 2003.

Imagine it, “it’s easy if you try;” one day, a five-year-old daughter Luhnow wandered into her dad’s office and climbed up onto his lap while he was looking at some files of some players he was targeting to acquire. Mostly just talking to himself, Jeff explained the pros and cons of each player to his daughter and showed her their pictures. When he got to a young pitcher in the Atlanta Braves’ farm system, she put her hands to her mouth and giggled. “What’s so funny?” Jeff asked his suddenly-bashful daughter. Her face was nuzzled in her dad’s chest, so the words were a bit muffled, but Jeff heard them clear as day. “He’s cute,” she responded.

It was a strange moment for Jeff — he wrestled back the protective instincts welling up inside him, but as he looked at the picture of the lanky, young right-handed pitcher, he realized that she wasn’t wrong. Adam Wainwright was handsome in an awkward, President’s son kind of way.
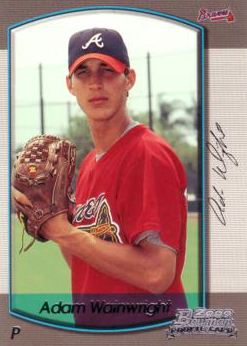
While this was the deciding factor for Jeff, he was thrilled that he wouldn’t have to admit that to his bosses, because Wainwright was also a top-100 prospect. So the Cardinals sent J.D. Drew and Eli Marrero to the Braves for Wainwright, Jason Marquis, and Ray King (an admittedly motley crew).

Jeff remembered that moment and would, from time to time, call his daughter into his office and gauge her reactions to the players he’d show her. Eventually, however, he didn’t need to call her in anymore. Daughter Luhnow liked baseball, and liked looking at the pictures of the young men; it was like reading a Teen Beat magazine with her dad!

Before I go any further, I want to note that this is one of those conceptual pieces I referred to in the intro, and that the parts about daughter Luhnow are entirely fictitious. There are also no underlying misogynistic themes at play here. I believe a woman could run a major-league baseball team as well as any man — I just think the idea of a team as renowned and successful as the Cardinals being run on the lustful whims of a teenage girl is really funny.

So the way I see it, she had her own Excel spreadsheet where she could rate the features of potential acquisitions on the same 20 – 80 scale as scouts. She could comb through high-school, college, minor-league, and major-league rosters and highlight her favorite guys by coming up with an overall score.

This authoritative list, while completely undisclosed until now, has unwittingly been at the center of a couple of controversies. It is what ultimately drove the wedge between Walt Jocketty and the Cardinals, and also, as previously mentioned, is the holy grail that Christopher Correa was in search of when he hacked the Astros’ database — and what he is currently serving a 46-month jail sentence for.

About the moves that Correa made without the elusive “Stardust” file. He had an idea of her type of guy based on previous transactions, and he was able to make some quality, daughter-Luhnow-inspired acquisitions. Of course, that’s hardly a silver lining. Try explaining to your cell mate that you’re in prison for hacking into someone else’s computer for a list of cute, young men (some of which are still in high school!).

You get it. You’re on board. The Cardinals’ success has largely been driven by a teenager’s romantic fantasies. Okay, maybe not. Regardless, I still have a hard time telling the difference between Adam Wainwright and Michael Wacha and I want to see if you are any better. Here are eight pictures of the two Cardinal pitchers, four of each; in the comments section, please attempt to sequence these correctly, and that’s it. This is what happens in the doldrums of the offseason!
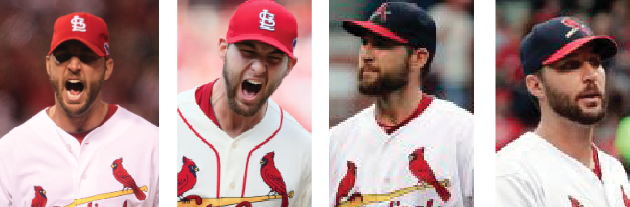
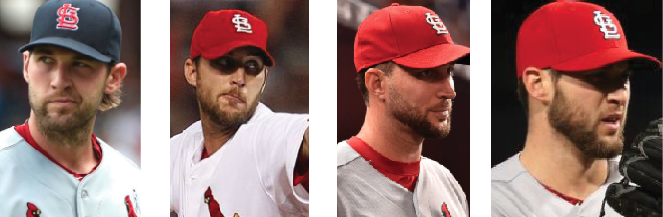
answer-key


Where is Matt Carpenter and What Have You Done With Him?

A few days ago, I tweeted out some data that I had parsed from Baseball Savant after I decided to see who had seen the most pitches outside of the strike zone get called strikes.  I found the leader of that unfortunate group to be none other than St. Louis Cardinals’ 2B/3B Matt Carpenter. After a sizable amount of interest in that tweet, I decided to look into Carpenter’s numbers a bit further to see if it had anything to do with Carpenter’s decline this year.

As of May 20th, Carpenter has been the victim of 81 pitches out of the zone that have been called strikes — a ratio of about 9.6% of pitches thrown. Next on that list is former Cincinnati Reds outfielder Shin-Soo Choo, hoodwinked 67 times (9.3%). However, two other hitters are seeing a slightly higher ratio of strikes out of the zone — Boston Red Sox outfielder Jackie Bradley, Jr. (9.9%) and Washington Nationals infielder Adam LaRoche (9.8%). Both of the aforementioned hitters have about 150 less plate appearances than Carpenter.

Could this honestly be the explanation as to why Cardinal Nation’s breakout star of 2013 isn’t anywhere near as good as he has been in the previous two seasons? To take it a step further, should we assume that there is a major umpiring conspiracy against Carpenter?

Not exactly.

I looked into this data further and I found that since 2008 (minimum 5000 pitches), there are thirty-eight other hitters within two percentage points of Carpenter’s current rate of 9.6%. The leader of that group is Oakland Athletics catcher John Jaso, who has faced 5731 pitches of which 546 were out of the zone and called strikes (9.5%). The miserable hitter who has fallen prey to the fallible umpire eye 1,324 times — the most in that time span — is Baltimore Orioles outfielder Nick Markakis (8.2%).

So let’s look a little closer at what’s going on with Carpenter in 2014. His BABIP sits at .331, well above the league average but nothing to get excited about because his career average is .348 — which can be considered stabilized after 1,100-plus at-bats. His batting average is currently .265; again, above the league average but well below his career mark of .300. Carpenter still manages to get on base consistently (.371 OBP) and his walk rate is actually three percent higher than his norm of 10.8%. Most importantly, he has yet to hit an infield fly; an indication that he’s making good contact and swinging the bat well.

Are pitchers attacking him differently? The answer again is no because there seems to be no variance in the types of pitches he’s seeing in 2014 compared to previous seasons.

Plate discipline would be the next logical place to go. Here, I’ve spotted something interesting — a Z-Swing rate of just over 50%. Only swinging at half the pitches he sees in the strike zone? Is this indicative of a lack of confidence? That kind of swing rate is bound to get a few extra ‘phantom’ strikes called on you. The league average swings in the zone for 2014 is a much higher 64.9%; Carpenter’s career ratio is 57.3%.

Has he lost his eye? His O-Swing rate is actually lower this year (along with his overall swing rate). He apparently wants to take more pitches and it hasn’t effected his ability to get on base regularly; still sporting a well above-average OBP of .371.

So here’s the biggie — his contact rates. An astounding 95.1% of swings in the zone result in contact and his general contact rate hasn’t varied at all from the past three seasons. You can cancel those requests for an eye doctor visit now. Need more proof? His whiff rate is a minuscule 3.9%.

Obviously when Carpenter sees a pitch he likes, he hits it. The problem seems to be what happens when he does.

I mentioned before that his BABIP is fairly high (currently 39th overall in baseball) and that typically correlates with an elevated batting average. Not the case with Carpenter and here is an example of why. Line drives fall for hits much more than any other type of contact. So far, Carpenter has 23 line-outs this year, highest in the majors. For a guy who is known for his extra-base hits (55 doubles in 2013), he relies on those to fall for hits and they aren’t. His wOBA has taken a major hit for that, down to a pedestrian .319 so far.

I wish I could tell you that this research would involve some sort of diagnosis of Carpenter’s struggle; there is none. His walk rate is up a bit, but he is striking out more (18.8%) than his average ratio of 15.9%. It could simply be that he might not be as good as he’s advertised. It could simply be a down year. But let me leave you with a one last piece of data.

Carpenter is a career .264 hitter in March/April. His average elevates to .321 during the month of May. So far, his average this May has risen slightly but not significantly. Its possible he has a major hot streak simmering on the back burner.

For the sake of Cardinal Nation, I hope that one of the most dynamic players in the game starts to have a shift in hitting abilities sooner rather than later. He’s a fun hitter to watch.


Adam Wainwright’s Fastball

Adam Wainwright has a great curveball. It’s probably the best curveball in baseball. Look at the curveball leaderboard, and you’ll find that he’s on top by a wide margin. Of course, if you’ve seen Wainwright, even in GIF form, you don’t need those numbers to tell you that. You know it’s a nasty pitch.

But, the curveball has always been a great pitch for Wainwright. While Wainwright has posted a career-best 2.55 FIP and 2.80 xFIP in 2013, his curveball has a slightly lower swinging strike rate than it did in 2012. Also, the curve hasn’t produced as many groundballs. Wainwright was solid, but not spectacular in 2013.

So, how has Wainwright been so much more successful in 2013 than in 2012?

Perhaps the biggest factor is that Wainwright has utilized his four-seam fastball much more frequently in 2013, throwing it on over 20 percent of his pitches. Before 2012, Wainwright didn’t feature a four-seam fastball. Even in 2012, he threw the pitch very sparingly.

The four-seamer has been a very effective pitch for Wainwright in 2013. He’s throwing the pitch for a strike 71% of the time, a higher rate than the two-seamer or sinker, whose usage has been curtailed. This helped Wainwright get ahead, and according to StatCorner he threw more pitches ahead in the count than ever before. As a consequence, Wainwright had a career-best 3.7% walk rate in 2013. Entering 2013, his walk rate sat at 6.7%.

Furthermore, the four-seamer produced swings and misses. The pitch had a 7.6% whiff rate. The sinker’s best rate was 4.2%. By run value, Wainwright’s four-seamer was the 8th best in baseball in 2013. I know, pitches exist in the context of repertoires, but consider that Wainwright’s two-seamer had a run value on par with the two-seamer of Jeremy Bonderman. That should tell you that it wasn’t his most effective pitch.

Even with the increased usage of the four-seam fastball, Wainwright has not sacrificed his groundball rate. At 49.1%, it is nearly equal to his career rate of 49.4%.

He’s throwing the pitch harder than ever. Maybe it took Wainwright more than a year to fully recover from the Tommy John injury he suffered before the 2011 season. When he threw the four-seamer in 2012, it averaged less than 90 miles per hour.

During the playoffs, the four-seamer has averaged nearly 94 miles per hour. Maybe the guns are juiced up, or maybe adrenaline is kicking in, but the pitch is up almost two miles from the regular season. Whatever the case, Wainwright is relying on his four-seamer even more during the playoffs. He’s thrown 23 innings, and surrendered only four runs, with 20 strikeouts and just a lone walk.

At age 32, and after throwing more than 240 innings during the regular season, Wainwright is looking stronger than ever. The addition of his four-seam fastball is proof that you can teach an old dog new tricks. Kudos to Cardinals pitching coach Derek Lilliquist and Wainwright for making the adjustment.


John Axford: the Cardinals’ newest reclamation project

On Friday the Cardinals acquired Brewers reliever John Axford for a player to be named later. While dominant in 2010 and 2011, Axford’s lackluster performance since 2012 has many Cardinals fans uninspired by the move. In fact, most of the media attention has centered around his public farewell to Milwaukee fans.

Bernie Miklasz of the St. Louis Post-Dispatch offered his own analysis of the deal, calling it a “smart gamble” for the Cardinals. In addition to acknowledging Axford’s well documented HR/FB% struggles, Miklasz highlighted that the former closer has been particularly challenged by an ineffective fastball and poor performance in high-leverage situations.

PITCHf/x data on Axford’s fastball:

Year

Pitches

LD%

OPS

wOBA

2011

838

18.0%

.670

.300

2012

1018

24.1%

.844

.360

2013

636

31.9%

.835

.367

Axford’s performance in high-leverage situations:

Year

IP

LD%

OPS

wOBA

2011

30.1

7.2%

.427

.202

2012

26.2

28.1%

.772

.336

2013

11.1

28.6%

1.094

.450

FanGraphs readers will know that Cardinals GM John Mozeliak and his organization’s pitching staff have developed a reputation in recent years for quietly acquiring mediocre pitchers and helping them reach previously unimagined levels of success on the mound. To the extent that Mozeliak and company have similar designs for Axford, one must ask how they plan to help him reclaim his once dominant form.

The Cardinals may suggest any number of tweaks to Axford’s approach, but smart money has them coaching him to focus on throwing more first-pitch strikes. Jeff Sullivan recently reminded us of the importance of pitching ahead, and its import is surely not lost on manager Mike Matheny and pitching coach Derek Lilliquist. Since 2012, Redbird pitchers rank tops in the majors in terms of throwing first-pitch strikes.

Team

IP

F-Strike%

Reds

2682.1

62.4%

Cardinals

2670

62.4%

Yankees

2649.2

62.4%

Phillies

2663.1

62.3%

Braves

2659

62.2%

Diamondbacks

2674.1

61.8%

Rays

2657.2

60.7%

Tigers

2661

60.7%

Rangers

2656.1

60.7%

Pirates

2665

60.6%

In the same piece, Sullivan also noted that since arriving in St. Louis in July 2012, Edward Mujica has established himself as the league leader in first-pitch strikes, increasing that figure from a pedestrian 60.9% in 2011 to an elite 75.6% in 2013. Doing so has no doubt played a large part in his improved performance in high-leverage innings.

Mujica in 2011 with the Marlins:

Split

IP

OPS

wOBA

Low Leverage

31.1

0.556

0.242

Medium Leverage

29.2

0.656

0.284

High Leverage

15.0

0.781

0.325

Mujica in 2013 with the Cardinals:

Split

IP

OPS

wOBA

Low Leverage

20.2

0.561

0.244

Medium Leverage

16.2

0.518

0.222

High Leverage

20.0

0.529

0.234

While Mujica’s 2011 performance in high-leverage situations was not nearly as poor as Axford’s has been in 2012 and 2013, there exists a similar opportunity for improvement.

Specifically, Axford is getting absolutely crushed when behind in the count this season.

Axford’s 2013 pitching splits:

Split

IP

OPS

wOBA

Through 3 – 0

1.2

0.855

0.440

Through 3 – 1

3.1

1.383

0.555

Through 3 – 2

8

0.948

0.409

Through 2 – 0

8

0.981

0.412

Through 1 – 0

24.1

0.960

0.410

As they did when acquiring Mujica last year, look for the Cardinals to initially deploy Axford into low-leverage situations in which he can regain his confidence and focus on getting ahead in the count. If successful, one would expect the club to move Axford into higher-leverage situations, particularly if Mujica or Trevor Rosenthal wears down or runs into trouble down the stretch.