Archive for San Diego Padres

Analysis and Projection for Eric Hosmer

Eric Hosmer is one of those guys you either love or hate. His career, which includes one World Series championship and two American League pennants, has been just as polarizing.

First, who Hosmer is. Consider his WAR each season since 2011:
1.0
-1.7
3.2
0.0
3.5
-0.1
4.1

Interesting pattern; let’s look into that. The chart below is Hosmer’s career plate discipline (bolded data are positive WAR seasons).

Nothing appears to be out of sorts, no obvious clues to suggest a divergent plate approach.

Moving on, I noticed his BB/K rate did relate to his productive seasons; that alone can’t possibly explain his offensive oscillations. While his strikeout and walk rates did vary, the differences were a matter of two or three percentage points, at best.

So, I decided to look at his batted ball contact trends and found that his line drive rate directly correlated with his higher WAR seasons; 22%, 24%, 22% in 2013, 2015, and 2017 respectively with 19%, 17%, 17% in 2012, 2014, and 2016 accordingly.

OK, so his launch angle must be skewed. But, like his plate discipline, no outliers were demonstrated; his 2017 season should be easy to pick out. The below animation is a glance at Hosmer’s three-year launch angle charts, in chronological order.


How about his defense? Well, something seems off about that, too.

He’s won a Gold Glove at first base four out of the last five years. He looks great on the field, but unfortunately, his defense reflects the same way as a skinny mirror; his UZR/150 sits at -4.1 and his defensive runs saved are -21. Since 2013 (the first year he won the award) he ranks 13th in DRS and 12th in UZR/150 out of all qualifying first basemen. So, middle of the pack basically but worth four gold gloves? Probably not.

As we could have surmised, he’s simply an inconsistent player. Falling to one side of the fence yet?

One thing is a certainty; his best season was, oddly enough, his walk year with the Kansas City Royals in 2017. Now, I’m not about to speculate that Hosmer played up his last year with the Royals to get a payday (which he most certainly got). Looking back at his WAR in the first part of the article, you can see his seasonal fluctuations suggest he was due for a good year.

Keeping with the wavering support of Hosmer, is the contract he acquired to play first base with the San Diego Padres. His eight-year deal (with an opt-out in year five), will net him $21 million each season. He will draw 25.8% of team payroll. When his option year arrives in 2022, he’s due for a pay cut of $13 million in the final three years.

A soundly contructeed contract as, according to Sportrac’s evaluation, his market value is set at $20.6 million a year. To note, the best first baseman in baseball, Joey Votto, signed a ten-year deal in 2015 for $225 million dollars (full no-trade clause). Starting in 2018, Votto is slated to make just $4 million more than Hosmer will in the early portion of his deal. Did San Diego overspend? It all depends on what their future plans are for him.

In any case, Hosmer will join a team that, following his arrival, is currently 24th in team payroll. In 2019, they will hop to 23rd. It could go down further upon the arrival of their handful of prospects who look to be the core of the team.

So who will the Padres have going forward? Using wOBA, probably the most encompassing offensive statistic, I decided to forecast what the coming years will look like for Hosmer. It goes without saying that defense is nearly impossible to project. So, for argument’s sake, we’ll continue to assume Hosmer will be an average defender at first.

Since Hosmer’s rookie year in 2011, the league average wOBA is approximately .315. Hosmer should stay above that through the majority of the contract. But, let’s be more accurate. Using both progressive linear and polynomial trend line data (based on both Hosmer’s past performance and league average wOBA by age), I was able to formulate a projection for Hosmer through age 35 (no, I’m not going to lay out any of my gory math details).

OK, I lied. Here is the equation I used to come to my prediction :

{\displaystyle y_{i}\,=\,\beta _{0}+\beta _{1}x_{i}+\beta _{2}x_{i}^{2}+\cdots +\beta _{m}x_{i}^{m}+\varepsilon _{i}\ (i=1,2,\dots ,n)}

From age 28 on is what we want to look on from. Hosmer is expected to take a dive offensively in 2019 with a bounce-back year in 2020, sticking with his past trends. A year before his opt-out clause (where he’s slated to make $13 million), his wOBA is expected to regress at a stable rate. He’ll continue to be league average or better during the twilight years of his career.

Prognosis

Hosmer seems to be appropriately compensated. You could argue that he’s making too much, but the Padres had the money to give him and they are banking on Hosmer to be highly productive at Petco. But, chances are (according to his history), he won’t maintain (or exceed) his 4.1WAR in 2018. He’ll be labeled as a bust but ought to have a few good years in him during the $21 million salary period. And, as my forecast chart shows, his 2022 pay cut comes at just the right time.

*This posts and more like it can be found over at The Junkball Daily


Jonathan Lucroy, the Rockie, Is Baseball’s Best Contact Hitter

It’s no secret that Jonathan Lucroy is having a subpar season.

The two-time NL All Star was projected to be a top-three catcher in 2017.  Before the start of the season, Steamer pegged his value at 3.6 wins above replacement, while ZiPS had him at 3.2.  His .242/.297/.338 line and 66 wRC+ in 306 plate appearances as a member of the Texas Rangers produced 0.2 WAR.  No one really expected that.

Lucroy was eventually traded to the Colorado Rockies.  The Rockies, who had the worst catching tandem in baseball, instantly viewed Lucroy as an upgrade, while many other playoff-bound teams would have viewed him as a liability.  With the hitter-friendly environment of Coors Field and poor pitching staffs among the San Francisco Giants and San Diego Padres, the team figured that Lucroy would return to his All-Star form once again.  Although he has not returned to being the power threat that he once was, he has changed his game ever so slightly, such that he might have become the game’s best-hitting catcher.

His basic stat line is not reflective of his plate discipline as a member of the Rockies.  His slash line has gone back up to near his career average (.279/.384/.377), but what is most impressive about him is his actual hitting ability.  Always a good contact hitter, he has changed his game to be more selective, get more contact, and put the ball in play.  His 92 percent contact percentage ranks first in baseball since the trade, and his 88 percent contact percentage of pitches outside the strike zone also ranks first.  The result: a high walk rate (12.3 percent) and fewer swinging strikeouts (6.3 percent of plate appearances resulting in a strikeout).  All of this while swinging at fewer pitches outside the strike zone (18.6 percent) and fewer swings in general (38 percent).  You may be asking “Why isn’t he leading the league in hitting with numbers like that?”  Well, the answer is rather simple.

While he is making more contact than anyone in baseball, most of the balls in play are hit to the defense.  This season, he is hitting more ground balls than ever before.  As a Rockie, 50 percent of the balls he has hit in play have been ground balls, well above his career average of 42.8 percent.  As a result, he has hit fewer fly balls (28.7 percent) which has led to fewer home runs (3.2 percent HR/FB).  This explains his lack of power this year.

He has hit the ball in the wrong place more this season than any other.  For his career, Lucroy has had a tendency to drive the ball up the middle — that has not changed much this season — but this season he has hit the ball softer than in any previous season.  His average exit velocity (85.0 miles per hour) is more in line with middle infielders and outfielders than catchers.  In fact, he has the fourth-slowest average exit velocity among all qualified catchers.  His average exit velocity last season was 87.6 miles per hour, and it was 88.6 in 2015.  Without the wheels of a speedy outfielder or infielder capable of beating out a ground ball (or at the very least forcing the defense to rush the throw), a ground ball for Lucroy is as good as an out.  Just as the saying “baseball is a game of inches,” it’s a game of miles per hour, too.

Fewer ground balls are going through the holes in the infield, and fewer ground balls are becoming hits.  His batting average of balls in play as a Rockie is similar to his career average (.308 as a Rockie and .306 for his career), but his RBBIP — percentage of balls in play that go for a hit or an error — is .318.  While it is above league average, it is well below his RBBIP numbers of both his All Star seasons and 2012, when he hit .320.  Has Lucroy been entirely unlucky with his balls in play?  No; pitchers have pitched to him largely down and away, which has resulted in a horrible contact percentage on those pitches, and he has also regressed slightly in every season since 2015.  But if Lucroy can keep his contact percentage up, hit fewer ground balls, and stay selective at the plate, then he could be one of the best-hitting catchers in the game again.


Reliever Buy-Low: Craig Stammen

Any team need a reliever who can pitch multiple-inning stints if you need? I think lots of teams would jump at the chance to acquire such a reliever considering Madison Bumgarner’s legendary five-inning relief appearance in Game 7 of the 2014 World Series. Andrew Miller became a dangerous bullpen weapon in the 2016 postseason with the Indians, which brought them within a game of winning the World Series in three consecutive games. And there’s some guy on the Astros called Chris Devenski, who could also spot start if you need a starter desperately. The Blue Jays acquired Tom Koehler from the Marlins, who I admittedly have some interest in as a starter or multi-inning reliever. Maybe you want someone like Raisel Iglesias or Michael Lorenzen.

Currently, most relievers are used in one-inning stints; some are even used against lefties or righties only. Christian Bethancourt, Chris Gimenez, and Jordan Schafer have been two-way players: a hitter and a reliever to give more bench depth and help keep Rule 5 draft picks. Some top prospects have been billed as two-way players such as Brandon McKay, Hunter Greene and most notably Shohei Otani, who has been fantastic in Japan.

The reliever who should be receiving more attention as a multiple-inning reliever is Craig Stammen, who used to be a part of the Nationals as a starter and was then converted into a reliever when he was called up from AAA in 2011. Stammen was doing pretty well from 2012-2014 as a setup reliever, but then he missed most of 2015 and didn’t make it back to the big leagues until this season. As a result of him previously having been a starter for much longer, he has more stamina than an average reliever, and can be used in multiple-inning relief stints, providing more bench depth for a team like the effect of having a two-way player (even if they aren’t very good).

This year, he has been getting back to what he was doing before in terms of his ERA, strikeout and walk rates, and innings per appearance. His home-runs, however, have gone up quite a bit despite his 52.2% ground-ball rate. This is due to an unsustainable 19.4% HR/FB ratio(!), which has overly inflated his FIP to 4.34, with a much more appealing 3.75 xFIP and a 3.60 SIERA, which suggest a solid middle relief/ setup type of reliever that he has been performing like. This and his ability to pitch multiple-inning stints create a higher value than his $900,000 contract. He has four pitches with positive values according to Pitch Info this year. Despite minute velocity drops for his pitches from his peak years of 2012-2014, he is still very effective with his pitches, with only one registering a slight negative according to Pitch Info.

Admittedly, his BABIP is a bit lower than it should be at .254, but it shouldn’t regress too badly (somewhere around .280 since he does generate quite a few ground balls). He is only getting about 6.7% pop-ups, which is not very good, compared to his peak seasons. Batters are getting more hard contact this year compared to the rest of his career (30.1% this year compared to 28.5% for his career). And his strand rate is at 85.7% this year, compared to just a 71.9% career mark. Additionally, he has allowed a .329 wOBA against lefties this year vs a .256 wOBA vs righties.

Overall, Stammen has been lucky and unlucky this year. Ultimately, he is a solid reliever who should be able to do quite well in almost any park except Coors Field or any extreme hitters park. He should receive a two-year deal worth around $4-5 million per year for how well he can pitch as a solid multiple-inning reliever, and how he can help increase bench depth for a team that wants to keep a Rule 5 talent, an extra bench player, a normal reliever, or maybe a specialized reliever such as a LOOGY (looking at you, Randy Choate, Brian Shouse, and so many more who have made careers out of being LOOGYs). The former two are much more likely than the latter two — particularly a LOOGY, as most aren’t as useful to teams anymore.

All stats and links are owned by FanGraphs, except for the link to Shohei Otani’s player page, which is owned by the NPB.


A Quick and Dirty Attempt to Find Justin Upton’s Trade Value

Players like Justin Upton aren’t usually available at the trade deadline. Upton ranks 35th in wOBA (.353) and 47th in WAR (8.9) between 2013 to the present.  Also of note, Upton is in his walk year.

So, how many players like Justin Upton have been traded in the past 10 years? I did a quick scan of deals made in June and July since 2005 and I found four similar players who were traded in their walk years.

1. Hunter Pence PHI->SF, 2012 (68th wOBA (.347) and 68th WAR (8.7), 2010-2012)

2. Carlos Beltran NYM->SF, 2011 (19th wOBA (.379) and 74th WAR (8.1), 2009-2011)

3. Matt Holiday OAK->STL, 2009 (4th wOBA (.410) and 6th WAR (18.2), 2007-2009)

4. Mark Teixiera ATL -> LAA (15th wOBA (.396), 17th WAR (14.8), 2006-2008)

The Mets received Zack Wheeler in return for Beltran and the Athletics received Brett Wallace in return for Holliday. Baseball America ranked Wheeler the 55th best prospect pre-2011 and Wallace was ranked 40th pre-2009. In the following years, pre-2012 and pre-2010, respectively, Wheeler was ranked 35th and Wallace was ranked 27th.

The Mets and Athletics did well in each trade. They received top prospects and non-deteriorating prospects (they were not losing value as prospects during the year they were traded for). This is evidenced by the ranking of Wheeler and Wallace in the season following the trade.

The Pence and Teixiera trades did not net the Phillies or Braves prospects. Each team received a major league asset, using “asset” in the loosest of ways.

The Phillies received Nate Schierholtz, who had totaled .9 WAR up to that point in 2012. They also received Seth Rosin, an A Ball pitcher, and Tommy Joseph, a AA catcher. Essentially, they received a replacement level player and organizational depth. 

The Braves received Casey Kotchman. Kotchman had totaled 2.1 WAR in 2008 with the Angels before the trade. He managed 3.7 WAR the year before. The Braves could not expect Kotchman to live up to his past billing (he was Baseball America’s 6th ranked prospect pre-2005), however, from the most optimistic perspective, they may have expected him to be worth 2 WAR per year over the remaining four years of team control. At least this is my best attempt to get in the head of the Braves’ front office seven years after the fact.

Now, I’ll attempt to determine Justin Upton’s trade value based upon these past trades.

Kevin Creagh and Steve DiMiceli published a study on Point of Pittsburgh that analyzed the value and future performance of prospects based on their ranking in the Baseball America’s Top 100 (the ranking was determined by the final appearance of the prospect in the rankings).  The article has a lot of information you should read regarding the dollar value of prospects and their potential to bust, but for purposes of this article, I am concerned with a prospect’s projected WAR over the six years of team control.

Hitters that rank between #26-50, which is Brett Wallace, project to have an average of 6.8 WAR. Pitchers ranked between #51-75 project to have 3.8 WAR. However, based on Wheeler’s fast rise up Baseball America’s list, I’ll factor in that pitchers ranked between #26-50 project to have 6.3 WAR. The average of the two is 5 WAR, which is the value I’ll place on Wheeler at the time the Mets traded for him.

Justin Upton is not Matt Holliday, circa 2009, and he is not quite Carlos Beltran, circa 2011, although he is much less of an injury risk than 2011 Beltran (who would go on to spend time on the DL for the Giants in 2011). Therefore, I project that the Padres should receive between 3.8-5.0 WAR in return for Upton. The return should scale up towards the higher side of that projection based upon an active and interested market for Upton.

Below is a list of potential Upton suitors and their prospects that appeared in Baseball America’s Top-100 rankings before the season began. The rank of the prospect is in parenthesis, followed by their Creagh and DiMiceli projected WAR. The prospects in bold represent the most likely return for Upton, however I included some prospects that are possibilities, but project to have more WAR value than should be expected in return for Upton.

Mets – Brandon Nimmo (45, 6.3), Dilson Herrera (46, 6.3), Amed Rosario (98, 4.1). I excluded Kevin Plawecki (63) and Michael Conforto (80) due to their major league role and rise to prominence, respectively. 

Pirates – Jameson Taillon (29, 6.3); Austin Meadows (41, 6.8); Josh Bell (64, 5); Reese McGuire (97, 4.1)

Cubs – C. J. Edwards (38, 6.3); Billy McKinney (83, 4.1)

Giants – Andrew Susac (88, 4.1)

Orioles – Dylan Bundy (48, 6.3); Hunter Harvey (68, 3.4)

Rays – Daniel Robertson (66, 5); Willy Adames (84, 4.1)

Royals – Raul Mondesi (28, 6.8), Brandon Finnegan (55, 3.4), Kyle Zimmer (75, 3.4), Sean Manaea (81, 3.5)

Twins – Jose Berrios (36, 6.3); Nick Gordon (61, 5); Alex Meyer (62, 3.4)

Astros – Mark Appel (31, 6.3)

A.J. Preller should feel (somewhat) vindicated regarding the Justin Upton portion of his winter experiment if he can get a player he likes that resembles the players on this list. However, it remains to be seen if he will chase after something safer, like the Braves in 2008, or squander an asset like the Phillies in 2012. In that case, he’s probably better off going all-in on the Padres he built for 2015.


Who Won the Kimbrel Trade?

Wow. Craig Kimbrel traded right before the start of the season. I have to admit to being rather shocked. I know the Braves are rebuilding this off-season and it made sense to trade him. He is very highly valued for a player who only pitches 60 innings a season, perhaps over-valued. If the Braves are going to be hopeless this year then who needs a dominant single-inning pitcher?

The trouble is I love watching Kimbrel pitch, no matter the situation. I live in London, in the UK, so a lot of Braves games happen from 1-4am and I don’t get to watch them live. Every morning I use my MLB.com subscription to check the last night’s action. If I don’t have the time to watch the whole game, which is common, I skip to the innings where the Braves scored plus any inning Kimbrel pitches. Pace, a banana curveball and strikeouts, Kimbrel is one of those rare players who is worth watching every minute he plays. Even when he is (rarely) hit you feel a strikeout is coming next. So emotionally, I hate to see him traded (just like I hated seeing Heyward traded). Lots of reporters are saying the trade is a good deal for both sides or an outright win for the Braves, so in emotional despair, I thought I’d have a proper look into it.

The facts of the trade

To the San Diego Padres:

  • Craig Kimbrel – 3 years at $34.75m (includes option buyout) or 4 years at $46.75m
  • Melvin Upton Jr – 3 years at $48.15m

To the Atlanta Braves:

  • Carlos Quentin – 1 year at $11m (includes option buyout) or 2 years at $18m
  • Cameron Maybin – 2 years at $16.2m (includes option buyout) or 3 years at $24.2m
  • 2 prospects and 41st pick 2015 draft

N.B. Bold text highlights the likely choices.

I’ll not be analysing the prospects in much detail, instead ignoring the less relevant trade pieces and looking at the end outcomes. My method is below, but if you like, skip to the summary, that’s the important bit.

Methods

From the Padres POV

  • Upton not wanted/needed. Treat him as a league-minimum replacement-level 5th outfielder for 3 years (cost $1.5m). Add the rest of his salary to the Kimbrel contract.
  • Dumped 2 unneeded players and $27.2m in contracts off the books. Remove these values as savings for the Kimbrel contract
  • Gained Craig Kimbrel. Assume option taken (it is great value – see later*). Contract for 4 years at $46.75m – $27.2m (from Quentin and Maybin savings) + $46.65m (Upton cost)
  • Given up 3 prospects (effectively); 1 good (Wisler), 1 risk (Paroubeck) and 1 draft pick

I feel these are all reasonable assumption/treatments. The Padres want Kimbrel, don’t care much about what they get from Upton (assuming he continues as in 2013-14) and used the Quentin and Maybin savings to pay for it all.

From the Braves POV

  • Quentin not wanted/needed (not sure why – seems a better bench bat than most and nobody will trade for him as they know they can get him for minimum once the Braves cut him). Add his contract to the 2015 payroll – $11m
  • Maybin – Assume continues poor health/form and option buyout is taken. Treat as decent defensive replacement OF (23 career DRS in 8 years). Possibly gets 75 games a season but produces nothing more than T.Cunningham in AAA so set effective salary to league minimum – $1m for 2 years. Add rest of his contract to 2015-16 payroll ($15.2m over 2 years)
  • Payroll changes:
    • Savings – Kimbrel ($46.75m – 4 years), Upton ($48.15m – 3 years)
    • Wastings – Quentin ($11m – 1 year), Maybin ($15.2m – 2 years) – both include buyouts
  • Receive 3 prospects (effectively); 1 good (Wisler), 1 risky (Paroubeck) and 1 draft pick

Again, I feel these assumptions/treatments are reasonable. Maybin may produce better than this, but his batting numbers were as bad as M. Upton the last few years (70-80 wRC+) so I don’t think we can expect much more of him than Melvin (apart from his defence being better).

Summary

Padres POV

  • Get Craig Kimbrel – effectively 4 years for $66.2m ($16.55m/year)
  • Get spare replacement-level 5th OF at minimum salary for 3 years
  • Lose 3 prospects; 1 good, 1 risky, 1 draft pick

Braves POV

  • Lose Kimbrel (and M.Upton)
  • Get spare replacement-level 4th OF at minimum salary for 2 years
  • Payroll savings $67.7m over 4 years ($16.9m/year average)
  • Get 3 prospects; 1 good, 1 risky, 1 draft pick

Analysis

Lots of contract money going back and forth, but the end result is that the Braves get payroll savings of around $17m a year for 4 years and 3 prospects and the Padres give up 3 prospects to get Kimbrel at a reasonable free agent price* of around $17m a year for 4 years.

If you consider that the Padres would have lost that 3rd prospect (the draft pick) if they signed Kimbrel as a free agent, the deal starts to look pretty good for San Diego and AJ Preller. The Padres almost certainly wouldn’t have been able to sign Kimbrel as a free agent with other teams competing (everyone needs a Kimbrel and the Dodgers/Yankees/Tigers/Red Sox etc all have the money for him). The contract would certainly have been longer as well (see footnote on Kimbrel’s historic value*). The Padres are paying Kimbrel a lot, but the amount is fair and they didn’t give up much.

The Braves had signed Kimbrel to a much friendlier contract than he would have got as a free agent (he’s homegrown and a Braves fan so gave a large discount – again see footnote*). Kimbrel gets $13m /year for his free-agent years, when he could have had much more. John Hart effectively used Kimbrel’s generosity to swap the spare value for 3 prospects, one of whom is extremely risky (Paroubeck) and one who is completely unknown (the draft pick). The Braves have rid themselves of Upton, but in taking back other contracts they have effectively only saved the money they should have been paying Kimbrel (had he not given a home discount).

In conclusion, John Hart basically declared he didn’t want a well-paid but high-value closer and swapped it for one good (but not great) prospect and two unknown prospects. So how do I feel now? I would have preferred to watch Kimbrel play for my team every week… Enjoy it San Diego.


*A footnote on Kimbrel’s free agent value

Craig Kimbrel is currently 26 years old and 10 months. Below is a summary list of contracts for comparable relievers and their ages when signing.

Reliever Contract Age at signing Average salary/year
David Robertson $46m – 4 years 29 $11.5m
Andrew Miller $36m – 4 years 29 $8.0m
Jonathan Papelbon $50m – 4 years 32 $12.5m
Koji Uehara $18m – 2 years 40 $9.0m
Joe Nathan $20m – 2 years 40 $10.0m
Mariano Rivera 38 $15.0m
Aroldis Chapman (arb2) $8m – 1 year 27
Greg Holland (arb2) $8.25m  – 1 year 29
Kenley Jansen (arb2) $7.425m – 1 year 27


You’ll notice that Kimbrel is younger than them all and although the average yearly value is not as high as Kimbrel’s $13.0m 2016 salary, the elite arbitration-eligible relievers are likely to beat them all (apart from maybe Rivera). If he were a free agent this last winter, you can assume that he would have been offered 5-year (and possibly longer) contracts.

Kimbrel’s career numbers are also historically unprecedented at his age. This has been said many times before, but my favourite Kimbrel stat is the WAR leaders for relievers over the last 10 years. Kimbrel has the 5th highest WAR from 2005-2014. He entered the league at the end of 2010. Since entering the league in 2010 he leads reliever WAR by 1.5 over Holland and Chapman (who have comparable service time). Before signing his (very team friendly) extension Matt Swartz estimated his first year of arbitration salary should be $10.2m. For a detailed analysis of how much Kimbrel is worth I recommend you read his article (http://bit.ly/1GEjKyT). The point being, he is probably worth at least a $17m/year, 4 year contract.


References

http://www.spotrac.com/mlb/san-diego-padres/melvin-upton/

http://www.spotrac.com/mlb/atlanta-braves/cameron-maybin/

http://www.spotrac.com/mlb/san-diego-padres/craig-kimbrel/

http://www.spotrac.com/mlb/atlanta-braves/carlos-quentin/

http://www.fangraphs.com/statss.aspx?playerid=5015&position=OF

http://www.fangraphs.com/statss.aspx?playerid=5223&position=OF

http://www.fangraphs.com/blogs/evaluating-the-prospects-san-diego-padres/

http://www.baseball-reference.com/players/r/riverma01.shtml

http://www.fangraphs.com/leaders.aspx?pos=all&stats=rel&lg=all&qual=y&type=8&season=2014&month=0&season1=2005&ind=0&team=0&rost=0&age=0&filter=&players=0

http://www.mlbtraderumors.com/2013/10/arbitration-breakdown-craig-kimbrel.html


The NL West: Time Zones, Ballparks, and Social Investing

I think the National League West is the most idiosyncratic division in baseball. Note that I avoided a more disparaging term, like odd or weird. That’s not what I’m trying to convey. It’s not wrong; it’s just…off. Not bad–it’s home to 60% of the last five World Champions, right?–but different. Let me count the ways. (I get three.)

Time zones

EAST COAST BIAS ALERT!

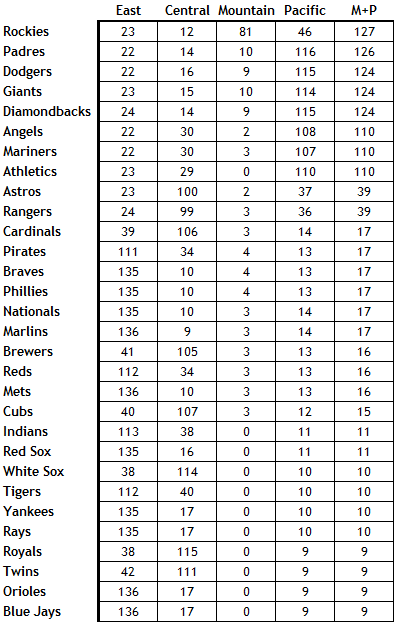
It is difficult for people in the Eastern time zone to keep track of the NL West. Granted, that’s not the division’s fault. But 47% of the US population lives in the Eastern time zone. Add the Central, and you’re up to about 80%. That means that NL West weeknight games generally begin around the time we start getting ready for bed, and their weekend afternoon games begin around the time we’re starting to get dinner ready. The Dodgers, Giants, and Padres come by it naturally–they’re in the Pacific time zone. The Diamondbacks and Rockies are in the Mountain zone, but Arizona is a conscientious objector to daylight savings time, presumably to avoid prolonging days when you can burn your feet by walking barefoot outdoors. So effectively, four teams are three hours behind the east coast and the other team, the Rockies, is two hours behind.

Here’s a list of the number of games, by team, in 2015 that will be played in each time zone, ranked by the number of games in the Mountain and Pacific zones, counting Arizona among the latter:

Again, I’m fully on board with the idea that this is a feature, not a bug. But it’s a feature that means that a majority, or at least a solid plurality, of the country won’t know, for the most part, what’s going on in with the National League West teams until they get up in the morning.

Ballparks

OK, everybody knows that the ball flies in Coors Field, transforming Jose Altuve to Hack Wilson. (Check it out–they’re both 5’6″.) And the vast outfield at Petco Park turns hits into outs, which is why you can pencil in James Shields to lead the majors in ERA this year. But the other ballparks are extreme as well: Chase Field is a hitter’s park; Dodger Stadium and AT&T Park are pitchers’ havens. The Bill James Handbook lists three-year park factors for a variety of outcomes. I calculated the standard deviations for several of these measures (all scaled with 100 equal to league average) for the ballparks in each division. The larger the standard deviation, the more the ballparks in the division play as extreme, in one direction or the other. The NL West’s standard deviations are uniformly among the largest. Here’s the list, with NL West in bold:

  • Batting average: NL West 10.1, AL West 7.2, AL Central 6.5, AL East 5.8, NL East 5.2, NL Central 1.6
  • Runs: NL West 26.5, NL Central 7.9, NL East 6.9, AL East 4.0, AL Central 2.8, AL West 2.7
  • Doubles: AL East 20.3, NL West 11.3, NL East 6.2, NL Central 5.9, AL Central 5.1, AL West 2.9
  • Triples: NL West 50.6, AL Central 49.5, NL East 33.6, AL West 28.3, AL East 27.8, NL Central 11.1
  • Home runs: NL Central 30.2, NL West 23.9, NL East 20.0, AL East 18.7, AL Central 11.3, AL West 11.2
  • Home runs – LHB: NL Central 31.6, AL East 27.4, NL West 25.6, NL East 21.7, AL West 14.7, AL Central 11.7
  • Home runs – RHB: NL Central 32.1, NL West 24.0, NL East 20.0, AL East 14.4, AL Central 13.6, AL West 10.2
  • Errors: AL East 17.7, NL West 12.2, NL Central 11.6, NL East 11.5, AL West 11.2, AL Central 8.2
  • Foul outs: AL West 36.2, AL East 18.3, NL West 16.0, NL Central 15.2, AL Central 13.8, NL East 6.2

No division in baseball features the extremes of the National League West. They ballparks are five fine places to watch a game, but their layouts and geography do make the division idiosyncratic.

Social Investing

You may be familiar with the concept of social investing. The idea is that when investing in stocks, one should choose companies that meet certain social criteria. Social investing is generally associated with left-of-center causes, but that’s not really accurate. There are liberal social investing funds that avoid firearms, tobacco, and fossil fuel producers and favor companies that offer workers various benefits. But there are also conservative social investing funds that don’t invest in companies involved in alcohol, gambling, pornography, and abortifacients. This isn’t a fringe investing theme: By one estimate, social investing in the US totaled $6.57 trillion at the beginning of 2014, a sum even larger than the payrolls of the Dodgers and Yankees combined.

Here’s the thing about social investing: You’re giving up returns in order to put your money where your conscience is. That’s OK, of course. The entire investing process, if you think about it, is sort of fraught. You’re taking your money and essentially betting on the future performance of a company about which you know very little. Trust me, I spent a career as a financial analyst: I don’t care how many meals you eat at Chipotle, or how many people you know at the Apple Genius Bar, you can’t possibly know as much about the company as a fund analyst who’s on a first-name basis with the CEO. So there’s no sense in making it even harder on yourself by, say, investing in the company guilty of gross negligence and willful misconduct in a major oil spill, if that’d bother you.

Note that I said that with social investing, you’re giving up returns. Some social investing proponents would disagree with me. They claim that by following certain principles that will eventually sway public opinion or markets or regulations, they’re investing in companies that’ll perform better in the long run. That’s a nice thought, but social investing has been around for decades, and we haven’t yet hit that elusive long run. The Domini 400 Index, which was started in 1990, is the oldest social investing index. It started well in the 1990s, but has lagged market averages in the 21st century. Now called the MSCI KLD 400 Social Index, it’s been beaten by the broad market in 10 of the past 14 years. It’s underperfomed over the past year, the past three years, the past five years, and the past ten years, as well as year-to-date in 2015. The differences aren’t huge, but they’re consistent. Maybe for-profit medicine in an aberration, but acting on that meant that you missed the performance of biotechnology stocks last year, when they were up 47.6% compared to an 11.4% increase for the S&P 500. Maybe we need to move toward a carbon-free future, but stocks of energy companies have outperformed the broad market by over 100 percentage points since January 2000. I think that most social investing investors are on board with this tradeoff, but some of the industry proponents have drunk the Kool-Aid of beating the market. That’s just not going to happen consistently. In fact, a fund dedicated to tobacco, alcohol, gambling, and defense (aka “The Four B’s:” butts, booze, bets, and bombs) has outperformed the market as a whole over the past ten years.

OK, fine, but what does this have to do with the National League West? Well, two of its members have, in recent years, made a point of pursuing a certain type of player, just as social investing focuses on a certain type of company. The Diamondbacks, under general manager Kevin Towers and manager Kirk Gibson, became a punchline for grit and dirty uniforms and headhunting. (Not that it always worked all that well.) The Rockies, somewhat less noisily, have pursued players embodying specific values. Co-owner Charlie Monfort (a man not without issues) stated back in 2006,  “I don’t want to offend anyone, but I think character-wise we’re stronger than anyone in baseball. Christians, and what they’ve endured, are some of the strongest people in baseball.” Co-owner Dick Monfort described the team’s “culture of value.” This vision was implemented by co-GMs (hey, Colorado starts with co, right?) Dan O’Dowd and Bill Geivett. (OK, O’Dowd was officially GM and Geivett assistant GM, but the two were effectively co-GMs, with Geivett primarily responsible for the major league team and O’Dowd the farm system).

Now, there’s nothing wrong with players who are also commendable people. You could do a lot worse than start a team with Clayton Kershaw and Andrew McCutchen, to name two admirable stars. Barry Larkin was a character guy. So was Ernie Banks. Brooks Robinson. Walter Johnson. Lou Gehrig. All good guys.

But holding yourself to the standards set by the Diamondbacks and Rockies also means you’re necessarily excluding players who are, well, maybe more characters than character guys.  Miguel Cabrera has proven himself to be a tremendous talent and a somewhat flawed person. Jonathan Papelbon has a 2.67 ERA and the most saves in baseball over the past six years, but he’s done some things that are inadvisable. Carlos Gomez, a fine player, second in the NL in WAR to McCutchen over the past two years, has his detractors. Some of the players whom you’d probably rather not have your daughter date include Babe Ruth, Ty Cobb, Rogers Hornsby, Barry Bonds, and many of the players and coaches of the Bronx Zoo Yankees.

I want to make a distinction here between what the Diamondbacks and Rockies did and the various “ways” that teams have–the Orioles Way, the Cardinals Way, etc. There’s plenty of merit in developing a culture starting in the low minors that imbues the entire organization. That’s not what Arizona and Colorado did. They specified qualities for major leaguers, and, in the case of the Diamondbacks at least, got rid of players who didn’t meet them. I don’t know what’s wrong with Justin Upton, but for some reason, Towers didn’t like something about him, trading him away. The Braves make a big deal about character, but of course they traded for Upton, so the Diamondbacks went way beyond anything the Braves embrace.

In effect, what the Diamondbacks and Rockies have done is like social investing. They’ve viewed guys who don’t have dirty uniforms or aren’t good Christians or something the same way some investors view ExxonMobil or Anheuser-Busch InBev. Again, that’s their prerogative, but it loses sight of the goal. Investors want to maximize their returns, but as I said, most social investors realize that by focusing on only certain types of stocks, they’ll have slightly inferior performance. They’ll give up some performance in order to hew to their precepts. Baseball teams want to maximize wins, and there really isn’t any qualifier related to precepts you can append to that.

The Rockies and Diamondbacks were living under the belief that by focusing on only certain types of players, they could have superior performance. It’s like the people who think they can beat the market averages through social investing. It hasn’t happened yet. And, of course, the Diamondbacks and Rockies were terrible last year, with the worst and second-worst records in baseball. Just as social investing doesn’t maximize profits, the baseball version of social investing didn’t maximize wins in Phoenix or Denver.

I’ve used the past tense throughout this discussion. Towers, Gibson, O’Dowd, and Geivett are gone, replaced by GM Dave Stewart and manager Chip Hale in Arizona and GM Jeff Bridich in Colorado. (The Monforts remain.) Last year, the Diamondbacks created the office of Chief Baseball Officer, naming Tony LaRussa, a Hall of Fame manager who’s been less than perfect as a person and in the types of players he tolerates. These moves don’t change that these are both bad teams. But by pursuing a well-diversified portfolio of players going forward, rather than a pretty severe social investing approach, both clubs, presumably, can move toward generating market returns. Their fans, after all, never signed on to an approach that willingly sacrifices wins for the sake of management’s conscience.