Archive for prospects

Your Team’s Prospects Are Probably Not Going To Work Out

Serious prospect hounds know that only about 10% of minor leaguers ever participate in a major league game. However, even the most discerning fans can be deluded into believing that their team’s farm system can overcome the odds and build a perennial contender based on their prospects alone.

I decided to investigate how much average WAR a prospect generates based on their ranking in Baseball America’s Prospect Handbook. I used a similar process in a previous article in which I calculated the amount of WAR based on the next six seasons of a player’s career since being listed (instead of when a player makes their major league debut). This means that players closer to the majors get a boost to their value, since they will have more opportunities to accumulate WAR than players in the lower minors.

Next, I grouped the players by their ordinal ranking in their organization from the 2001-2015 seasons and calculated each group’s average WAR to create the visualization below. Read the rest of this entry »


How Much Value Is Really in the Farm System?

Everyone knows that a strong farm system is key to the long-term success of a major league organization. They make it possible for clubs to field competitive teams at affordable salaries and stay beneath the luxury tax threshold, but how much value can an organization truly expect from their farm system? How much more value do the best farm systems generate compared to the worst ones? I decided to take a closer look.

Methodology

The first thing I did was gather the player information and rankings from the Baseball America’s Prospect Handbooks from 2001-14 and entered them into a database. I then found players’ total fWAR produced over the next six seasons, and I added them together to find the values that each farm system produced. I chose six seasons to ensure that teams wouldn’t get credit for a player’s non-team-controlled years, since the value produced would not be guaranteed for the player’s current organization. This method will reduce the total value produced by players that are further away from the majors, but the purpose of this analysis is to focus on the value of the entire farm system and not an individual player’s value over the course of their career.

Let’s look at the 2014 Minnesota Twins as an example. Below is a list of the thirty players that were ranked and the amount of WAR that each player has produced by season. Read the rest of this entry »


Prospecting for the Mookie Betts of Pitching

Over the past several years, we have watched a number of hitters in the minors display good contact skills with average or below-average power be labeled with 45s and 50s only to burst onto the scene with an explosion of power they never showed any hint of previous. Mookie Betts might be the best example, along with guys like Jose Ramirez, who show up to the big leagues and announce themselves by mashing.  Naturally, prospect hounds, analysts, and the baseball community investigated how these guys went so overlooked (unless you were Carson Cistulli). It was surmised that contact quality mixed with good exit velocity and appropriate launch angles allowed hitters to maximize their output even without Aaron Judge levels of thump.

This investigation, however, is not a hunt for the next minor leaguer who will smash his way onto the scene, but rather a search for the pitchers who will try to stop them. With modern conditioning and institutions (read: Driveline) making it more possible than ever to gain velocity, one no longer must be naturally gifted a 6-foot-5 frame with easy 95 to be considered a prospect. Furthermore, with openers, bulk guys, firemen, and more, traditional pitching roles are going by the wayside.

This analysis attempts to seek out pitchers who possess above-average command or secondary offerings but lack the prototypical velocity grades we are seeing in today’s game. Identifying these pitchers would make them intriguing candidates for these high-intensity velocity training plans. While you may not find the next Luis Severino, you could uncover an explosive fireman reliever, matchup guy, or high-octane backend starter that pushes you closer to October glory.

The process for this analysis involved using the 2018 updated prospects list from THE BOARD, developed by Kiley McDaniel, Eric Longenhagen, and Sean Dolinar at this very site. I started by sorting for prospects who either currently have > 55 command or project for the same. This brought the sample to 85 pitchers. Next, I sorted out pitchers who have a present FB grade of > 55. Our sample now sits at 38 pitchers who have or project to have above-average command and an average-to-below-average fastball. Before diving into the next set of data, I wanted to provide some broader notes about this group. Notable pitchers with top 100–130 considerations on this list include Atlanta’s Kolby Allard and Joey Wentz, Miami’s Braxton Garrett, and the Angels’ Griffin Canning. There are 16 lefties and 22 righties. The Phillies lead the way with five of these guys, the Cubs and Rockies are tied with three each, and then the rest of the league has one or two on this list. Additionally, the average age of this group is 22.8 years old.

Now that we have our assorted pool, it is time to sort through this group’s off-speed arsenal. This part of the analysis was more subjective. I have attempted to group pitchers with similar traits that could fill a variety of roles. What follows is three tables of guys who could benefit most from additional velocity.

Elite Pitch Guys (70 Grade Pitch)
Name Pos Tm Age FB SL CH CMD
Eli Morgan RHP CLE 22.5 45 / 45 50 / 55 60 / 70 45 / 55
Logan Shore RHP DET 23.9 40 / 45 40 / 45 60 / 70 50 / 60

This first group features two right-handers with a current 60-grade pitch that projects for 70. Of the 38, these two are the lone members who feature a current 60 pitch. Of the two, Morgan has the higher upside based on his slider. Both have fastballs that sit around 90 mph, but additional velo training could push the value of these guys up a tier. Guys from this tier could be featured as openers or one-time-through-the-order relievers that rely on one elite pitch. The selling point of this group is that they have that elite pitch to lean on even without elite velocity.

Mid-to-Backend Starter Type (One 60 and 55)
Name Pos Tm Age FB CB CH CMD
Pedro Avila RHP SDP 21.8 50 / 50 55 / 60 55 / 60 45 / 55
Joey Wentz LHP ATL 21.1 45 / 50 45 / 55 60 / 60 45 / 55
Braxton Garrett LHP MIA 21.3 50 / 50 55 / 60 40 / 55 45 / 55
Foster Griffin LHP KCR 23.3 45 / 45 55 / 60 50 / 55 50 / 55

The next group features players with multiple 55-or-better future offerings, led by Padres righty Pedro Avila, who is rocking two future 60-grade pitches. Previously mentioned notables Garrett and Wentz also fall into this category. This group represents backend starter types who are useful during the season but less useful during the postseason. Additional velo here could push these guys into strong No. 3 starters or high-leverage multi-inning guys.

Kitchen Sinkers (High Secondary Scores)
Name Pos Tm Age FB SL CB CH CMD ARS
Griffin Canning RHP LAA 22.5 50 / 50 50 / 50 50 / 50 45 / 55 45 / 55 155
Peter Lambert RHP COL 21.6 50 / 50 45 / 50 50 / 55 55 / 60 45 / 55 155
Jose Lopez RHP CIN 25.2 50 / 50 50 / 50 50 / 50 40 / 50 50 / 55 150
Aaron Civale RHP CLE 23.4 45 / 50 55 / 60 40 / 45 45 / 50 50 / 60 155
Cole Irvin LHP PHI 24.8 40 / 40 45 / 50 50 / 50 40 / 45 45 / 55 145
Alec Mills RHP CHC 26.9 45 / 45 50 / 50 40 / 40 55 / 55 55 / 60 145
Cory Abbott RHP CHC 23.1 45 / 45 50 / 55 45 / 45 40 / 45 45 / 55 145

The last group of guys profile as backend starter types who live on off-speed stuff and have no margin for error with their fastballs. I identified these players by adding their FV non-fastball pitch grades together, noted as ARS in table (ARS = FCH+FSL+FCB). These guys walk the command and off-speed tightrope to end up as backend starters in the best case, or just middle-relief guys or up-and-down starters. Occasionally these guys become Kyle Hendricks, Tanner Roark, or Doug Fister, but these are exceptions and not the rule. Almost everyone in this group is older for a prospect, so the ceiling is limited, however, additional velo for these guys could turn them into more dynamic multi-inning relivers, bulk guys, or high-end No. 4-5 starters.

I should also note that all these guys fall into different buckets of age, level, and body types. Arguably, the most critical component of a prospect on this list would be targeting high-makeup guys who would be willing to experiment and acknowledge that they could use more gas to ascend to the next level. Some of these pitchers may be maxed out physically or unwilling to change what already seems to work. This analysis also looks past statistical performance, level, and even present pitch value a bit. What this analysis does do is identify guys who could rapidly improve with additional velocity due to advanced command and secondary. The margin for error is incredibly slim for this type of pitcher, but through intense training and velocity gains, pitcher X throwing 90-92 bumping to 94-96 with already above-average command and secondaries would vault them into a new tier of player. For teams looking to squeeze every ounce of value out of their farm system, this could be another way to target undervalued talent that has yet to be unlocked and developed.


Is ‘Tanking’ in Baseball Worth It?

With all the blabbing about the fire sale of the Miami Marlins, and less so with the Pittsburgh Pirates, does the philosophy of ‘tanking‘ in Major League Baseball work? Can it come to fruition the same way it does in the National Football League or the National Basketball Association?

The biggest and most obvious difference in those sports is the vast majority of players you’ll draft in the NFL or NBA are ready to play (even start) the following season. Not only that, players are more of a ‘sure thing’ in those leagues; you’re more likely to hit on a player since the pool is much more shallow than it is in baseball.

While in MLB, there are several levels to break through before you’re actually ready to play in the top-level.

Now, I understand the angle of ‘tanking’ to accumulate funds and eventually splurge on some free agents or wanting to make your team younger. I can follow that train of thought (sort of) but we are going to go on the premise that teams are doing it to grab top-level draft picks through each round.

Yes, the Houston Astros and Chicago Cubs, after many seasons of horrid baseball, are now World Champions thanks to patience and a great analytics department. Let’s just break even and apply this to your average front office.

According to research done by Cork Gains of Business Insider back in 2013:

“After three years, we will probably only see about 15% of this year’s draftees in the big leagues. And for most players, it will take 4-6 years to make it to the highest level”.

Let’s take a more recent peek at draft success within the first five rounds of the MLB draft. We only go that deep because, honestly, after that point (and even five rounds is a reach) it’s mostly a crap shoot and I’d venture to guess no team has any sort of advantage over the other.

I’m using five years as its reasonable to expect, even with a high schooler, to reach the big leagues within that amount of time.  Of players drafted in 2017, none have reached the majors; no surprise there. In 2016 just one player drafted, third-round pick Austin Hays of the Baltimore Orioles, has made it to the majors. We ought not to reference that year, either.

The 2015 draft is when we start seeing results.

2015Draft

Of first rounders in the 2015 draft, first overall pick Dansby Swanson debuted in 2017. Alex Bregman, Andrew Benintendi, and Carson Fulmer all came up in 2016.

In the 2015 draft, out of 165 players picked in the first five rounds, 7% have made it to the big leagues.

It goes without saying the list grew considerably in 2014 and it follows that it would in subsequent drafts. Out of rounds one through five in 2014, we have 19% currently in the majors.

2104Draft

Let’s investigate the success rate by round, referencing research done by Mike Rosenbaumof Bleacher Report.

draftSuccess


So the first round, you’re likely to get two out of every three players in the majors, then 50/50 in the second round. However, this chart is no reference for success or failure for the player once they do reach MLB.

The standard deviation of success rate drop-off is 4.96%, with a variance of 24.6%

Here, we’ll observe the first overall picks since 2006 and their yearly average WAR from all MLB seasons.

no1WAR

The first-overall pick in this era yielded about 50% averaging WAR over 3.2 (we’ll get to the context in a bit).

Lastly, let’s look at the cumulative WAR of rounds one through five, starting at 2011 to 2015. As mentioned before, there was just one player who reached MLB that was selected in the first five rounds during the last two years.

avgWARDraftRd

*Mookie Betts 24.1 WAR

So the chart lends itself to logic; the older the year, the higher the cumulative WAR. But, there is still a lot we don’t know yet as there are still players in the 2011 draft toiling in the minors, yet could break into the big leagues in the next year or so.

Yet, something funny happens. There is a spike in WAR once we get to round 5. As noted, the majority of WAR from that round in 2011 comes from Mookie Betts. Could we infer that later rounds will increase as well? Probably not, as the random variation would likely be all over the place player to player. But it’s not a stretch to assume that you can find just as much value in later rounds as you can in the first couple.

Obviously, the bigger success stories come from the first round. But, keep in mind that’s just one player. On a team of 25 guys, it’s less likely that this player can turn an entire franchise around by themselves. In the NBA its possible, or the NFL where a quarterback can pull a team out of mediocrity within a year or so.

I’ll average the first round pick WAR to get an idea of what a team who continually ‘tanks’, could expect to get out of first rounders for the next several years.

2011- 2.8
2012- 1.7
2013- 1.2

Again, this isn’t concrete information but it’s enough data to get a rough inference. If you ‘tank’ for several years, and get a high first round pick, you can expect to get a players who will average a WAR of about 3 (after about five years); the average WAR of a number one pick (using the data in the ’06-’16 chart) is a little better than 2.

So you’ve got a good shot to get a player considered decent or, at best, above average.

The following chart give some context on WAR for those unfamiliar.

WARvalues

Is it really worth ‘tanking’ in baseball? In, say, five years of mediocrity, how often can you expect to hit on a player in the early rounds (average 2.5+ WAR)? Again, in the first round (’06-’16) chart above, you’ve got a 50/50 shot. Is it worth driving your franchise into the ground with those kinds of odds?

Like I’ve said before, we are using a small amount of data that is on a sliding scale (the older the draft, the higher the WAR). Since it would take roughly 3-5 years for an organization to acquire draft picks that could break into the league and help push the team into championship contention, it’s not too far of a reach. Meaning you can expect your first couple of picks per year to start normalizing WAR after a couple of seasons…if they reach the majors at all at all.

So is ‘tanking’ worth it? Allegedly to the Marlins and Pirates, it seems to be. They have highly paid analysts and I’m a lowly blogger, so they know better than I do. But, with the information I’ve been able to acquire, it doesn’t seem as though stockpiling high picks will benefit an organization enough to risk losing fans, revenue, and respect in MLB in the short term.


2017 HBL Dynasty League Prospect Draft – So Deep You’ll Love It

The HBL is what many around here would call a “home league”, though I generally take that comment to mean the level of skill is lower than that of an expert level league, which in this case would do a disservice to describe the talented owners we have. Over the course of 18+ years this group has been together, we’ve honed something I now refer to as “Hampshire-style dynasty”. The key components to this style of fantasy baseball are: 25 man roster (1C, 3OF, DH, 9P, 7 Bench), $217 salary cap (25-man only), 10 man minor league roster and an annual “prospect draft” each year during the All-Star break. While many of you fantasy players are getting twitchy, accidentally clicking on your live scoring 6-10 times a day for the four day break, we’re enjoying a glorious, leisurely-paced live draft for our future man-crushes.

Hampshire-style dynasty actually shares a few similarities with the Ottoneu-style keeper leagues, but the minor league portion of the roster is set to mimic real-life baseball. Minor league player salaries, upon promotion, are set based on the round they are selected. $4 for a first-rounder, $3 for a second, $2 for a third and $1 for a fourth. This ensures that you’ll be able to keep most players a minimum of 3 years before their salaries become a decision point, and for super-star players it’s common to see them kept for 6 to 9 years before being released back into the auction. The feel is something very similar to the arbitration salary escalation process.

I share the background because I feel this feature is a fantastic one for those of you playing or creating dynasty leagues. The reason I wrote the article, though, is because I’m hoping to share the names of some further-off prospects to drive discussion. Because we roster 120 minor league players, we’re pretty well clear of the Baseball America Top 100 list, but both The Dynasty Guru’s Top 300 Prospects and the FG Consensus prospect rankings list are a useful base from which to begin monitoring prospect names. Both midseason prospect updates from BA and BP come out the week before our draft, and the new MLB draft class along with the J2 signings make for a really interesting first two weeks of July for us prospect hounds.

2017 HBL Prospect Draft
ROUND 1
# Owner Player Team Pos Highest Level
1 O’Connor Vladimir Guerrero Jr. Blue Jays 3B A+
2 Helmers Francisco Mejia Indians C AA
3 Vonderharr Mitch Keller Pirates SP A+
4 Duginske/Pelto Luis Robert White Sox OF R
5 Beyler Bo Bichette Blue Jays 2B R
6 Woody Walker Buehler Dodgers SP AA
7 Jabs Michael Kopech White Sox SP AA
8 Kummer Triston McKenzie Indians SP A+
9 Jabs Forrest Whitley Astros SP A+
10 Rogers Scott Kingery Phillies 2B AAA
11 Kummer Brendan McKay Rays 1B/SP 2017 Draftee
12 Biesanz Hunter Greene Reds SP/SS 2017 Draftee
SANDWICH ROUND (COMPETITVE FINISH PICKS)
# Owner Player Team Pos Highest Level
13 Kummer Rhys Hoskins Phillies 1B AAA
14 Rogers Mike Soroka Braves SP AA
15 Jabs Kolby Allard Braves SP AA

The first round of the draft normally consists of a few staple “types”. The guys we missed on last year that were fast movers (Guerrero Jr., Kingery, Bichette, Mejia), the new high-profile international signees (Robert), and whichever pitchers we missed last year that progressed quickly and now have industry hype around them (Kopech, Keller, Buehler, McKenzie, et al). Depending on the year, the current MLB draft class may get some love in the first round as well (McKay, Greene)

Though I didn’t myself have a first round selection, I had Vlad Jr. as the number one player available. There are some players like Hoskins or Mejia who are closer to having a fantasy impact, but we’re generally drafting for ceiling here. Among the top arms available Mitch Keller has been my favorite for going on a year now. Both Guerrero Jr and Keller were on my list as possible fourth round selections last year, but I didn’t pull the trigger (Delvin Perez, SS, STL was my sole 4th round selection in 2016 because I’m a sucker for shortstop prospects).

The Competitive Finish Round, which are picks awarded to those teams who finish in 4th through 6th place (just outside “the money”) kicked off what forever shall be known as the “holy cow the Braves have a lot of starting pitching prospects” draft.

2017 HBL Prospect Draft
ROUND 2
# Owner Player Team Pos Highest Level
16 Jabs MacKenzie Gore Padres SP 2017 Draftee
17 Helmers Willie Calhoun Dodgers 2B AAA
18 Duginske/Pelto Chance Sisco Orioles C AAA
19 Helmers Kyle Wright Braves SP 2017 Draftee
20 Beyler Sixto Sanchez Phillies SP A
21 Woody Franklin Perez Astros SP A+
22 Melichar Derek Fisher Astros OF MLB
23 Melichar Ryan Mountcastle Orioles SS A+
24 Melichar Juan Soto Nationals OF A
25 Rogers Dominic Smith Mets 1B AAA
26 Todosichuk Royce Lewis Twins SS R
27 Beyler Carson Kelly Cardinals C AAA

Round 2 featured a couple players I had pegged as first round talents on my board with Calhoun and Fisher. It didn’t hurt that their proximity to impact is < 1 year. I’m also biased against selecting many pitchers, especially prior to AA. The probability of them washing out, having arm/shoulder injuries, or taking the [insert pitcher name who flew through the minors, was called up, didn’t fare well for three years, but you owned him in parts of all three seasons only to see a league-mate hit the lotto after you dropped him for the fifth time name here] and having to live with that shame/guilt.

Juan Soto was an interesting case. I’d honestly not heard his name before the BP midseason list came out and they ranked him #12. Once I started hearing things like “Victor Robles” I took notice and decided he was likely worth the gamble. My other picks in this round included Derek Fisher who I concluded was a safer high-ish ceiling guy with both speed and power (and currently nowhere to play in Houston, nor a decent lineup slot if he did), and Ryan Mountcastle who by all scout accounts won’t actually stick at SS but I’m hoping for a Brad Miller type. Mountcastle can’t take a walk, but we use AVG and Total Bases, so you can guess how many [poops] I could give so long as he can make it to the Show. Maybe he can learn from Adam Jones . . . or really any Orioles player, they really don’t seem to value OBP in that organization, do they?

I was happy to see so many pitchers and catchers go, because my draft strategy basically has me ignoring them.

2017 HBL Prospect Draft
ROUND 3
# Owner Player Team Pos Highest Level
28 Melichar Jhailyn Ortiz Phillies OF A-
29 Helmers Austin Beck Athletics OF R
30 Vonderharr Luis Ortiz Brewers SP AA
31 Kummer Estevan Florial Yankees OF A
32 Beyler Riley Pint Rockies SP A
33 Woody Jack Flaherty Cardinals SP AAA
34 Vonderharr Shane Baz Pirates SP R
35 Duginske/Pelto Leody Taveras Rangers OF A
36 Melichar Taylor Trammel Reds OF A
37 Rogers Dylan Cease White Sox SP A
38 Helmers Luiz Gohara Braves SP AA
39 Todosichuk Fernando Tatis Jr. Padres SS A

I kicked off Round 3 with a player I decided I couldn’t wait on, even though I really wanted to get him in the fourth round so that his starting salary could be $1 someday down the road.

I love Jhailyn Ortiz. A lot. Probably too much. You may or may not remember him from the Vladimir Guerrero J2 class. Well I did, and I just started seeing some hype articles on the kid this week. I got scared and jumped to grab him. This is the type of player, the “fast movers”, that we generally miss in our draft (myself included) and end up being #1 of 1 the following year. His power potential is unmatched and I’m glad to own his ceiling.

My leaguemates all seemed generally bummed when Florial went off the board. I hadn’t read much on him but when there’s that much chatter when a single player goes off the board that’s generally a good sign for the owner who took him.

The other player of note in this round is Austin Beck, who was dubbed “future hall-of-famer” by his team. This is the type of crazy prognostication smack-talk that becomes lore.

I chose another player in this round, Taylor Trammel from the Reds. He’s your typical toolsy prep kid with speed and power. We all draft these guys every year. Sometimes they’re Monte Harrison and sometimes they’re Andrew McCutchen.

2017 HBL Prospect Draft
ROUND 4
# Owner Player Team Pos Highest Level
40 Rogers Jesus Sanchez Rays OF A
41 Helmers Thomas Szapucki Mets SP A
– Vonderharr **PASS**
42 Kummer JB Bukauskas Astros SP 2017 Draftee
43 Biesanz Colton Welker Rockies 3B A
44 Woody Kyle Lewis Mariners OF A+
45 Melichar James Kaprielian Yankees SP A+
– Duginske/Pelto **PASS*
46 Melichar Yordan Alvarez Astros 1B A+
47 Melichar Cole Tucker Pirates SS A+
48 Helmers Jeren Kendall Dodgers OF 2017 Draftee
49 Biesanz Michael Chavis Red Sox 3B AA

The fourth round is where things really get fun. We’re really past all the highest ranked talent on the industry lists and now you’re just using your intuition to try and snag the guys who will become the 2018 1st round picks — a year early. I was lucky enough to have traded for a few extra fourth round picks and had 3 picks in a row near the back of the round.

One player, I was sitting on all draft was Yankees 55FV SP James Kaprielian. He’s had Tommy John surgery this year, but with any luck I was able to snag a 1st round talent at a 4th round price. Having elite $1 pitchers to call up and hitch your wagons to for 4-9 years is every owner’s dream in this league. I’m just hoping he can be another TJ success story. I believe that if he doesn’t get hurt he’s right up there with Keller and Buehler in the fist round this year.

My other two picks aren’t the most conventional draft choices, but sometimes you just have to go with your gut. Truth be told, Colton Welker was snagged infront of me, so I had to scramble for my last guy, who ended up being Cole Tucker. Tucker is ranked as the #5 Pirates prospect on MLB Pipeline and #7 here at FG by Longenhagen. I skipped rival Pirates SS prospect, Kevin Newman (#4 MLB, #5 FG) because I love the steals that Tucker has piled up in his time in the minors. I can see he doesn’t have 60 or 70 grade speed, but when you’re gambling on ceiling you have to throw up a few hail mary shots. I was able to watch some video on Tucker, and the scouting reports told me the same thing my eyes told me, which is that he’s awfully “slappy” for a 6’3 180lb former first round pick. Also, in the video I found, his hands are all over the place from the left side of the plate (he’s a switch hitter). I’m scared and excited all at once.

The last pick I made was Yordan Alvarez. I was so caught up hoping no one noticed him or was writing about him to notice that he made the Future’s Game roster. Much like Jhailyn Ortiz, Alvarez is a former J2 signee as well and also has big time power. He was just recently promoted to A+ after destroying baseballs in A to the tune of a .297 ISO. I like the sound of that.

I’ve had a great time writing up our league’s draft and I hope it’s given some of you dynasty league owners some more names to talk about. I’d love to see comments about who you think got great value in this draft, as well as anyone that wasn’t taken that you might have drafted.

I can tell you that the top players left from the BA Midseason list after we were done drafting were: Luis Urias, Anthony Alford, and pitchers Brandon Woodruff, Alex Faedo, Ian Anderson, Anthony Banda, Erick Fedde, Justus Sheffield, Tyler Mahle, Matt Manning, Beau Burrows, and Nick Niedert. I considered some of these arms with my fourth round picks, but as I said, I prefer to see most of them pitch at AA and spend a higher pick on them if I really like them.


Tyler Wilson and His Five Plus Pitches

Let me preface this article by saying that I watch A LOT of baseball.  I also have an extensive analytical background and am always analyzing baseball stats looking for value in players.  Last week, I was watching an Orioles game and the starting pitcher was a player I have never heard of.  His name is Tyler Wilson.  While watching the game, I was very impressed with his overall make-up and the confidence he displayed in each one of his pitches.  Many times what separates a pitcher from being able to start at the big-league level versus being destined for the bullpen is the ability to throw multiple pitches.  The ability to throw each of those pitches effectively, however, can be what separates a good starting pitcher from a great starting pitcher.  The more I watched of Wilson, the more intrigued I became about his future outlook, and the more motivated I became to write this article.  (I went back and watched all of Wilson’s starts this year before writing this article.)

To give you a little background, Tyler Wilson has never been an elite prospect.  He attended college at the University of Virginia, where he was overlooked by fellow staff-mate, and future 1st round pick, Danny Hultzen.  Wilson was drafted by the Orioles in the 10th round of the 2011 MLB Draft.  Ever since being drafted, he has quietly excelled at every level.  He doesn’t have the dominant strikeout numbers that you look for in pitching prospects, which is a big reason he has gone overlooked for much of his career.

After climbing his way through the organizational ladder, Wilson made his major league debut with the Orioles last year and eventually made the team this year out of spring training.  Although he made the team in a bullpen role, early season injuries to the Orioles pitching staff opened up an opportunity and Wilson has really taken advantage of it.  Enough of the background though.  Let’s move on to what I saw while actually watching him pitch.

Tyler Wilson features a cutter and a two-seam fastball.  Each of these pitches sit in the 89-91 mph range and both show a great amount of movement.  The cutter is most effective against right-handed batters when thrown on the outside portion of the plate.  Check out the video below to watch him fool Kansas City Royals outfielder Lorenzo Cain with three straight cutters:

He essentially gave Cain, a very good hitter, three of the exact same pitches in a row…and Cain couldn’t touch them.  In every start this year, Wilson has pounded the outside corner with this cutter and has had fantastic results.  Don’t think by any means though that he is a one trick pony.  As soon as you start to expect that cutter on the outside corner, Wilson will come right back in on you with a two-seam fastball:

Look at the horizontal movement on that pitch!  Absolutely filthy!  Wilson has showed a ton of confidence in both of those pitches so far this season as he uses them to pound both sides of the strike zone and his command of them has been exceptional.  He is not afraid to throw them in any count and they are equally effective vs both left-handed and right-handed batters.

While his fastballs both seemed to be plus pitches upon first glance, I started to have thoughts that this guy might be for real as soon as he started throwing his curveball.  Wilson’s breaking ball sits in the 77-79 mph range.  I was astonished by how well he was able to locate his curve and the amount of movement on each and every one he threw.  Watch him send White Sox slugger Jose Abreu down swinging in the video below:

Abreu had no chance.  In his most recent start against the Twins, Wilson’s curve looked even better.  Check out the one he threw to Byung-Ho Park:

Both of those pitches came in a 2-2 count.  Many pitchers are scared to throw a breaking ball in a 2-2 count, especially to players with plus power such as Abreu and Park.  If you miss your target, two things can happen.  One — you leave the ball up in the zone and it gets hit out of the stadium.  Two — you throw it in the dirt; the hitter lays off; and now you have to pitch to this slugger with a full count.  Wilson isn’t scared to throw his curveball in any count and that is what makes him so dangerous.  You never know when to expect it, but at the same time you have to expect that he can throw it at any moment.

The last pitch in Wilson’s arsenal is his changeup.  This pitch has a ton of downward movement and produces a lot of groundballs.  While there were many better examples that I could have shown you of his change-up in action, I wanted to show one of his bad ones.  Even when he missed his target, the batter was still fooled by the amount of movement on this pitch.  Check out the following pitch to Royals SS Alcides Escobar:

The catcher set up down in the zone and Wilson clearly misses his target.  Luckily it didn’t seem to matter as the pitch had an insane amount of horizontal movement, running in on Escobar and jamming him.

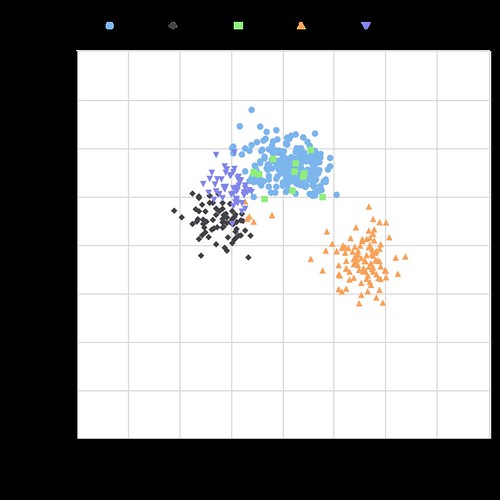
Take a look at the chart below, showing the vertical and horizontal movement on each of Wilson’s pitches:

Tyler Wilson Movement

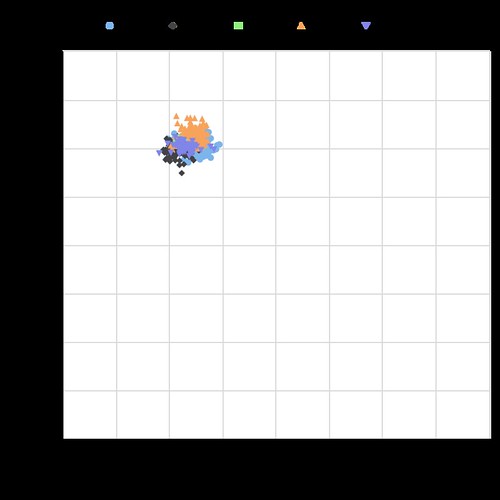
The middle portion of this chart is empty.  All five of his pitches have a tremendous amount of movement, and none of them move in the same direction.  The fact that he is able to command each of these pitches so well and keep hitters guessing with which one will come next is the reason why he has had so much success.  A big reason why hitters are having trouble guessing his pitches is because of how well Wilson is able to repeat his delivery.  The chart below shows Wilson’s release point for each type of pitch:

Tyler Wilson Release Point
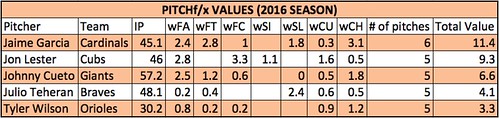
As you can see, his release point is almost identical with all five of his pitches.  At this point, I have watched all of his starts from this season and was very impressed.   I then decided to do some research and was immediately impressed with stats such as his career BB rate and low WHIP, but wanted to dig further.  I began to look through the PITCHf/x data because I was curious to see how effective each of his pitches actually were.  Based on the PITCHf/x value metric, all of his pitches so far this year have graded as above average.  If you are not familiar with the PITCHf/x value scale, someone who has a fastball ranking of zero means that he possesses an average fastball.  Any value above zero means that pitch is above average.  Obviously the higher the number, the better the pitch.  The same goes for negative numbers and pitches being below average.  See the table below for the breakdown of Wilson’s arsenal:

Screen Shot 2016-05-15 at 1.19.17 AM

Based on the above values, the change-up has been Wilson’s most valuable pitch this season with his curveball close behind.  Obviously it is very early in the season and we are working with a small sample size…but that doesn’t mean we can’t have fun!  While doing this research, I set out the goal to find every starting pitcher who throws five or more above-average pitches.  Below is the list of players who fit that description:

Screen Shot 2016-05-15 at 1.41.09 AM
IP = Innings Pitched
FA = Fastball
FT = Two-Seam Fastball
FC = Cut Fastball
SI = Sinker
SL = Slider
CU = Curveball
CH = Change-up
KC = Knuckle Curveball
EP = Eephus

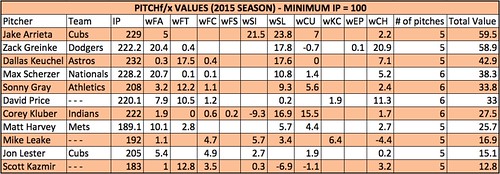
There are only five pitchers who have thrown five or more pitches above average so far this season!  Wilson is in great company, as the other four pitchers are all All-Star-caliber players and borderline household names.  Being that this is such a small sample size, I decided to look back at last year’s stats to see how many players fit this description over a full season.  Using the same parameters and setting the minimum IP to 100, the following table was produced:

Screen Shot 2016-05-15 at 2.05.17 AM

Once again, the names on this list are some of the top pitchers in baseball.  A few of these pitchers have a pitch that graded out as below average, but since they had five or more different pitches all individually grade as above average, they made the final cut.

As you can see, it is very rare to have a pitcher who has five legitimate plus pitches.  I am very interested to see if Tyler Wilson can maintain these results over the course of a full season, and I really hope he is given the opportunity to do so.  If he continues to pitch the way he has been, the Orioles will have no choice but to leave him in the rotation.  Although he has had limited success, Wilson has struggled in each of his starts when facing the lineup the third time around.  This could be due to the fact that he is still in the process of being stretched out from his bullpen role.  When in the bullpen, you don’t have to prepare to face the same hitter three times.  I am hopeful that once he is fully stretched out and back into his starter mentality, he will be able to make the necessary adjustments and continue to throw all of his pitches with confidence.  If he can continue to make quality pitches as he faces the lineup for a third time, I believe Tyler Wilson has the chance to become a very special pitcher.

Memorable quotes I heard during the TV broadcasts:

“Everyone thinks that I pitch with a chip on my shoulder but I really don’t.  I just go out and compete.  I don’t think of it that way.” – Tyler Wilson

“I think he understands himself.  He can maintain his game-plan throughout the game.  He’s going to keep us in the game and give us a chance to win.  What more can you ask for?” – Pitching Coach Dave Wallace

“I love that he can make the ball run in and then cut away.  He pitches to both sides of the plate.  Not a lot of young pitchers can do that.” – Manager Buck Showalter

…no Buck, not a lot of young pitchers can do that.

Twitter – @mtamburri922


Applying KATOH to Historical Prospects

Over the last few weeks, I have written a series of posts looking into how a player’s stats, age, and prospect status can be used to predict whether he’ll ever play in the majors. I analyzed hitters in Rookie leagues, Short-Season A, Low-A, High-A, Double-A, and Triple-A using a methodology that I named KATOH (after Yankees prospect Gosuke Katoh), which consists of running a probit regression analysis. In a nutshell, a probit regression tells us how a variety of inputs can predict the probability of an event that has two possible outcomes — such as whether or not a player will make it to the majors. While KATOH technically predicts the likelihood that a player will reach the majors, I’d argue it can also serve as a decent proxy for major league success. If something makes a player more likely to make the majors, there’s a good chance it also makes him more likely to succeed there.

After receiving a few requests, I decided to apply the model to players of years past. In what follows, I dive into what KATOH would have said about recent top prospects, look at the highest KATOH scores of the last 20 years, and highlight some instances where KATOH missed the boat on a prospect. If you’re feeling really ambitious, here’s a giant google doc of KATOH scores for all 40,051 player seasons since 1995 ( minimum 100 plate appearances in a short-season league or 200 in full-season ball).

Before I delve into the parade of lists, I want to point out one disclaimer to what I’m doing here. KATOH was derived from the performances of historical players, so applying the model to those same players might make it look a little better than it is. Take a player like Jason Stokes for example. Although he was a very well-regarded prospect in the early 2000’s (#15 and #51 per Baseball America in 2003 and 2004), KATOH consistently gave him probabilities in the 70’s and 80’s. But part of that is likely because Stokes’ data points were incorporated into the model. If I had created KATOH in 2005, Stokes’ MLB% may have been a few percentage points higher. Even so, a few data points generally aren’t enough to substantially change a model that incorporates thousands. In other words, it’s probably safe to assume that a player’s MLB% using today’s KATOH is roughly in line with what he would have received at the time.

Now, onto the results. Here’s what KATOH thought about some of the most recent top 100 prospects:

2013 Top 100 Prospects

Player Year Age Level MLB Probability
Xander Bogaerts 2013 20 AA 99.888%
Xander Bogaerts 2013 20 AAA 99.869%
George Springer 2013 23 AAA 99.816%
Gregory Polanco 2013 21 AA 99.614%
Nick Castellanos 2013 21 AAA 99.608%
Kolten Wong 2013 22 AAA 99.428%
Wil Myers 2013 22 AAA 99.418%
Miguel Sano 2013 20 A+ 99.335%
Tyler Austin 2013 21 AA 99.194%
Jackie Bradley 2013 23 AAA 99.079%
Kaleb Cowart 2013 21 AA 99%
Byron Buxton 2013 19 A+ 98%
Francisco Lindor 2013 19 A+ 98%
Christian Yelich 2013 21 AA 97%
Byron Buxton 2013 19 A 97%
Addison Russell 2013 19 A+ 97%
Billy Hamilton 2013 22 AAA 96%
Brian Goodwin 2013 22 AA 96%
Carlos Correa 2013 18 A 96%
Slade Heathcott 2013 22 AA 96%
Javier Baez 2013 20 A+ 95%
Jake Marisnick 2013 22 AA 95%
Albert Almora 2013 19 A 95%
Jonathan Singleton 2013 21 AAA 94%
Mike Zunino 2013 22 AAA 94%
Alen Hanson 2013 20 A+ 94%
Gregory Polanco 2013 21 A+ 92%
Javier Baez 2013 20 AA 91%
Jorge Soler 2013 21 A+ 90%
Gary Sanchez 2013 20 A+ 89%
Austin Hedges 2013 20 A+ 89%
Mike Olt 2013 24 AAA 87%
Miguel Sano 2013 20 AA 83%
George Springer 2013 23 AA 82%
Mason Williams 2013 21 A+ 78%
Trevor Story 2013 20 A+ 61%
Bubba Starling 2013 20 A 61%
Courtney Hawkins 2013 19 A+ 58%
Roman Quinn 2013 20 A 58%

2012 Top 100 Prospects

Player Year Age Level MLB Probability
Jurickson Profar 2012 19 AA 99.975%
Anthony Rizzo 2012 22 AAA 99.947%
Manny Machado 2012 19 AA 99.937%
Billy Hamilton 2012 21 AA 99.856%
Oscar Taveras 2012 20 AA 99.827%
Kolten Wong 2012 21 AA 99.824%
Nolan Arenado 2012 21 AA 99.759%
Leonys Martin 2012 24 AAA 99.737%
Nick Franklin 2012 21 AA 99.737%
Yasmani Grandal 2012 23 AAA 99.714%
Wil Myers 2012 21 AAA 99.659%
Andrelton Simmons 2012 22 AA 99.566%
Travis D’Arnaud 2012 23 AAA 99.512%
Jedd Gyorko 2012 23 AAA 99.493%
Hak-Ju Lee 2012 21 AA 99.492%
Jonathan Singleton 2012 20 AA 99.482%
Nick Castellanos 2012 20 AA 99.465%
Jonathan Schoop 2012 20 AA 99.443%
Jean Segura 2012 22 AA 99.423%
Nick Castellanos 2012 20 A+ 99.051%
Starling Marte 2012 23 AAA 99.015%
Anthony Gose 2012 21 AAA 99%
Rymer Liriano 2012 21 AA 99%
Jake Marisnick 2012 21 AA 99%
Xander Bogaerts 2012 19 A+ 98%
Michael Choice 2012 22 AA 98%
Gary Brown 2012 23 AA 98%
Christian Yelich 2012 20 A+ 98%
Nick Franklin 2012 21 AAA 97%
Javier Baez 2012 19 A 97%
Brett Jackson 2012 23 AAA 96%
Zack Cox 2012 23 AAA 92%
Mason Williams 2012 20 A 91%
Gary Sanchez 2012 19 A 89%
Jake Marisnick 2012 21 A+ 88%
Francisco Lindor 2012 18 A 88%
Cheslor Cuthbert 2012 19 A+ 87%
Miguel Sano 2012 19 A 86%
Billy Hamilton 2012 21 A+ 83%
George Springer 2012 22 A+ 80%
Christian Villanueva 2012 21 A+ 80%
Mike Olt 2012 23 AA 79%
Matt Szczur 2012 22 A+ 78%
Rymer Liriano 2012 21 A+ 76%
Blake Swihart 2012 20 A 66%
Cory Spangenberg 2012 21 A+ 64%
Bubba Starling 2012 19 R 17%

2011 Top 100 Prospects

Player Year Age Level MLB Probability
Mike Trout 2011 19 AA 99.973%
Brett Lawrie 2011 21 AAA 99.969%
Anthony Rizzo 2011 21 AAA 99.911%
Wil Myers 2011 20 AA 99.654%
Christian Colon 2011 22 AA 99.495%
Brandon Belt 2011 23 AAA 99.414%
Austin Romine 2011 22 AA 99.393%
Jesus Montero 2011 21 AAA 99.379%
Devin Mesoraco 2011 23 AAA 99.205%
Brett Jackson 2011 22 AAA 99.199%
Dustin Ackley 2011 23 AAA 99.196%
Yonder Alonso 2011 24 AAA 99%
Lonnie Chisenhall 2011 22 AAA 99%
Zack Cox 2011 22 AA 98%
Jason Kipnis 2011 24 AAA 98%
Mike Moustakas 2011 22 AAA 98%
Desmond Jennings 2011 24 AAA 98%
Jonathan Villar 2011 20 AA 98%
Matt Dominguez 2011 21 AAA 98%
Jurickson Profar 2011 18 A 97%
Bryce Harper 2011 18 A 97%
Tony Sanchez 2011 23 AA 97%
Dee Gordon 2011 23 AAA 97%
Grant Green 2011 23 AA 97%
Manny Machado 2011 18 A+ 97%
Nolan Arenado 2011 20 A+ 96%
Chris Carter 2011 24 AAA 96%
Travis D’Arnaud 2011 22 AA 96%
Wilmer Flores 2011 19 A+ 95%
Jose Iglesias 2011 21 AAA 95%
Hak-Ju Lee 2011 20 A+ 94%
Brett Jackson 2011 22 AA 93%
Jonathan Singleton 2011 19 A+ 92%
Joe Benson 2011 23 AA 91%
Gary Sanchez 2011 18 A 86%
Wilin Rosario 2011 22 AA 86%
Nick Castellanos 2011 19 A 85%
Nick Franklin 2011 20 A+ 83%
Jean Segura 2011 21 A+ 82%
Cesar Puello 2011 20 A+ 82%
Derek Norris 2011 22 AA 76%
Jonathan Villar 2011 20 A+ 73%
Aaron Hicks 2011 21 A+ 68%
Billy Hamilton 2011 20 A 61%
Miguel Sano 2011 18 R 44%
Josh Sale 2011 19 R 15%

Next, lets take a look at some of the highest KATOH scores of all time, namely those who received a score of at least 99.9%. There aren’t any complete busts among these players, as virtually all of them went on to play in the majors.

All-Time Top KATOH Scores

Player Year Age Level MLB Probability
Sean Burroughs 2000 19 AA 99.998%
Luis Castillo 1996 20 AA 99.995%
Fernando Martinez 2007 18 AA 99.994%
Daric Barton 2005 19 AA 99.992%
Alex Rodriguez 1995 19 AAA 99.992%
Carl Crawford 2001 19 AA 99.992%
Elvis Andrus 2008 19 AA 99.992%
Adam Dunn 2001 21 AAA 99.990%
Joe Mauer 2003 20 AA 99.989%
Ryan Sweeney 2005 20 AA 99.984%
Nick Johnson 1999 20 AA 99.984%
Jose Tabata 2009 20 AA 99.983%
Jose Tabata 2008 19 AA 99.983%
Travis Snider 2009 21 AAA 99.981%
Joaquin Arias 2005 20 AA 99.980%
Matt Kemp 2006 21 AAA 99.979%
Jose Reyes 2002 19 AA 99.979%
Jurickson Profar 2012 19 AA 99.975%
Mike Trout 2011 19 AA 99.973%
Jay Bruce 2008 21 AAA 99.971%
Brett Lawrie 2011 21 AAA 99.969%
B.J. Upton 2004 19 AAA 99.959%
Howie Kendrick 2006 22 AAA 99.951%
Ryan Howard 2005 25 AAA 99.951%
Dioner Navarro 2004 20 AA 99.950%
Luis Rivas 1999 19 AA 99.949%
Lastings Milledge 2005 20 AA 99.948%
Anthony Rizzo 2012 22 AAA 99.947%
Billy Butler 2006 20 AA 99.946%
Fernando Martinez 2008 19 AA 99.944%
Alberto Callaspo 2004 21 AA 99.944%
Jose Lopez 2003 19 AA 99.939%
Freddie Freeman 2010 20 AAA 99.939%
Manny Machado 2012 19 AA 99.937%
Rickie Weeks 2005 22 AAA 99.935%
Casey Kotchman 2004 21 AAA 99.932%
Eric Chavez 1998 20 AAA 99.930%
Adrian Beltre 1998 19 AA 99.927%
Shannon Stewart 1995 21 AA 99.917%
Anthony Rizzo 2011 21 AAA 99.911%
Karim Garcia 1995 19 AAA 99.910%
Jay Bruce 2007 20 AAA 99.907%
Jeff Clement 2008 24 AAA 99.902%
Miguel Cabrera 2003 20 AA 99.900%

All of the players who registered a KATOH score of at least 99.9% did so while playing in either Double- or Triple-A. This isn’t all that surprising since these are the levels closest to the big leagues. But what about the lower levels? Like we saw in Double- and Triple-A, there weren’t any complete busts among the highest ranking hitters from full-season A-ball. For both full-season leagues, each of the 20 top ranked players has either made it to the majors, or in the case of Carlos Correa, is young enough to still has an excellent chance to do so. But on the bottom two rungs on the minor league ladder, we come across a few instances where KATOH whiffed, most notably in Garrett Guzman (74%), Richard Stuart (72%), and Pat Manning (72%).

Top KATOH Scores for Seasons in High-A

Player Year Age Level MLB Probability
Adrian Beltre 1997 18 A+ 99.863%
Andruw Jones 1996 19 A+ 99.568%
Giancarlo Stanton 2009 19 A+ 99.405%
Billy Butler 2005 19 A+ 99.348%
Miguel Sano 2013 20 A+ 99.335%
Chris Snelling 2001 19 A+ 99.241%
Jason Heyward 2009 19 A+ 99.097%
Andy LaRoche 2005 21 A+ 99.091%
Wilmer Flores 2010 18 A+ 99.075%
Nick Castellanos 2012 20 A+ 99.051%
Jose Reyes 2002 19 A+ 99%
Casey Kotchman 2003 20 A+ 99%
Vernon Wells 1999 20 A+ 99%
Travis Lee 1997 22 A+ 99%
Brandon Wood 2005 20 A+ 98%
Xander Bogaerts 2012 19 A+ 98%
Justin Huber 2003 20 A+ 98%
Aramis Ramirez 1997 19 A+ 98%
Jay Bruce 2007 20 A+ 98%
Byron Buxton 2013 19 A+ 98%

Top KATOH Scores for Seasons in Low-A

Player Year Age Level MLB Probability
Mike Trout 2010 18 A 99%
Adrian Beltre 1996 17 A 98%
Jurickson Profar 2011 18 A 97%
Bryce Harper 2011 18 A 97%
Sean Burroughs 1999 18 A 97%
Andruw Jones 1995 18 A 97%
Byron Buxton 2013 19 A 97%
Jason Heyward 2008 18 A 97%
Corey Patterson 1999 19 A 97%
Vladimir Guerrero 1995 20 A 97%
Javier Baez 2012 19 A 97%
Ian Stewart 2004 19 A 96%
Lastings Milledge 2004 19 A 96%
Carlos Correa 2013 18 A 96%
Prince Fielder 2003 19 A 96%
Delmon Young 2004 18 A 96%
Josh Vitters 2009 19 A 96%
Chad Hermansen 1996 18 A 95%
Wilmer Flores 2010 18 A 95%
B.J. Upton 2003 18 A 95%

Top KATOH Scores for Seasons in Short-Season A

Player Year Age Level MLB Probability Played in Majors
Chris Snelling 1999 17 A- 82% 1
Richard Stuart 1996 19 A- 72% 0
Aramis Ramirez 1996 18 A- 71% 1
Ryan Kalish 2007 19 A- 71% 1
Cory Spangenberg 2011 20 A- 66% 0
Hanley Ramirez 2002 18 A- 66% 1
Wilson Betemit 2000 18 A- 65% 1
Ismael Castro 2002 18 A- 65% 0
Vernon Wells 1997 18 A- 64% 1
Carlos Figueroa 2000 17 A- 61% 0
Carson Kelly 2013 18 A- 61% 0
Pablo Sandoval 2005 18 A- 60% 1
Dan Vogelbach 2012 19 A- 59% 0
Manny Ravelo 2000 18 A- 57% 0
Chip Ambres 1999 19 A- 57% 1
Maikel Franco 2011 18 A- 55% 0
Jurickson Profar 2010 17 A- 55% 1
Derek Norris 2008 19 A- 54% 1
Cesar Saba 1999 17 A- 54% 0
Edinson Rincon 2009 18 A- 52% 0

Top KATOH Scores for Seasons in Rookie ball

Player Year Age Level MLB Probability Played in Majors
Jeff Bianchi 2005 18 R 76% >1
Justin Morneau 2000 19 R 74% 1
Addison Russell 2012 18 R 74% 0
Garrett Guzman 2001 18 R 74% 0
James Loney 2002 18 R 74% 1
Prince Fielder 2002 18 R 73% 1
Pat Manning 1999 19 R 72% 0
Wilmer Flores 2008 16 R 70% 1
Alex Fernandez 1998 17 R 70% 0
Dorssys Paulino 2012 17 R 69% 0
Tony Blanco 2000 18 R 69% 1
Hank Blalock 1999 18 R 69% 1
Joe Mauer 2001 18 R 69% 1
Hanley Ramirez 2002 18 R 69% 1
Ramon Hernandez 1995 19 R 68% 1
Angel Salome 2005 19 R 68% 1
Marcos Vechionacci 2004 17 R 67% 0
Gary Sanchez 2010 17 R 66% 0
Scott Heard 2000 18 R 65% 0
Jose Tabata 2005 16 R 65% 1

Now for KATOH’s biggest whiffs. Looking at seasons prior to 2011, the following players had very high KATOH ratings, but never made it to baseball’s highest level. The biggest miss was Cesar King, a defensive-minded catcher from the Rangers organization. Though to KATOH’s credit, King did spend five days on the Kansas City Royals’ roster in 2001 without getting into a game. Following King are a couple of busted Yankees prospects in Jackson Melian and Eric Duncan. Not to make excuses for KATOH, but these guys’ high scores may have had something to do with the way the Yankees over-hyped their prospects back then. If those two weren’t on Baseball America’s top 100 list, KATOH would have pegged them in the 70’s, rather than in the high-90’s.

KATOH’s Biggest Misses

Player Year Age Level MLB Probability
Cesar King 1998 20 AA 99.427%
Jackson Melian 2000 20 AA 99%
Eric Duncan 2005 20 AA 98%
Matt Moses 2006 21 AA 98%
Juan Williams 1995 21 AA 98%
Jeff Natale 2005 22 AA 97%
Eric Duncan 2006 21 AA 97%
Nick Weglarz 2010 22 AAA 96%
Nick Weglarz 2009 21 AA 96%
Tony Mota 1999 21 AA 95%
Micah Franklin 1998 26 AAA 94%
Billy Martin 2003 27 AAA 94%
Bill McCarthy 2004 24 AAA 94%
Jackson Melian 1999 19 A+ 94%
Tagg Bozied 2004 24 AAA 94%
Kevin Grijak 1995 23 AAA 93%
Angel Villalona 2008 17 A 93%
Danny Dorn 2010 25 AAA 93%
Nic Jackson 2003 23 AAA 92%
Pat Cline 1997 22 AA 92%

And here are the major leaguers who KATOH deemed least likely to make it when they were in the minors. Its worth noting that a couple of them — Jorge Sosa and Jason Roach — made it as pitchers.

Worst KATOH Scores Who Made it to the Majors

Player Year Age Level MLB Probability
Justin Christian 2004 24 A- 0.017%
Jorge Sosa 1999 21 A- 0.027%
Tyler Graham 2006 22 A- 0.087%
Gary Johnson 1999 23 A- 0.136%
Bo Hart 1999 22 A- 0.155%
Tommy Manzella 2005 22 A- 0.181%
Michael Martinez 2006 23 A- 0.185%
Eddy Rodriguez 2012 26 A+ 0.194%
Kevin Mahar 2004 23 A- 0.215%
Will Venable 2005 22 A- 0.232%
Brent Dlugach 2004 21 A- 0.268%
Sean Barker 2002 22 A- 0.270%
Steve Holm 2002 22 A- 0.301%
Edgar V. Gonzalez 2000 22 A- 0.315%
Peter Zoccolillo 1999 22 A- 0.328%
Konrad Schmidt 2007 22 A- 0.337%
Tommy Medica 2010 22 A- 0.365%
Brian Esposito 2008 29 AA 0.392%
Jason Roach 1997 21 A- 0.396%
Jorge Sosa 2000 22 A- 0.439%

KATOH’s far from perfect, but overall, I think it does a pretty decent job of forecasting which players will make it to the majors. That being said, it’s still a work in progress, and I have a few ideas rolling around in my head to improve on the model. Furthermore, I’m working to develop something that will forecast how a minor leaguer will perform upon reaching the majors, to complement his MLB%. I’ll be dropping these new and improved KATOH projections (for both hitters and pitchers) after this year’s World Series, when we’ll all be desperate for something baseball-related to get us through the winter.

Statistics courtesy of FanGraphs, Baseball-Reference, and The Baseball Cube; Pre-season prospect lists courtesy of Baseball America.


Using Short-Season A Stats to Predict Future Performance

Over the last couple of weeks, I’ve been looking into how a player’s stats, age, and prospect status can be used to predict whether he’ll ever play in the majors. So far, I’ve analyzed hitters in Rookie leagues, Low-A, High-A, Double-A and Triple-A using a methodology that I named KATOH (after Yankees prospect Gosuke Katoh), which consists of running a probit regression analysis. In a nutshell, a probit regression tells us how a variety of inputs can predict the probability of an event that has two possible outcomes — such as whether or not a player will make it to the majors. While KATOH technically predicts the likelihood that a player will reach the majors, I’d argue it can also serve as a decent proxy for major league success. If something makes a player more likely to make the majors, there’s a good chance it also makes him more likely to succeed there.

For hitters in Low-A and High-A, age, strikeout rate, ISO, BABIP, and whether or not he was deemed a top 100 prospect by Baseball America all played a role in forecasting future success. And walk rate, while not predictive for players in Rookie ball, Low-A, or High-A, added a little bit to the model for Double-A and Triple-A hitters. Today, I’ll look into what KATOH has to say about players in Short-Season A-ball. Due to varying offensive environments in different years and leagues, all players’ stats were adjusted to reflect his league’s average for that year. For those interested, here’s the R output based on all players with at least 200 plate appearances in a season in SS A-ball from 1995-2007.

Short Season Output

Just like we saw with hitters in Rookie ball, a player’s Baseball America prospect status couldn’t tell us anything about his future as a big leaguer. This was entirely due the scarcity players top 100 prospects in the sample, as only a handful of players spent the year in SS A-ball after making BA’s top 100 list. Somewhat surprisingly, walk rate is predictive for players in SS-A, despite being statistically insignificant for hitters in Rookie ball and the more advanced A-ball levels. Another interesting wrinkle is the “Strikeout_Rate:Age” variable. Basically, this says that strikeout rate matters more for younger players than for older players at this level. Although frequent strikeouts are obviously a bad thing no matter how old you are:

Rplot

The season is less than 50 games old for most teams in the New York-Penn and Northwest Leagues, which makes it a little premature to start analyzing players’ stats. But just for kicks, here’s a look at what KATOH says about this year’s crop of players with at least 100 plate appearances through July 28th. The full list of players can be found here, and you’ll find an excerpt of those who broke the 40% barrier below:

Player Organization Age MLB Probability
Rowan Wick STL 21 82%
Eduard Pinto TEX 19 68%
Marcus Greene TEX 19 60%
Mauricio Dubon BOS 19 59%
Franklin Barreto TOR 18 57%
Christian Arroyo SFG 19 57%
Skyler Ewing SFG 21 56%
Taylor Gushue PIT 20 55%
Domingo Leyba DET 18 55%
Raudy Read WSN 20 53%
Nick Longhi BOS 18 52%
Andrew Reed HOU 21 52%
Danny Mars BOS 20 51%
Amed Rosario NYM 18 49%
Yairo Munoz OAK 19 48%
Seth Spivey TEX 21 47%
Mike Gerber DET 21 47%
Mark Zagunis CHC 21 47%
Kevin Krause PIT 21 46%
Leo Castillo CLE 20 45%
Jordan Luplow PIT 20 45%
Mason Davis MIA 21 40%
Kevin Ross PIT 20 40%
Franklin Navarro DET 19 40%

As we saw with Rookie league hitters, KATOH doesn’t think any of these players are shoo-ins to make it to the majors. Even Rowan Wick, who hit a Bondsian .378/.475/.815 before getting promoted, gets just 82%. This goes to show that SS A-ball stats just aren’t all that meaningful.

Once the season’s over, I’ll re-run everything using the final 2014 stats, which will give us a better sense of which prospects had the most promising years statistically. I also plan to engineer an alternative methodology — to supplement this one — that will take into account how a player performs in the majors, rather than his just getting there. Additionally, I hope to create something similar for projecting pitchers based on their statistical performance. In the meantime, I’ll apply the KATOH model to historical prospects and highlight some of its biggest “hits” and “misses” from years past. Keep an eye out for the next post in the coming days.

Statistics courtesy of FanGraphs, Baseball-Reference, and The Baseball Cube; Pre-season prospect lists courtesy of Baseball America.


Using Rookie League Stats to Predict Future Performance

Over the last couple of weeks, I’ve been looking into how a player’s stats, age, and prospect status can be used to predict whether he’ll ever play in the majors. I used a methodology that I named KATOH (after Yankees prospect Gosuke Katoh), which consists of running a probit regression analysis. In a nutshell, a probit regression tells us how a variety of inputs can predict the probability of an event that has two possible outcomes — such as whether or not a player will make it to the majors. While KATOH technically predicts the likelihood that a player will reach the majors, I’d argue it can also serve as a decent proxy for major league success. If something makes a player more likely to make the majors, there’s a good chance it also makes him more likely to succeed there. In the future, I plan to engineer an alternative methodology to go along with this one, that takes into account how a player performs in the majors, rather than his just getting there.

For hitters in Low-A and High-A, age, strikeout rate, ISO, BABIP, and whether or not he was deemed a top 100 prospect by Baseball America all played a role in forecasting future success. And walk rate, while not predictive for players in A-ball, added a little bit to the model for Double-A and Triple-A hitters. Today, I’ll look into what KATOH has to say about players in Rookie leagues. Due to varying offensive environments in different years and leagues, all players’ stats were adjusted to reflect his league’s average for that year. For those interested, here’s the R output based on all players with at least 200 plate appearances in a season in Rookie ball from 1995-2007.

Rookie Output

Just like we saw with hitters in the A-ball leagues, a player’s walk rate is not at all predictive of whether or not he’ll crack the majors. Unlike all of the other levels I’ve looked at so far, a player’s Baseball America prospect status couldn’t tell us anything about his future as a big-leaguer. This was entirely due the scarcity of top-100 prospects in the sample, as only a handful of players spent the year in rookie ball after making BA’s top-100 list.

The season is less than 40 games old for most rookie league teams, which makes it a little premature to start analyzing players’ stats. But just for kicks, here’s a look at what KATOH says about this year’s crop of rookie-ballers with at least 80 plate appearances through July 28th. This only considers players in the American rookie leagues — the Appalachian, Arizona, Gulf Coast, and Pioneer Leagues, meaning it excludes the Dominican and Venezuelan Summer Leagues. The full list of players can be found here, and you’ll find an excerpt of those who broke the 40% barrier below:

Player Organization Age MLB Probability
Kevin Padlo COL 17 73%
Bobby Bradley CLE 18 67%
Alex Verdugo LAD 18 65%
Luke Dykstra ATL 18 64%
Yu-Cheng Chang CLE 18 59%
Magneuris Sierra STL 18 56%
Juan Santana HOU 19 54%
Joshua Morgan TEX 18 50%
Jason Martin HOU 18 49%
Edmundo Sosa STL 18 48%
Oliver Caraballo TEX 19 46%
Sthervin Matos MIL 20 46%
Alexander Palma NYY 18 45%
Eloy Jimenez CHC 17 45%
Javier Guerra BOS 18 44%
Zach Shepherd DET 18 44%
Tito Polo PIT 19 44%
Jose Godoy STL 19 43%
Henry Castillo ARI 19 42%
David Gonzalez DET 20 42%
Dan Jansen TOR 19 42%
Max George COL 18 42%
Gleyber Torres CHC 17 42%
Luis Guzman WSN 18 41%
Jose Martinez KCR 17 41%
Alex Jackson SEA 18 40%
Emmanuel Tapia CLE 18 40%

What stands out most is that KATOH doesn’t think any of these players are shoo-ins to make it to the majors. Even those who are hitting the snot out of the ball get probabilities that fall short of what we saw for unremarkable performances in Double-A. Kevin Padlo, for example, gets just a 73%, despite hitting a ridiculous .317/.463/.619 as a 17-year-old. Its hard to do much better than that. I think this really speaks to how little rookie ball stats matter in the grand scheme of things. A good offensive showing is obviously better than a poor one, but numbers from this level need to be taken with a huge grain of salt. A hitter’s performance against pitchers who are fresh out of high school just can’t tell us much about how he’ll fare when matched up against more advanced pitching at the higher levels.

Next up, I’ll complete the series by looking at stats from short-season A-ball. Teams at that level are also only a few weeks into their season, but at the very least, it will be interesting to see how KATOH feels about SS A-ballers in general. Next week, I’ll apply the KATOH model to historical prospects and highlight some of its biggest “hits” and “misses” from the past.

Statistics courtesy of FanGraphs, Baseball-Reference, and The Baseball Cube; Pre-season prospect lists courtesy of Baseball America.


Using Triple-A Stats to Predict Future Performance

Over the last couple of weeks, I’ve been looking into how a players’ stats, age, and prospect status can be used to predict whether he’ll ever play in the majors. I used a methodology that I named KATOH (after Yankees prospect Gosuke Katoh), which consists of running a probit regression analysis. In a nutshell, a probit regression tells us how a variety of inputs can predict the probability of an event that has two possible outcomes — such as whether or not a player will make it to the majors. While KATOH technically predicts the likelihood that a player will reach the majors, I’d argue it can also serve as a decent proxy for major league success. If something makes a player more likely to make the majors, there’s a good chance it also makes him more likely to succeed there. This hypothesis may be less true for players at the Triple-A level since such a high proportion of these players make it to the majors, but I still think it provides some insight. To address this issue, In the future, I plan to engineer an alternative methodology that takes into account how a player performs in the majors, rather than his just getting there.

For hitters in Low-A and High-A, age, strikeout rate, ISO, BABIP, and whether or not he was deemed a top 100 prospect by Baseball America all played a role in forecasting future success. And walk rate, while not predictive for players in A-ball, added a little bit to the model for Double-A hitters. Today, I’ll look into what KATOH has to say about players in Triple-A leagues. Due to varying offensive environments in different years and leagues, all players’ stats were adjusted to reflect his league’s average for that year. I also only considered what happened during or after the sample season. So if a former big leaguer spends the full season in Triple-A, he’s only considered to have “made it to the majors” if he resurfaces again. For those interested, here’s the R output based on all players with at least 400 plate appearances in a season in Triple-A from 1995-2011.

AAA Output

This output looks pretty similar to what we saw for Double-A hitters, including the “I(Age^2)” coefficient, which adds a bit of nuance into how a players’ age can predict his future success. But in this version, there’s also an interaction between ISO and age. Basically, this says that the ability to hit for power is much more important for older players than younger players at the Triple-A league level.

Rplot

By clicking here, you can see what KATOH spits out for all players who logged at least 250 PA’s in Triple-A as of July 7th. . I also included a few interesting players who missed the 250 PA cut off, including Mookie Betts, Rob Refsnyder, Ramon Flores, and Kris Bryant. Here’s an excerpt of the top players from Triple-A this year. Joc Pederson tops the charts with an impressive 99.91% probability. Many of these players have already played in the majors, so these values can be interpreted as the odds that said player will play in the majors in the future.

Player Organization Age MLB Probability
Joc Pederson LAD 22 100%
Gregory Polanco PIT 22 100%
Kris Bryant CHC 22 100%
Mookie Betts BOS 21 100%
Arismendy Alcantara CHC 22 100%
Oscar Taveras STL 22 99%
Stephen Piscotty STL 23 98%
Steven Souza WSN 25 98%
Javier Baez CHC 21 98%
Maikel Franco PHI 21 97%
Taylor Lindsey LAA 22 97%
Domingo Santana HOU 21 97%
Enrique Hernandez HOU 22 96%
Chris Taylor SEA 23 95%
Jake Marisnick MIA 23 95%
Mikie Mahtook TBR 24 94%
Rob Refsnyder NYY 23 94%
Alfredo Marte ARI 25 93%
Carlos Sanchez CHW 22 93%
Nick Franklin SEA 23 93%
Ramon Flores NYY 22 92%
Ronald Torreyes HOU 21 92%
Joe Panik SFG 23 91%
Tyler Saladino CHW 24 91%
Giovanny Urshela CLE 22 90%

Now that I’ve gone through all levels of full-season ball, I’ll start at the bottom and cycle through the short-season leagues. These samples will be pretty small, but perhaps not completely useless now that those players have a few weeks’ worth of games under their belts. At the very least, it will be interesting to see what KATOH’s able to tell us about batters so far away from the big leagues, even if it’s a little premature to ask KATOH about 2014’s players.