Your Team’s Prospects Are Probably Not Going To Work Out

Serious prospect hounds know that only about 10% of minor leaguers ever participate in a major league game. However, even the most discerning fans can be deluded into believing that their team’s farm system can overcome the odds and build a perennial contender based on their prospects alone.
I decided to investigate how much average WAR a prospect generates based on their ranking in Baseball America’s Prospect Handbook. I used a similar process in a previous article in which I calculated the amount of WAR based on the next six seasons of a player’s career since being listed (instead of when a player makes their major league debut). This means that players closer to the majors get a boost to their value, since they will have more opportunities to accumulate WAR than players in the lower minors.
Next, I grouped the players by their ordinal ranking in their organization from the 2001-2015 seasons and calculated each group’s average WAR to create the visualization below.
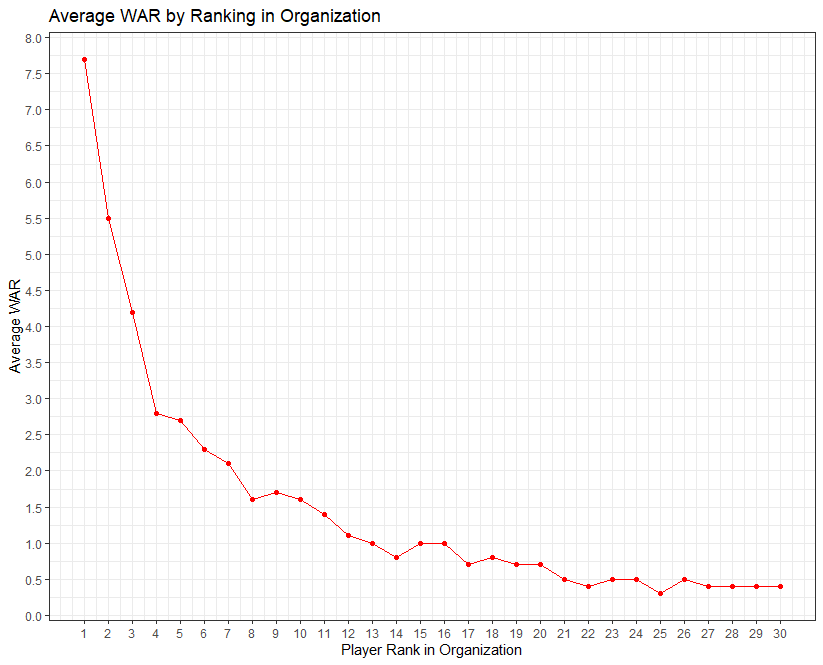
That is a steep decline, but it is not unexpected. Most prospects that ascend to the top of their team’s list have flourished in the lower minors or have a higher pedigree than their minor league compatriots. Many top prospects are also perceived as being closer to big league ready. It makes sense that these types of players would produce more value given my methodology. Players that are ranked lower can still be successful in the majors, but the profusion of prospects that fail to make it keeps these groups’ average much lower than the higher ranked players in an organization.
This is a decent start, but it does not account for differences in an organization’s minor league depth. The fifth-ranked prospect for a rebuilding team with plenty of depth is likely more talented than a fifth-ranked prospect in a competing team’s depleted farm system. To account for the quality differences between farms, I created a heat map of average WAR produced with the player’s ranking in the organization on the y-axis and the team’s farm system ranking on the x-axis.
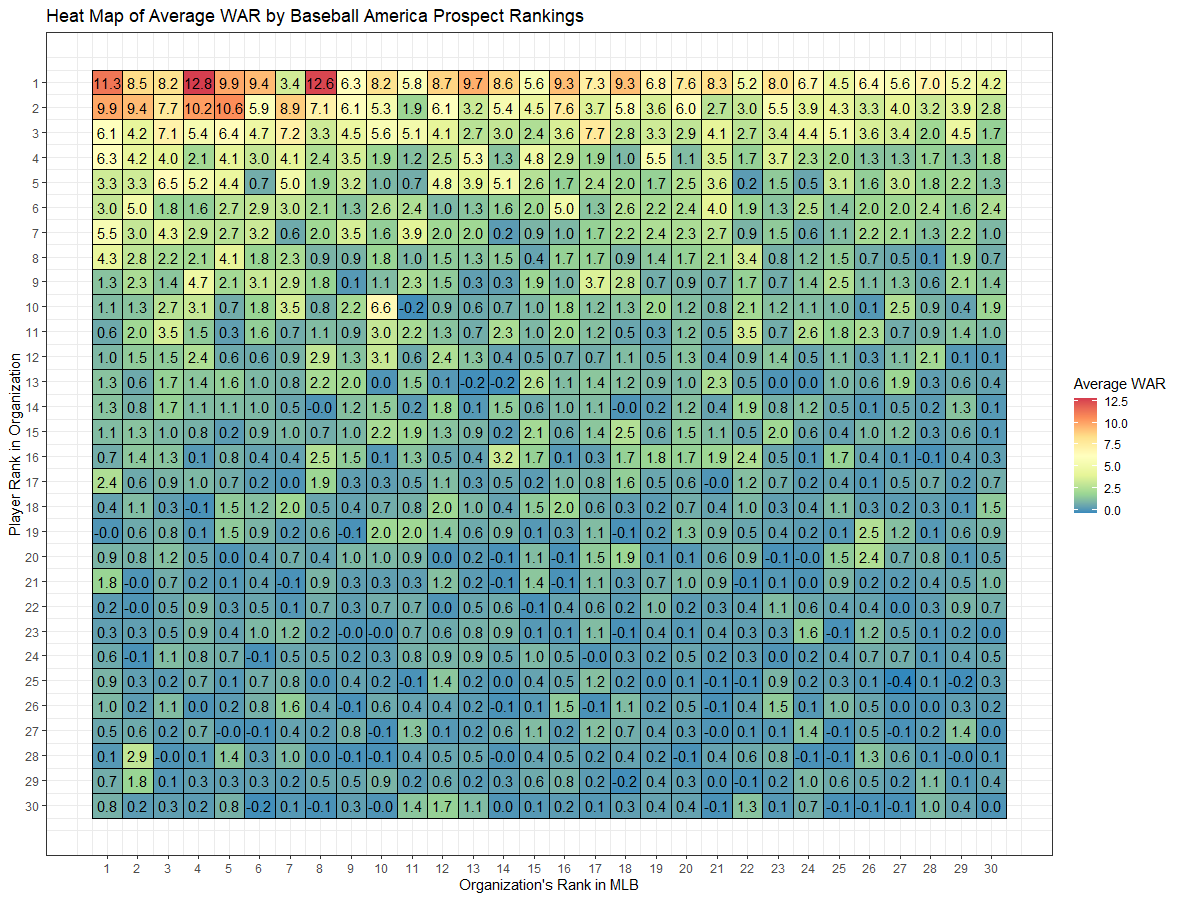
As expected, higher values are in the top half of the heat map, with the highest values appearing in the top left-hand corner. If Baseball America’s rankings are an accurate representation of minor league talent, the highest ranked players in the most talented farm systems should produce the most value.
Average WAR is a reasonable place to start. However, with so many prospects in my dataset failing to reach the big leagues, the distribution of player WAR value is heavily skewed to the right. When dealing with skewed datasets, it is more appropriate to use median values instead of average values. This is because outliers can heavily influence your results and the median calculation helps to mitigate the effects that outliers can have on your dataset. The next heat map was created the same way as the previous one, but with each group’s median WAR instead of average WAR.
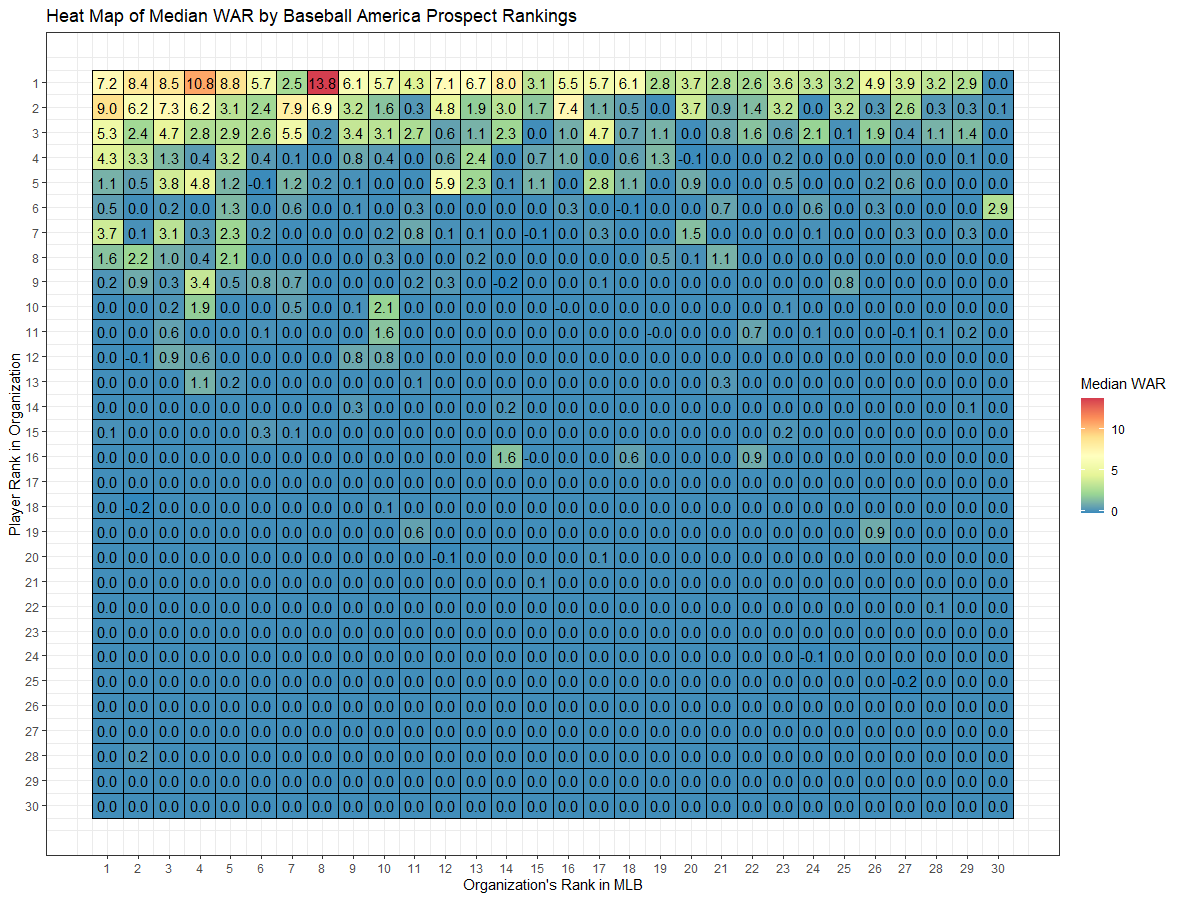
Woof. This chart is much bluer than the previous one, but the pattern is similar with the top of the chart producing the most value. This graphic shows a more desolate view on prospect valuation, but front offices and fans do not necessarily care about summary statistics. They care about their individual player and how he will do in the future. It is nice to know the odds of success from the past, but it is not necessarily predictive of a player’s future. Players outperform baseball industry projections all the time. Who is to say that your team does not have a diamond in the rough?
The next heat map attempts to provide a realistic showing of a best-case scenario for each prospect ranking. Each cell is the maximum amount of WAR produced in their respective cohort.
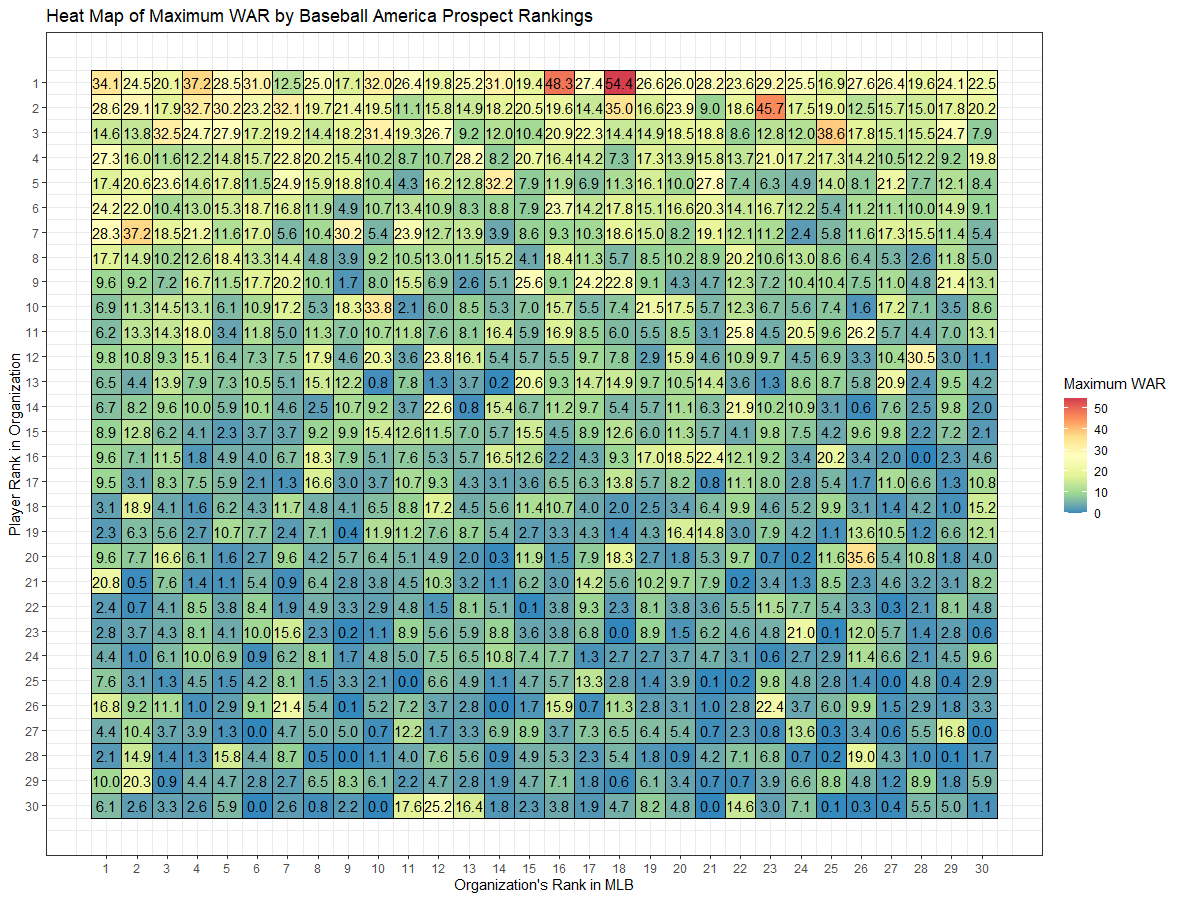
This graphic shows why GMs are reluctant to trade away their prospects. The general trend remains the same, but there are far more yellow and green boxes dispersed throughout the chart. Nobody wants to be known as someone who trades away a young star for three months of a role player. This heat map shows that major league contributors can come from almost anywhere.
I am interested in players that the industry has overlooked. I believe it would be beneficial to identify these types of players to see if there is a possible blind spot in prospect valuation. The first thing I decided to do was limit the dataset to include only players that were ranked 11th in their organization or lower. I could have drawn the line anywhere in the top 30, but the line chart from earlier seems to start to level off around this point, and 10 seems like a logical cutoff point.
The next step was to determine how much accumulated WAR is considered a success. I landed on 10 WAR being considered as a success. This cutoff is arbitrary, but I wanted to pick a lower cutoff value to accommodate for players that are in the lower levels of the minors and several years away from the majors. These younger players may be as talented as older players, but since I am not adjusting for a player’s team-controlled seasons, inexperienced players do not have the same opportunities to generate as much value as their teammates who are closer to the majors. By keeping my threshold low, I should be able to mitigate some of the bias in my dataset.
There were 97 players who met my criteria and 127 occurrences of players ranked 11th or lower that produced over 10 WAR in six seasons. There were 25 players doing it twice, including Denard Span doing it three times and Josh Donaldson doing it four times! Below is a bar chart of the results.
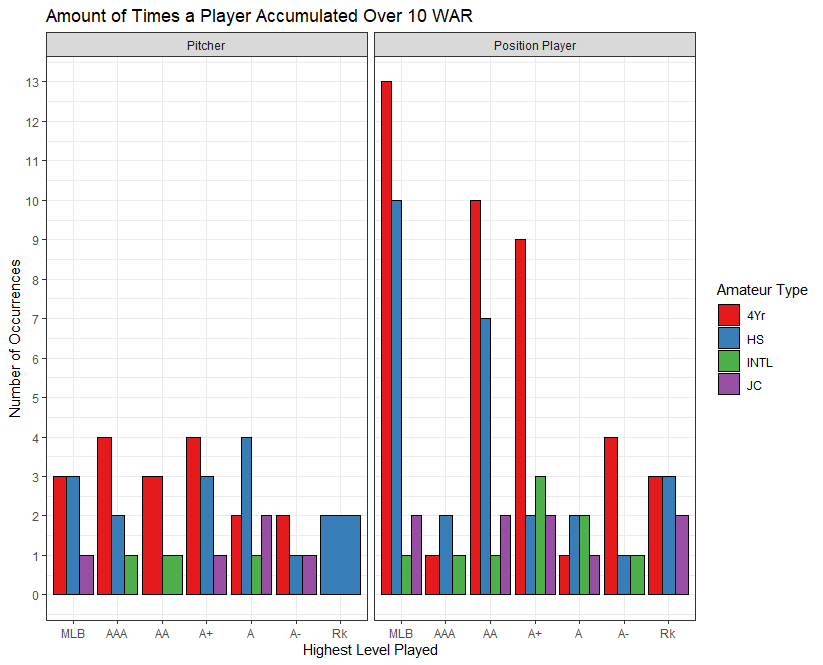
The first thing that stands out is that there are far more position players than pitchers. I do not know for certain why this is the case, but I have several theories. The first is that pitchers are fragile by nature and they are more likely to be injured and unable to generate as much WAR as position players. Another theory is that it may be easier to scout pitchers than position players and that the more successful pitchers are ranked higher and are excluded from my dataset.
Another observation is that almost half of the players attended college and there are relatively few international players that achieve stardom. Of the 97 players in my dataset, 45 of them attended a four-year university, and there are only 11 international players. However, his does not necessarily mean that college players are more likely to exceed their prospect ranking.
From 2001 through 2015, over 40% of players that were ranked between 11 and 30 in their organization attended college. This is the most prevalent type of amateur experience by far. It stands to reason that they would have more people accrue 10 or more WAR.
It appears that international players are less likely to reach 10 WAR. There were roughly the same amount of ranked high school and international players, but there are 30 high schoolers that reached 10 WAR compared to only 11 international players. I do not really have a good explanation for this phenomenon, but I do find it interesting.
The final observation I have is from the position player bar chart. I find it interesting that players with Triple-A as their highest level are the least represented group. The only explanation I can offer is that perhaps players that reach the highest level of the minors but not the majors are perceived as having lower ceilings and their teams decided they were not worthy of being called up in September when rosters expanded. This could artificially lower the Triple-A group and increase the size of the MLB group. If rosters did not expand in September, I think that there would be far more players in the Triple-A group and fewer in the MLB group.
Conclusions
- Most prospect value is concentrated in the top of a team’s farm system, but value can come from any ranking position.
- Position players are more likely to outperform their ranking than pitchers.
- College position players are the most prevalent lower ranked prospects to accrue 10 or more WAR.
- International players are the least likely to generate 10 or more WAR.
Evaluating prospects is a difficult endeavor and I hope that this article helps to illuminate the types of players that are typically overlooked by prospect evaluators.
Really cool piece
Hi Adam, great piece. Would love to chat about your research, I’ve been trying to do some similar work, but have struggled to get the right data sets.
Feel free to drop me a line on Twitter.
Great piece. The data informs the MiLB downsizing.
The draw of A ball is not that any of the players will make the majors
Lovely!
I was just saying this. Was looking at top prospect lists from 5 and 10 years ago and realizing how the vast majority made no major league impact.
People vastly overvalue prospects and think everyone guy on their teams top 25 is gonna be an All Star when most won’t have more than a cup of coffee
I haven’t seen the data, but I would assume FV is heavily right-skewed as well. Have you correlated FV?
BA didn’t introduce FV for their prospects list until way later, so I didn’t have too many players that reached six years. However, I would assume the FV is right-skewed as well.
I used the prospects page from this site in 2016 and 2017. If players were on both I took their higher FV. The result was heavily skewed. Two 70 FVs and hundreds between “35+” and “45”.
I’m in the process of gathering the data to dig in. I may even look at success rates of players with the “Low” risk designation.
Maybe it would be possible to do a fv estimation based on top 100 rank.
Kinda like
60-100: 50
25-59:55
7-24:60
3-6: 65
1-2:70
Good piece, but it brings up a question I’ve been interested in for a long time. How do MLB scouts miss so badly on not only contributing 10+ WAR players, but future Hall of Famers? Two examples come to mind, Albert Pujols, who went in the 13th round, the 402nd player chosen, and Mike Piazza, who went in the 62nd(!) round, the 1390th player chosen.
I think it might have gotten better with time. Who, in the game today, was a huge miss?
I also think it has gotten better with time, but there are always a few guys who fly under the radar! None of these are as outrageous as Pujols or Piazza, but a couple examples that come to mind off the top of my head:
Jacob deGrom, 9th round pick. Granted he barely pitched in college, so that’s an excuse.
Tatis Jr. Not a draftee, but he didn’t sign for a high bonus, and obviously wasn’t super highly regarded by the team that signed him at least.
John Means, 11th round pick
Ramon Laureano, 16th round pick
Kyle Henricks, 8th round pick
Mookie Betts is the one that comes to mind. Idk about putting John Means on that list.
Age and needles!
I like to try and figure out who is who on the maximum WAR value chart.
Nice piece. Fans tend to especially overrate the 10-30 ranked prospects in their farm system and overrate quantity over Quality.
That doesn’t mean that having a depth of 40+ and 45 fv prospects isn’t valuable but those trade suggestions of 5 40-45fv guys for one 60 guy just don’t work.
Lower FV Depth only really matters with young guys since they have the variance (17yo 40fv could be a star or fail in rookie ball) , once a 40 fv prospect is 21 or older it is quite unlikely he ever amounts to something albeit there are a few exceptions to that.
That is really what the Rays do when they actually do buy in trades, they will sell the “older” prospects (which can be 20 for international, 23 for HS or 25 for college guys) that are non top prospects and keep the young high upside guys and the top prospects.
Trading away your lower ranked prospects when they are a year away from rule 5 is actually a smart idea, I feel some GMs are to clingy with those guys hoping for the big jump in performance in their last year and then lose them for nothing in rule 5.
If course this can mean to lose a Jake cronenworth but the odds are in your favor.
So really depth matters more when it comes to young guys who have at least 2 years until rule 5, some systems have good depths but most of them are older guys soon hitting rule 5 which is not worth all that much.