Archive for Pittsburgh Pirates

Francisco Cervelli Finds his OPS in the Air


Heading into the season, the NL Central was expected to be a one horse race. The Chicago Cubs were projected to win 96 games, nine games better than the second-place-projected Cardinals. The Cardinals, for their part, were projected seven games better than the Brewers (79 wins) and eleven better than the Pirates (76 wins).

Fast forward to this writing and the NL Central mix is much cloudier. The Brewers sit atop the division at 37-24. If we only knew about the projections, they’d be the biggest surprise in the division. However, we do know more about the Brewers than the projections, such as the fact that they won 86 games in 2017 before adding very good players in Christian Yelich and Lorenzo Cain. The projection algorithms didn’t buy the Brewers as a threat, but I’d bet most people did.

The Pirates, on the other hand, won only 75 games last year. Then they got rid of staff ace Gerrit Cole and best-player Andrew McCutchen. They didn’t sign a single major league free agent. The only established major league player they acquired was Corey Dickerson after he was DFA’ed by the Rays following a dismal second half of 2017. Frankly, the Pirates were supposed to suck. Instead, their playoff odds have thus far peaked at 30% and currently sit at 11%. The Pirates were  the NL Central’s biggest early surprise before a recent cold spell.

During their 2013 to 2015 run as one of the NL’s best teams, the Pirates ranked fourth in the majors by ERA- while giving up the third fewest total runs. This time around, the Pirates staff is basically OK, with a slightly better-than-average FIP- and a below average ERA-.

Instead, the Pirates are riding an offense (excluding pitchers) that ranks eighth in the MLB by wRC+. Not unrelated, here is the Pirates ground ball rate by year since 2013:

Image and video hosting by TinyPic

That’s a drop-off-a-cliff drop. In 2017, the Pirates had the fifth-highest ground ball rate in the Majors. In 2018, they have the second-lowest. The Pirates have a chance to hit more fly balls than ground balls, which they’ve never done this century. It was a trend that Alex Stumpf noted a month ago for the Point of Pittsburgh and revisited again last month. For a team whose manager told his players that their OPS is in the air, the Pirates were late to the fly ball revolution. And yet, here they are.

At risk of oversimplifying Alex’s findings, nearly everyone on the Pirates is hitting less grounders, and nearly everyone on the Pirates is putting more of their hard contact in the air. Hard hit balls in the air are good. Trying to lift the ball more often is a tradeoff that can lead to more strikeouts, but the Pirates are doing it without striking out more than before. The Pirates have a recipe for success.

The change in approach hasn’t benefitted anyone more than Francisco Cervelli. Looking at the 240 players with at least 100 plate appearances in both 2017 and 2018, Cervelli has the second largest decrease in ground ball rate, down to 31.3% from 52.3%, and he’s also decreased his strikeout rate by several points. The Pittsburgh catcher owns a 152 wRC+, which represents a 59 point increase over last year, the eighth largest gain, and more than doubled his isolated slugging. And he’s doing it with a .308 BABIP, which is both perfectly normal and below his .333 career BABIP.

Francisco Cervelli is driving the ball in the air, and he’s doing it without making less contact. There isn’t one right way to accomplish that goal, and Cervelli’s success is probably a combination of several factors. Alex suggested to me that Cervelli appears to have lowered his hands, and it does look like he starts them lower in 2018 than he did in 2017. Lower hands often puts a hitter in a better position to drive the ball in the air, and Cervelli has gained 3.2 mph of exit velocity on line drives and fly balls – the 11th biggest gain in baseball (min. 50 LD/FB in 2017 and 2018).

Cervelli has improved his plate discipline, too. According to Pitch Info, Cervelli’s chase rate of 24.9% last season was his highest since 2013. This year, he’s lowered it to a career low 19.2% while continuing to swing at strikes at approximately his career rate.

While it’s good to know Cervelli is swinging at the same rate of strikes, we also know all strikes aren’t created equal. It’s just as important, and perhaps more so, to know what kind of strikes a player is swinging at. Here, we see significant change through late May:

Image and video hosting by TinyPic

Last year, Cervelli’s swing core is toward the low-outside corner. This year, he’s swinging at pitches up and over the heart of the plate. According to Statcast, the vertical pitch location when Cervelli swings is up from 2.20 feet to 2.40 feet – that’s the largest height increase among 226 players with 200+ swings in 2017 and 2018. Jason Heyward is second at an increase of 0.19 feet, and Alex Bregman is third at 0.13 feet. Cervelli is identifying better pitches to hit and he’s now driving them with authority.

Francisco Cervelli spent most of his career behind the dish as an unspectacular, solid hitting catcher. By reinventing himself in his age-32 season, he’s become a force at the dish for the surprise Pirates.

A big thank you to Fangraphs, Baseball Reference, and Baseball Savant for the data used in this post.


Is ‘Tanking’ in Baseball Worth It?

With all the blabbing about the fire sale of the Miami Marlins, and less so with the Pittsburgh Pirates, does the philosophy of ‘tanking‘ in Major League Baseball work? Can it come to fruition the same way it does in the National Football League or the National Basketball Association?

The biggest and most obvious difference in those sports is the vast majority of players you’ll draft in the NFL or NBA are ready to play (even start) the following season. Not only that, players are more of a ‘sure thing’ in those leagues; you’re more likely to hit on a player since the pool is much more shallow than it is in baseball.

While in MLB, there are several levels to break through before you’re actually ready to play in the top-level.

Now, I understand the angle of ‘tanking’ to accumulate funds and eventually splurge on some free agents or wanting to make your team younger. I can follow that train of thought (sort of) but we are going to go on the premise that teams are doing it to grab top-level draft picks through each round.

Yes, the Houston Astros and Chicago Cubs, after many seasons of horrid baseball, are now World Champions thanks to patience and a great analytics department. Let’s just break even and apply this to your average front office.

According to research done by Cork Gains of Business Insider back in 2013:

“After three years, we will probably only see about 15% of this year’s draftees in the big leagues. And for most players, it will take 4-6 years to make it to the highest level”.

Let’s take a more recent peek at draft success within the first five rounds of the MLB draft. We only go that deep because, honestly, after that point (and even five rounds is a reach) it’s mostly a crap shoot and I’d venture to guess no team has any sort of advantage over the other.

I’m using five years as its reasonable to expect, even with a high schooler, to reach the big leagues within that amount of time.  Of players drafted in 2017, none have reached the majors; no surprise there. In 2016 just one player drafted, third-round pick Austin Hays of the Baltimore Orioles, has made it to the majors. We ought not to reference that year, either.

The 2015 draft is when we start seeing results.

2015Draft

Of first rounders in the 2015 draft, first overall pick Dansby Swanson debuted in 2017. Alex Bregman, Andrew Benintendi, and Carson Fulmer all came up in 2016.

In the 2015 draft, out of 165 players picked in the first five rounds, 7% have made it to the big leagues.

It goes without saying the list grew considerably in 2014 and it follows that it would in subsequent drafts. Out of rounds one through five in 2014, we have 19% currently in the majors.

2104Draft

Let’s investigate the success rate by round, referencing research done by Mike Rosenbaumof Bleacher Report.

draftSuccess


So the first round, you’re likely to get two out of every three players in the majors, then 50/50 in the second round. However, this chart is no reference for success or failure for the player once they do reach MLB.

The standard deviation of success rate drop-off is 4.96%, with a variance of 24.6%

Here, we’ll observe the first overall picks since 2006 and their yearly average WAR from all MLB seasons.

no1WAR

The first-overall pick in this era yielded about 50% averaging WAR over 3.2 (we’ll get to the context in a bit).

Lastly, let’s look at the cumulative WAR of rounds one through five, starting at 2011 to 2015. As mentioned before, there was just one player who reached MLB that was selected in the first five rounds during the last two years.

avgWARDraftRd

*Mookie Betts 24.1 WAR

So the chart lends itself to logic; the older the year, the higher the cumulative WAR. But, there is still a lot we don’t know yet as there are still players in the 2011 draft toiling in the minors, yet could break into the big leagues in the next year or so.

Yet, something funny happens. There is a spike in WAR once we get to round 5. As noted, the majority of WAR from that round in 2011 comes from Mookie Betts. Could we infer that later rounds will increase as well? Probably not, as the random variation would likely be all over the place player to player. But it’s not a stretch to assume that you can find just as much value in later rounds as you can in the first couple.

Obviously, the bigger success stories come from the first round. But, keep in mind that’s just one player. On a team of 25 guys, it’s less likely that this player can turn an entire franchise around by themselves. In the NBA its possible, or the NFL where a quarterback can pull a team out of mediocrity within a year or so.

I’ll average the first round pick WAR to get an idea of what a team who continually ‘tanks’, could expect to get out of first rounders for the next several years.

2011- 2.8
2012- 1.7
2013- 1.2

Again, this isn’t concrete information but it’s enough data to get a rough inference. If you ‘tank’ for several years, and get a high first round pick, you can expect to get a players who will average a WAR of about 3 (after about five years); the average WAR of a number one pick (using the data in the ’06-’16 chart) is a little better than 2.

So you’ve got a good shot to get a player considered decent or, at best, above average.

The following chart give some context on WAR for those unfamiliar.

WARvalues

Is it really worth ‘tanking’ in baseball? In, say, five years of mediocrity, how often can you expect to hit on a player in the early rounds (average 2.5+ WAR)? Again, in the first round (’06-’16) chart above, you’ve got a 50/50 shot. Is it worth driving your franchise into the ground with those kinds of odds?

Like I’ve said before, we are using a small amount of data that is on a sliding scale (the older the draft, the higher the WAR). Since it would take roughly 3-5 years for an organization to acquire draft picks that could break into the league and help push the team into championship contention, it’s not too far of a reach. Meaning you can expect your first couple of picks per year to start normalizing WAR after a couple of seasons…if they reach the majors at all at all.

So is ‘tanking’ worth it? Allegedly to the Marlins and Pirates, it seems to be. They have highly paid analysts and I’m a lowly blogger, so they know better than I do. But, with the information I’ve been able to acquire, it doesn’t seem as though stockpiling high picks will benefit an organization enough to risk losing fans, revenue, and respect in MLB in the short term.


What’s Next for the Pirates?

It’s been about several weeks since the Pirates parted ways with both Gerrit Cole and Andrew McCutchen, the former to Houston, and the latter to San Francisco. Most fans and analysts expect Josh Harrison to be next, and by the looks of it, that’s what he’d prefer.

Some would consider the Pirates to be rebuilding, while others suggest it may be somewhat of a retooling, hoping that some names that were expected to work out, but suffered setbacks either last year or culminating throughout the last several years (like Marte and Polanco) will bounce back or reach expectations.

That, coupled with players breaking through and reaching their potential (like Bell and Taillon), along with other young players (as though the Pirates have any other type of player now) like Trevor Williams, who showed a lot of promise last year, or Steven Brault, who pitched very well at AAA Indianapolis, perhaps the Pirates can field a winning team. It doesn’t hurt that they inked one of the top relievers in the game, Felipe Rivero, who emerged with a breakout season last year, to a four-year deal.

But most Pirates fans aren’t buying it. There was even a petition started on Change.org for “MLB to force Bob Nutting to sell the Pirates”, and to this date it has reached 59,456 signatures. Of course, there is basically no chance that this petition will actually result in anything.

Before both trades, the Pirates projected win total by FanGraphs was a whopping 81. After the Cole trade, it went to- er- stayed at, 81. It did move, though, once McCutchen was dealt, dropping from 81 to 78, which would still be three wins better than last year’s club, which might cause some to say that technically the team is improving, even if it’s by the most basic metric; of course, most would say that’s nonsense.

Last year, the Pirates were plagued by a multitude of problems, from Marte’s PED suspension, a plethora of injuries to, well, everyone, and even to Taillon missing time due to testicular cancer (which he brilliantly rebounded from, appearing as a starting pitcher just five weeks after surgery). Not to mention Jung-ho Kang’s off-field issues and inability to return to the team. The Bucs suffered a six-game setback from last year’s projections where they were expected to go 81-81. They finished six games below that total, winning 75 contests.

The Pirates were basically destined to fail last year. Now many believe that the Pirates are in store for the same fate this year after departing with two of the franchise’s marquee players.

A lot of the Pirates roster will look strikingly similar to last season, except for those received in the trades, which includes: 3B Colin Moran, P Joe Musgrove, P Kyle Crick, P Michael Feliz, among several other pitchers not involved in either of those trades, Nik Turley, Jack Leathersich, and Jordan Milbrath. It is unlikely that those players will make that big of an impact.

It’s possible, without any major injuries, the contributions the Pirates expected to receive last year will be more likely to reach fruition this year. If Gregory Polanco has the kind of breakout season people felt like he might have when the Pirates first acquired him, it’s possible for him to be a 5.0 WAR player. A litany of injuries prevented him from coming anything close to that last year, registering a 0.5 WAR, but with glimpses of power in his minimal contributions.

The same is true for Starling Marte. In 135 games for the Pirates in 2013, Marte posted a 4.8 WAR and 122 wRC+. We are all aware of Marte’s 80 game suspension following him testing positive for performance-enhancing drugs prior to the 2017 season. When he returned, he failed to be the player the Pirates hoped he’d be, and of course, he’ll have a lot to prove after his suspension in his first full season, but it isn’t completely insane to think he might experience a resurgence.

Josh Bell had a breakout season for the Bucs in his rookie campaign, perhaps positioning himself to be the next face of the franchise. Bell registered a 1.4 WAR last year and 113 wRC+, a .338 wOBA, and an OPS of .800. He hit for significantly more power than was expected of him, blasting 26 cannonballs, which was 12 higher than his 2016 total in AAA Indianapolis, playing nearly every game (159) in 2017. If Bell continued to grow this offseason, it’s entirely possible he’ll repeat in some statistical categories, like home runs wOBA, and OPS, and improve in others, like BABIP (.278), making him a very legitimate threat in the middle of the order.

Joe Musgrove, whom the Pirates acquired from Houston, showed that he may have the stuff for a solid third in the rotation type pitcher. Musgrove appeared in 38 games for Houston last year, starting 10 of them, posting a FIP of 4.38, an ERA- of 113, and an xFIP of 4.03. Those numbers are about in-line for a 5 starter, most likely, but PNC is one of the most “pitcher friendly” parks in baseball. Also, I’m not one to chalk up occurrences to magic, but Ray Searage has worked some serious voodoo in the past, and that could likely be the case here, especially with Musgrove who is by no means a lost cause pitcher to begin with. Additionally, Musgrove throws pretty hard, last year registering his fastball around 93.5 mph, his cutter a tick over 90, and a slider around 92.

Colin Moran will likely see the most time at 3B this season, as David Freese’s production levels just don’t quite reach what they should to warrant starting everyday, especially with a young player like Moran waiting in the wings. Jeff Sullivan wrote an article highlighting Colin Moran’s swing change, and some of the numbers were glaring. During seasons 2013-2016, Moran sat around 50% ground balls, and with the way baseball’s evolved, that’s not really a good thing. But in 2017, that number was strikingly different. Moran hit a ground ball only 34% of the time. With his decrease in ground balls came an increase in home runs. He had a previous high of 10 in AAA with far more at bats than his 18 in 2017 during his AAA campaign.

Lastly, Michael Feliz, another piece from the Astros, comes to Pittsburgh after having posted interesting numbers in 2017. Firstly, Feliz throws hard, reaching the high 90s with his fastball, averaging nearly 97 mph in 2017. He posted a FIP of 3.78, an xFIP of 3.58, and an xFIP- of 81. Feliz will likely be a strong complement to Felipe Rivero out of the pen.

Help will have to also come from players being called up from AAA for the first time (Meadows, who suffered setbacks last year on the DL, Keller, perhaps Bryan Reynolds, among others), but if some things break the right way, the Pirates may experience more success than originally anticipated. Don’t misunderstand me, I’m not saying the Pirates will be in contention for the NL Central this year, or even a Wild Card spot. I’m saying the potential is there for them to rebound from last year and finish the season above .500 at 82-80, especially if they can capitalize on a flailing Reds team, as well as in games against the largely inept NL East.

But barring a major outbreak by a lot of guys, the Pirates will likely be an average to below average team (somewhere along the lines of 75-87 to 79-83). It wouldn’t surprise me for them to finish better than last year, if not just for the sheer manpower versus last year, and hopefully not having to deal with such setbacks.

But when is it most likely the Pirates will be able to actually contend? The front office will say 2019 at the earliest, and there’s some credence to that.

Mitch Keller is projected to make his debut sometime this season, ranked 16th overall, and is the Pirates best prospect. Austin Meadows, ranked 45th, is expected to make his debut this season, as well. The last of the Pirates top 100 prospects, Shane Baz (67th) isn’t expected to make his debut until 2021, and hopefully, the Pirates are competing before then.

From the Pirates own top 30 list, several potentially important players are expected to debut in 2018, including Nick Kingham and Bryan Reynolds (the latter of whom came over in the McCutchen trade). 2019 will see a string of more players, and if they make an impact right away could yield a winning ball club, like Ke’Bryan Hayes and Cole Tucker. If you combine their potential productivity with the progression of guys that are already there and guys that are debuting this season, the Pirates could be returning to a similar place as their winning years, 2013-2015, in as little as two seasons.

Although it should be noted, the Pirates most successful years weren’t necessarily fueled by prospects. When Gerrit Cole debuted in 2013, one of the Pirates most successful seasons, he was really the only major prospect getting to play at that time, while the majority of the roster was comprised of veteran holdovers from the season before.

What that could potentially mean is that perhaps 2019 isn’t necessarily a possibility in terms of being competitive. Perhaps a more realistic timetable is 2021. By that time, Starling Marte will be in the final year of his contract at age 32, and likely his last year as a Pirate, and assuming he’s able to rebound, will be in the latter part of his most productive years. Gregory Polanco, if he’s able to reach his potential, will be in his Age 29 season and possibly at the peak of his ability. Moreover, by 2021, most of the players we’ve discussed will have had time to fully develop, like Josh Bell and Jameson Taillon, plus any guys coming up over the next two seasons.

All of these guys won’t pan out, but there’s a pretty good chance some of them will, and that’s the best an organization and fan base can hope for (except for the Astros who have seemed to hit the jackpot in every regard). The team will also need to be supplemented by veterans, and not just the cheap ones. For the Pirates to make a run and win between 2019-2023, the front office is going to need to spend more money than they were willing with Gerrit Cole and Andrew McCutchen.

There are a lot of hypotheticals in the Pirates future, but there truly is a lot to be excited about. I know it’s a difficult thing to request of Pirates fans, but this transition will require patience. That, and the front office attempting to provide more from the outside in free agency or big trades, and probably both. There is a lot the front office has done right in the past; unfortunately, though, there is also a lot its done wrong. We’ve seen the front office make some truly good trades, having the insight to know when guys have passed their peak and flipped them at the right time (like the acquisition of Rivero). But there will have to come a time where they send prospect packages for big-time players; if not, the Pirates may not see a real contender until ownership changes.


The Free Agent Value of Michael Pineda

Michael Pineda is having by far the best season of his career ever since he broke into the big leagues with Seattle in 2011. This is good news for Pineda who is in a contract year and looking to earn a huge payday on the open market this winter. However, this is bad news for teams, especially the Yankees, who have many questions surrounding their starting rotation with CC Sabathia also in a contract year and Masahiro Tanaka having the chance to opt out of his current contract after the season (although the latter seems unlikely at the moment). Pineda reminds me of one player in particular: former Yankee Ivan Nova.

Like Pineda, Nova has a fastball in the mid-90s and good secondary pitches, including a nasty curve and a change-up which he has begun to develop under Pittsburgh Pirates pitching coach Ray Searage, aka “the pitcher whisperer”. While Nova’s strikeout numbers have gone down, he has learned to pitch rather than just throw, which has resulted in fewer guys getting on base against him as well as his K/BB ratio going down, which I believe have been key contributing factors to his success in Pittsburgh. Also like Pineda, Nova hit the ground running, going 16-4 with a 3.70 ERA in 2011, and he was arguably the Yankees’ second-best starter behind Sabathia. However, as teams began to expose tendencies, combined with mounting injuries, Nova was never able to maintain the same level of success in New York.

The same could be said for Pineda, who missed two full seasons and most of 2014. Even after coming back in 2015, Pineda still struggled to maintain any level of consistency, after posting respectable numbers as a rookie. Now, Pineda has harnessed the power of his wipe-out slider and has become a ground ball pitcher (51.5%) to cope with the home-run haven that is Yankee Stadium. His K/BB ratio has gone down and his WHIP has dropped from 1.35 to 1.13 this season. The formula is simple: the fewer baserunners there are, the better a team’s chances are of winning. Also, like Nova, Pineda is using a change-up more in his pitching repertoire, to complement his slider. As a result, he has generated a 43.3% swing and miss percentage on pitches outside the zone, a 7% increase from last season. Additionally, they are close in age, since Nova was 30 when he signed his new contract, and Pineda will be 29.

The Pirates ended up giving Nova a three-year, $26-million contract last offseason. As long as Pineda continues to have success this season, he will also end up getting a similar deal. I predict he will end up staying with the Yankees for three years for somewhere in the range of$36-39 million simply because the Yankees will be desperate for starting pitching and may even pay a little bit over his market value to keep him. These types of deals are always risky, and many look to the Dodgers signing Rich Hill. However, Pineda has proven that he has always had the talent to pitch in New York and it seems that he finally has his head in the right place to help him reach his full potential. I believe that the Yankees will also re-sign Sabathia to a one-year deal in the range of $5-10 million, considering he will be 37 next season. If the Yankees manage to acquire another lefty or even sign Jake Arrieta, the Yankees starting rotation could be something to look out for in 2018.


The Pirates and the Groundball

The Pirates are no stranger to losing. In fact, they went 20 straight years without making the playoffs before 2013. That is painful. Before 2013, the last time they had made the playoffs was when Ronald Reagan was in office. However, they are becoming familiar with a new friend to end this pain of losing: the ground ball. Almost a year ago, Travis Sawchik wrote an intriguing book entitled Big Data Baseball which shed light on the ground ball as well as defensive shifting. So the fact that they lead all of baseball in GB% over the last three years came as no surprise. The surprise came when I looked at how much they lead by. The Pirates are, as a staff, leading the second-place team in GB% by almost 3% over the last three seasons. (51.1 GB%) While this number looks insignificant on the surface, putting it into some context makes all the more astonishing. The second-place GB% leader is the Dodgers at 48.3%. The last-place finisher in this category, the Dodgers’ LA counterpart, finished at 41.8%. This means that the range between the second-place team and the last-place team is 6.5% while the difference between the Pirates and Dodgers is 2.8%. Their rotation this year is set to be comprised of (with their GB% over the last three seasons):

  1. Gerrit Cole (48.6 GB%)
  2. Francisco Liriano (52.0 GB%)
  3. Jeff Locke (51.6 GB%)
  4. Jon Niese (51.2 GB%)
  5. Ryan Vogelsong (41.1%)

These five average out to a 48.9 GB%. This is including the clear outlier in Ryan Vogelsong who was recently acquired via the Giants and who will post better ground ball numbers under pitching coach Ray Searage. These five will pair up with save machine Mark Melancon and steadily growing Tony Watson, and the Pirates are set to be the under-valued ground ball juggernaut that they have been accustomed to being over the last three seasons. However a steady flow of grounders is only a real weapon if there are infielders to stop them.

Jordy Mercer will likely accumulate much of the starting shortstop action as the absence of Neil Walker will make Josh Harrison slide into the second-base position, leaving room for Jung-Ho Kang at third, pending his return from knee surgery. Getting rid of Neil Walker may prove wonders for the defense of the Pirates infield.

Mind you this fielding arrangement is a tentative one — if it comes to fruition, it will improve the overall defense of the Pirates dramatically.

This is the Pirates’ most commonly started infield for the 2015 season (with UZR values from 2015):

1B: Pedro Alvarez (-14.3)

2B: Neil Walker (-6.8)

SS: Jordy Mercer (1.5)

3B: Harrison/Kang (0.7)

This comes out to an average UZR of -4.7 per position, not doing the starters any justice. Now, here is the Pirates’ projected starting infield for the 2016 season (with UZR values from 2015):

(Projected infield from MLB.com)

1B: John Jaso (???- Only played five innings at first over career)

2B: Josh Harrison (0.2)

SS: Jordy Mercer (1.5)

3B: Jung-Ho Kang (1.6)

Granted Jaso is a mystery as to what he will do at first; we can assume, or hope, that he won’t be as bad as Pedro Alvarez. Even if he is below average, the defensive improvement will be significant from Alvarez. While they are losing power in their lineup, the defense may make up for some of the home runs they are losing from Alvarez. With Kang and Harrison on the rise and pitchers that are keeping the ball out of the air, the Pirates could be poised to have a fourth straight good season. While the Cubs look like they’re going to take the division, Pittsburgh could have a potential Wild Card run in their future.

(I am 15 and this is my first article. Open for criticism!)


First Blood, Retaliation, and Piling On

Pirates pitchers hit more batters than any team in the majors this year, 75. They also led in 2014. And 2013. That’s unusual. The only teams to have lead the majors in hit batters for three or more seasons since 1901 are the 1921-23 Phillies, 1930-32 Cardinals, 1938-40 Senators, 2002-04 Rays, and the 2013-15 Pirates.

The Pirates also got hit more than any team in the majors this year, with 89 hit batters. On one hand, that makes sense, given baseball’s Book of Exodus stance: A hit batter for a hit batter. On the other hand, and more significantly, it’s been a rare occurrence. Since 1931, only 14 teams have led their league in both pitcher and batter hit by pitches (1943 Giants, 1947 Dodgers, 1955 Dodgers, 1963 Reds, 1966 White Sox, 1968 Astros, 1980 White Sox, 1982 Angels, 1983 Expos, 1996 Astros, 2009 Phillies, 2012 White Sox, and 2013 and 2015 Pirates). Only 8% of teams in that time span have led their league in both hitting batters and getting hit. Pure random chance would put that figure above 9%. It just doesn’t happen very frequently.

I should interject that I fall in the anti-hit batters camp. I don’t like seeing anybody getting hit by pitches. Sometimes they shake it off. Sometimes they miss time. Sometimes it’s horrifying. But when you consider that there were 1,602 batters hit last year, 844 on fastballs, and the average fastball velocity is 92.1 mph—well, they’ve all got to hurt. As I’ve discussed in previous posts, some hit batters are clearly accidents, often occurring when a pitcher, ahead in the count, comes inside on a pitch and misses. But some undoubtedly are a form of message-sending, with the message coming as a hard object thrown at a speed that would constitute assault were it not on a baseball diamond. (A notable case occurred when Cole Hamels hit Bryce Harper in 2012, then justified it on the grounds of “that old-school prestigious way of baseball.”) Intentionally throwing at hitters to exact some sort of vengeance, sorry, is dumb. But how often does it happen?

The Pirates provide a good test case, since by leading the league in hit batters on both offense and defense, they provide a decently large sample size. Here’s how large: Pirates batters were hit 89 times, tying them for 11th among the 1,926 team-seasons since 1931. Their pitchers hit 75 batters, tying them for 43rd. If you saw a lot of Pirates games, you saw a lot of batters getting hit.

And you heard a lot of excuses. The Pirates encourage pitching inside, drawing the ire of other clubs. But Pirates backers also point to the large number of Pirates batters who get hit, and the need for the pitchers to “protect” Pirates batters. You hit my Andrew McCutchen, I hit your Joey Votto. That sort of thing.

How often does that happen? Is protection–really, retaliation–a significant factor in batters getting hit? To try to answer, I classified every hit batter in Pirates games last season—164 in total—into three different categories:

  • First Blood: Named in honor of the great American thespian Sylvester Stallone, the standard by which actors have been judged. (The New York Times memorably described Arnold Scharzenegger as “the thinking kid’s Sylvestor Stallone.”) First Blood (the initial work in Stallone’s Rambo oeuvre) occurs when a batter is the first one hit in a game or series.
  • Retaliation: As a follow-up to First Blood, Retaliation occurs when a batter is hit by the pitcher whose teammate was last hit.
  • Piling On: This occurs when a team, having already had a batter hit, suffers another, with no intervening Retaliation.

(I realize that I’m ignoring hit batters as retaliation for things like inside pitches, hard slides, and being Bryce Harper. Those don’t show up in game summaries, and besides, that’s more two-eyes-for-an-eye and therefore less acceptable.)

The timeframe is important here. Hit batters occur in the context of a game, but the casus belli can stretch out longer. Al Nipper hit Darry Strawberry with a pitch in spring training of 1987, allegedly in retaliation for Strawberry taking a slow trot around the bases after hitting a home run off Nipper in the prior year’s World Series. So I looked at hit batters in three settings:

  • The game being played
  • The series between the teams, to see whether retaliation carries over from one day to the next
  • The season series, to capture longstanding grudges.

For example, on July 12, the day before the All-Star break, the Pirates’ Arquimedes Caminero hit the Cardinals’ Mark Reynolds with a pitch in the tenth inning. The next time the two teams played was on August 11. The Cardinals’ Carlos Martinez hit Pirate Aramis Ramirez in the first inning. That’s First Blood for the game and series, but Retaliation for the season series, since the prior hit batter, albeit a month earlier, was a Cardinal. Two days later, Pirates catcher Francisco Cervelli was hit by a pitch from Lance Lynn in the first inning. That was First Blood for the game, but Piling On for both the series and season series, as it followed his teammate getting hit. The next time the teams played, on September 4, Pirates reliever Jared Hughes hit Reynolds with a pitch in the ninth inning. That counts as First Blood for the game and the series, Retaliation with respect to the season series. The following day, the Pirates’ Starling Marte was hit by Jaime Garcia in the second inning. That was First Blood for the day, Retaliation for both the series and the season series. In the bottom of the second, Charlie Morton hit Jon Jay. That’s Retaliation in the context of game, series, and season series.

(Another aside: I am opposed to the use of plunked as a synonym for hit by pitch. Plunk is what happens when you’re rearranging books on your bookshelf and a paperback falls from a high shelf and hits you in the shoulder, or when you’re walking in the woods and an acorn hits your head. A 92.1 mph fastball is not a plunk.)

You may be thinking: This is pretty stupid, categorizing hit batters, what’s the point? The point is that if the Pirates pitchers are hitting opposing batters for some sort of tribal/protection/vengeance thing, we should see a lot of Retaliation. If that’s nonsense, it’s not the case.

Say a team plays 19 opponents, as the Pirates did (every National League team, plus the American League Central). Let’s also assume that the team’s pitchers hit 75 batters, as the Pirates did, and the team’s batters were hit 89 times, again as the Pirates were. If hit batters are random, we’d expect the team to be throw 19 x 75 / (75 + 89) = 8.7 First Blood pitches and get hit by 19 – 8.7 = 10.3 such pitches in season series. Thereafter, the odds of a hit batter being Retaliation or Piling On would be 50/50, subject to the distributional difference between 75 and 89. So the team would log 33.2 Retaliation and Piling on hit batters, and get hit by 39.3 of each type of pitch. Again, this assumes that hit batters occur completely randomly.

Here are the actual totals:

This kind of refutes the self-defense argument, doesn’t it? A Pirates batter was hit by a pitch before an opponent was in 61 games, accounting for nearly 70% of the team’s hit batters. But Pirates pitchers drew first blood in 56% of their games as well. Overall, retaliation accounted for only 20% of batters hit by Pirates pitchers in games. Over the course of a series, when my hit batter today can result in your hit batter tomorrow, retaliation explains only 32% of Pirates opponents hit. Even with the most liberal definition of retaliation, when it can be spread over the weeks or months of a season series, it still accounts for just 43%, less than half of batters hit by Pirates pitchers. Not that it was different on the other side: Pirates hit in retaliation accounted for only 15% of hit batters in games, 33% in series, and 39% in season series. The majority of hit batters occurred without seeming provocation.

Let’s compare the results of the Pirates games to those of the random distribution presented above. For Pirates pitchers, a random distribution would be 9 First Blood, 33 Retaliation, and 33 Piling On. Actual figures: 9, 32, 34. For Pirates batters, a random distribution would be 10 First Blood, 39 Retaliation, and 39 Piling On. Actual figures: 11, 35, 43. Those distributions (1) are pretty close to random and (2) feature less retaliation than a random distribution would suggest.

So what does it mean? Well, retaliation definitely does occur. We saw it the National League wild card game, when Pittsburgh reliever Tony Watson pretty clearly hit Cubs pitcher Jake Arrieta on purpose, in response to Cervelli and Josh Harrison getting hit by Arrieta, resulting in the silly spectacle of the benches clearing. But the example of the Pirates’ regular season, when there were a lot of hit batters, shows that retaliation isn’t as common as either code-of-honor defenders like Hamels nor hand-wringers like I might think. The numbers instead suggest that hit batters are, in fact, pretty random. Which would seem to make intentionally hitting batters a really uninformed idea as well as a bad one.


The Myth of the Indestructible Catcher Tandem

In the world of sports, the catcher position is kind of weird. Catchers start each play out of bounds, facing a different direction than their teammates. On a more micro level, baseball’s most important in-bounds/out-of-bounds determination, the strike zone, isn’t static as it is other sports; it’s determined on every pitch, and the catcher has a role in making that determination. In a non-contact sport, they’re covered in protective armor. Those of us with lousy knees are in awe just of their ability to do all that squatting.

Catcher is also the only position on modern rosters where there is planned redundancy. Thirteen-man pitching staffs have more or less eliminated platoon tandems, but catching tandems persist. The Pirates don’t carry an extra center fielder to give Andrew McCutchen a rest in the second game of doubleheaders. The Nationals don’t have a second right fielder to play instead of Bryce Harper on day games after night games. The Yankees don’t roster a spare third baseman in case Chase Headley gets hurt or tossed from a game. But every team has to have two catchers, and each of them sees a decent amount of playing time. (The catchers for those three teams in particular, as we’ll see.)

Further, the impact of a catcher injury can be significant. A disabled catcher’s replacement could well be unfamiliar with his pitching staff and opposing hitters’ tendencies, impairing his ability to call a game. He may not know the league’s umpires and their interpretation of the strike zone. He might not be up to speed on his infielders’ shifting tendencies and how that may affect pitch selection and location. And his presence probably means extra work, and extra fatigue, for the team’s other catcher. Just ask a Boston Red Sox fan about the importance of healthy catchers. (That’s a rhetorical suggestion. I don’t recommend actually doing that, unless you want to hear a long exposition about the importance of good free agent signings, a reliable starting rotation, offensive production from your first basemen, keeping your closer and second baseman off the DL…really, it can go on for a while.)

This summer, while attending a Phillies-Pirates game during which the Pirates used both of their catchers, my friend wondered whether the Pirates had the skinniest catchers in the league. (Francisco Cervelli is listed at 6’1″, 205, Chris Stewart 6’4″, 210). While actually putting in the time to figure this out (the answer appears to be “yes,” if you can trust listed heights and weights), I noticed that Cervelli and Stewart had caught all but 17.1 innings for the Pirates in 2015. This was in August, but it remained the case for the entire year. Cervelli caught 1099.2 innings and Stewart 372.2. Combined, that represented 98.8% of all the Pirates’ defensive innings last year. This struck me as notable, as the Pirates had lost the durable Russell Martin to free agency over the winter, replacing him with Cervelli, who’d never played more than 93 major league games in a season previously. The Pirates are famous for their use of analytics, including monitoring player health, with an eye toward injury prevention. Maybe that’s working. Or maybe they’ve figured out something with skinny catchers. Either way, I wondered whether the Pirates’ tandem represented something unusual.

To check, I looked at every team’s catchers since the 1969 start of divisional play. Using this year’s Pirates as my model, I looked for teams for which the top two catchers caught 98.5% or more of all innings. Last year, the average team’s catchers caught 1,446 innings, so I was looking for teams for whom top two catchers were on the field for all but 21.2 innings, on average.

It turns out the Pirates weren’t unique. Brian McCann and JR Murphy caught every inning for the Yankees this year. Wilson Ramos and Jose Lobaton caught all but nine innings for the Nationals. Carlos Ruiz and Cameron Rupp were behind the plate for all but 18 innings for the Phillies. That’s about typical. Since 1969, there have been 240 teams whose top two catchers caught at least 98.5% of all innings during the season, or a little over five per year (closer to four and a half if you exclude strike-shortened seasons).

But totals don’t tell the whole story, since baseball’s expanded from 24 teams in 1969 to 26 beginning in 1977, 28 beginning in 1993, and 30 beginning in 1998. The graph below shows the percentage of teams, per season, with two catchers handling 98.5% or more of the workload. The overall average is 18.6%. There’s a very slight downward trend to the line–the slope is -0.03% (yes, I got the decimals right)–meaning that catchers have been becoming a little less durable over the years, but almost imperceptibly so. (I was tempted to say “a little less durable or managers are giving them more rest,” but other than the occasional Kyle Schwarber, who primarily plays another position but can catch in a pinch, teams just don’t carry three catchers any more, so rest for one catcher in a tandem means playing time for the other.)

(The outlier on the high side is 1994, when there were only 117 games played.)

Teams for which two catchers caught 98.5% or more of innings won, on average, 85 games during the non-strike-shortened seasons. That’s not super impressive, considering the selection bias inherent in this sort of analysis. Specifically, teams with two catchers handling virtually all of the time behind the plate are teams that not only avoid catcher injuries, but also have two catchers good enough that they’d want to have them there all year, contributing to overall team success. In 2014, for example, the Red Sox had three catchers with over 400 defensive innings, in part because none of them could hit: A.J. Pierzynski (540 innings, 71 wRC+), Christian Vazquez (458.1 innings, 70 wRC+), and David Ross (418.1 innings, 71 wRC+). (See, I told you not to ask a Red Sox fan about catchers.)

Still, 85 wins is decent, four games better than .500–that’s the Angels this year. Of the 213 teams for which two catchers caught 98.5% or more of innings in non-strike-shortened years, 77, or 36%, won 90 or more, which is generally good enough to get you into the postseason these days. So there’s certainly an advantage to getting all the work out of two catchers.

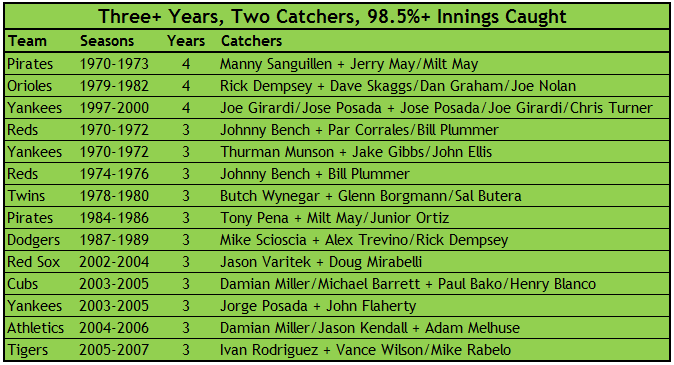
So has anybody cracked the code on keeping their two catchers healthy? I looked for teams that had three or more seasons in a row with two catchers handling 98.5% more of innings. If teams have a secret sauce, they should show up on this list with regularity:

Nope. The closest thing there is the Yankees, who had streaks with Thurman Munson in the 1970s and Jose Posada around the turn of the century. The only other teams to appear more than once are the Johnny Bench Reds and two iterations of the Pirates, over a decade apart and 30 years ago. There’s nothing in this table suggestive that it’s a matter of skill, rather than luck, to keep two catchers on the field all season. Specifically, these teams generally had an All-Star caliber No. 1 catcher who avoided injury with various guys in the backup role. That’s about it. No team has cornered the market on that formula.

So maybe that’s making the criteria too tough. Maybe I should be looking just at back-to-back 98.5%-plus inning performances. Given that, on average, 18.6% of teams had two catchers with 98.5% or more innings caught since 1969, random chance suggests that a team with two dominant catchers has about a one-in-five chance of repeating the following year, like flipping a coin that comes up heads 18.6% of the time. A rate of repeat significantly above that could indicate skill rather than luck. Of the 236 teams, 1969-2014, that had two catchers with 98.5% or more innings caught, 60 repeated the following year, or 25%. That’s not a statistically significant difference (using an N-1 chi-square test, if you were wondering). In other words, there’s no reason to believe that a durable catcher tandem is a matter of anything but good fortune.

So feel good about keeping your two catchers healthy this year, Yankees, Nationals, Pirates and Phillies. Especially the Pirates (111 wRC+) and Yankees (104 wRC+), who got above-average offensive performance from their catchers as well. (The 69 wRC+ Phillies and 62 wRC+ Nationals catchers were among the worst in baseball.) Just don’t assume you’ll be able to keep those two guys on the field all of 2016 as well.


The Pittsburgh Pirates and Two Missed Opportunities

1. The Pirates finished the year with a 98-64 record, the second best in all of baseball. That ties them with the 1979 and 1908 clubs for the third most wins in franchise history. (The 1909 Pirates won 110 and the 1902 club won 103.) The Pirates’ record, however, included a losing record against two of the worst teams in the game, the Cincinnati Reds (8-11) and the Milwaukee Brewers (9-10).

Let’s break that down. In games in which the Reds didn’t play the Pirates, they were 53-90. In games in which the Brewers didn’t play the Pirates, they were 58-85. So in their non-Pirates games, the two clubs combined for a 111-175 record, a .388 winning percentage. Had they played at that pace in their 38 games against the Pirates, they would have won .388 x 38 games = 15 games, losing 23. Turned around, the Pirates would have gone 23-15 against the Reds and Brewers.

The Pirates were 81-43 in their games that weren’t against Cincinnati or Milwaukee. Had they gone 23-15 against the two clubs–that, is had they been as successful as the rest of the teams in the majors were–their record would have been 104-58. That would have given the Pirates the best record in baseball. They would be enjoying four off days, looking forward to Wednesday’s wild-card game between the Cardinals and Cubs to see whom they’d face at home to kick off the Division Series on Friday.

2. The Pirates had four relief pitchers who pitched at least 60 innings: Mark Melancon, Tony Watson, Jared Hughes, and Arquimedes Caminero. Of the four, the pitcher with the lowest average leverage index when entering a game was Caminero, wasting his namesake’s leverage expertise.


A Quick and Dirty Attempt to Find Justin Upton’s Trade Value

Players like Justin Upton aren’t usually available at the trade deadline. Upton ranks 35th in wOBA (.353) and 47th in WAR (8.9) between 2013 to the present.  Also of note, Upton is in his walk year.

So, how many players like Justin Upton have been traded in the past 10 years? I did a quick scan of deals made in June and July since 2005 and I found four similar players who were traded in their walk years.

1. Hunter Pence PHI->SF, 2012 (68th wOBA (.347) and 68th WAR (8.7), 2010-2012)

2. Carlos Beltran NYM->SF, 2011 (19th wOBA (.379) and 74th WAR (8.1), 2009-2011)

3. Matt Holiday OAK->STL, 2009 (4th wOBA (.410) and 6th WAR (18.2), 2007-2009)

4. Mark Teixiera ATL -> LAA (15th wOBA (.396), 17th WAR (14.8), 2006-2008)

The Mets received Zack Wheeler in return for Beltran and the Athletics received Brett Wallace in return for Holliday. Baseball America ranked Wheeler the 55th best prospect pre-2011 and Wallace was ranked 40th pre-2009. In the following years, pre-2012 and pre-2010, respectively, Wheeler was ranked 35th and Wallace was ranked 27th.

The Mets and Athletics did well in each trade. They received top prospects and non-deteriorating prospects (they were not losing value as prospects during the year they were traded for). This is evidenced by the ranking of Wheeler and Wallace in the season following the trade.

The Pence and Teixiera trades did not net the Phillies or Braves prospects. Each team received a major league asset, using “asset” in the loosest of ways.

The Phillies received Nate Schierholtz, who had totaled .9 WAR up to that point in 2012. They also received Seth Rosin, an A Ball pitcher, and Tommy Joseph, a AA catcher. Essentially, they received a replacement level player and organizational depth. 

The Braves received Casey Kotchman. Kotchman had totaled 2.1 WAR in 2008 with the Angels before the trade. He managed 3.7 WAR the year before. The Braves could not expect Kotchman to live up to his past billing (he was Baseball America’s 6th ranked prospect pre-2005), however, from the most optimistic perspective, they may have expected him to be worth 2 WAR per year over the remaining four years of team control. At least this is my best attempt to get in the head of the Braves’ front office seven years after the fact.

Now, I’ll attempt to determine Justin Upton’s trade value based upon these past trades.

Kevin Creagh and Steve DiMiceli published a study on Point of Pittsburgh that analyzed the value and future performance of prospects based on their ranking in the Baseball America’s Top 100 (the ranking was determined by the final appearance of the prospect in the rankings).  The article has a lot of information you should read regarding the dollar value of prospects and their potential to bust, but for purposes of this article, I am concerned with a prospect’s projected WAR over the six years of team control.

Hitters that rank between #26-50, which is Brett Wallace, project to have an average of 6.8 WAR. Pitchers ranked between #51-75 project to have 3.8 WAR. However, based on Wheeler’s fast rise up Baseball America’s list, I’ll factor in that pitchers ranked between #26-50 project to have 6.3 WAR. The average of the two is 5 WAR, which is the value I’ll place on Wheeler at the time the Mets traded for him.

Justin Upton is not Matt Holliday, circa 2009, and he is not quite Carlos Beltran, circa 2011, although he is much less of an injury risk than 2011 Beltran (who would go on to spend time on the DL for the Giants in 2011). Therefore, I project that the Padres should receive between 3.8-5.0 WAR in return for Upton. The return should scale up towards the higher side of that projection based upon an active and interested market for Upton.

Below is a list of potential Upton suitors and their prospects that appeared in Baseball America’s Top-100 rankings before the season began. The rank of the prospect is in parenthesis, followed by their Creagh and DiMiceli projected WAR. The prospects in bold represent the most likely return for Upton, however I included some prospects that are possibilities, but project to have more WAR value than should be expected in return for Upton.

Mets – Brandon Nimmo (45, 6.3), Dilson Herrera (46, 6.3), Amed Rosario (98, 4.1). I excluded Kevin Plawecki (63) and Michael Conforto (80) due to their major league role and rise to prominence, respectively. 

Pirates – Jameson Taillon (29, 6.3); Austin Meadows (41, 6.8); Josh Bell (64, 5); Reese McGuire (97, 4.1)

Cubs – C. J. Edwards (38, 6.3); Billy McKinney (83, 4.1)

Giants – Andrew Susac (88, 4.1)

Orioles – Dylan Bundy (48, 6.3); Hunter Harvey (68, 3.4)

Rays – Daniel Robertson (66, 5); Willy Adames (84, 4.1)

Royals – Raul Mondesi (28, 6.8), Brandon Finnegan (55, 3.4), Kyle Zimmer (75, 3.4), Sean Manaea (81, 3.5)

Twins – Jose Berrios (36, 6.3); Nick Gordon (61, 5); Alex Meyer (62, 3.4)

Astros – Mark Appel (31, 6.3)

A.J. Preller should feel (somewhat) vindicated regarding the Justin Upton portion of his winter experiment if he can get a player he likes that resembles the players on this list. However, it remains to be seen if he will chase after something safer, like the Braves in 2008, or squander an asset like the Phillies in 2012. In that case, he’s probably better off going all-in on the Padres he built for 2015.


Hit Batters as Collateral Damage of Rising Strikeout Rates

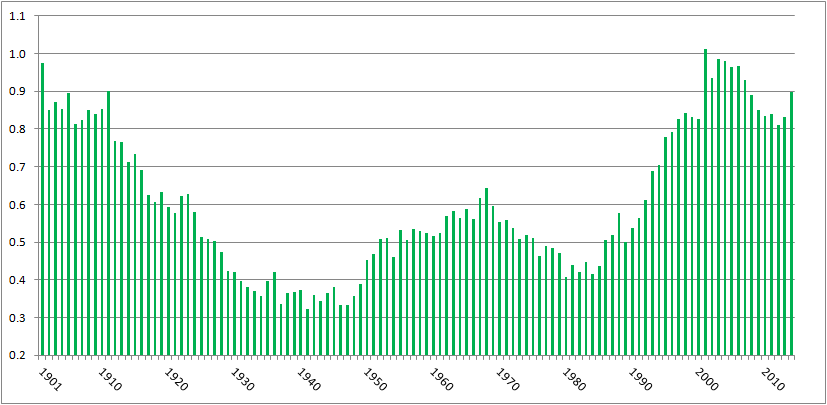
In the past, I’ve written about batters being hit by pitches–specifically, how the rate of hit batters is near all-time highs yet it hasn’t generated much, if any, outcry. Here’s a chart of hit batters per game, from 1901 (the start of the two-league era) to 2014:

HBP per game, 2001-2014

There were 0.68 hit batters per game in 2014, the eleventh-highest total over 115 years of two-league play. The top ten years, in order, have a 21st century slant: 2001, 2004, 2003, 2006, 1901, 2005, 2007, 2002, 2008, 1911.

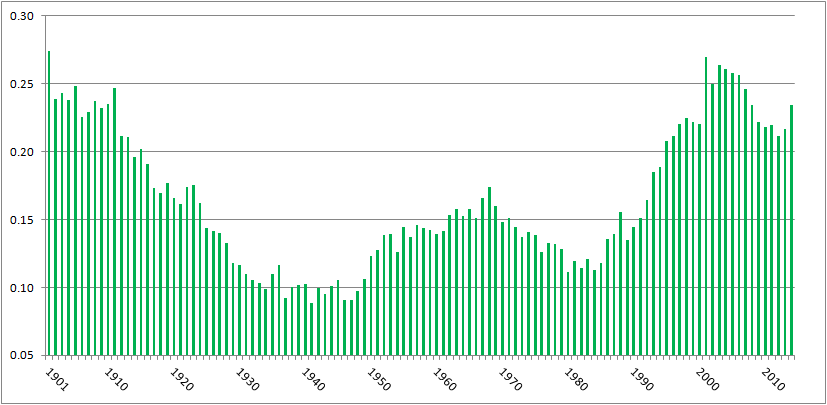
Or, pretty much the same chart, here’s hit batters per 100 plate appearances:

HBP per 100 PA

There were 0.898 batters hit per 100 plate appearances in 2014, the tenth highest amount in the two-league era. The ten top years are, in order, 2001, 2003, 2004, 1901, 2006, 2005, 2002, 2007, 1911, and 2014.

Commenter jaysfan suggested that the modern emphasis on going deep into counts has changed the number of pitches thrown per game, so perhaps hit batters per pitch haven’t changed much. It turns out the pattern still holds. Here’s a graph of hit by pitch per 100 pitches, using actual pitch counts from FanGraphs for 2002 to present, and Tom Tango’s formula of Pitches = 3.3 x plate appearances + 1.5 x strikeouts + 2.2 x walks for the preceding years:

HBP per 100 pitches

With 0.234 hit batters per 100 pitches, 2014 ranks 16th all time, behind 1901-1905, 1908, 1910, 1911, and every year from 2001 to 2007. Again, a pronounced millennial bias. (Source for all the above graphs: Baseball Reference and FanGraphs)

It’s clear, then, that we’re seeing batters getting hit at the highest rate in a century. I tried to figure out why, and came up dry. Left-handed batters, who face a wider strike zone than righties, aren’t leaning across the plate and thereby getting hit at a proportionately higher rate. HBPs are not inversely correlated to power, with pitchers more willing to pitch inside now to hitters who less frequently pull inside pitches down the line and over the fence. College graduates are slightly more likely to get hit by pitches than other hitters, but not enough to explain the change. Batters setting up deeper in the batter’s box, as measured by catcher’s interference calls, isn’t correlated to HBPs.

However, commenter Peter Jensen noted, “I don’t think there is any question that pitchers throw more to the edges of the strike zone when they are ahead in the count. This could be confirmed with a pretty simple Pitch Fx study. And if they pitch to the edge more they are also going to miss inside more (and outside more) so this could partially or even wholly account for why there are more HBPs in pitcher counts.”

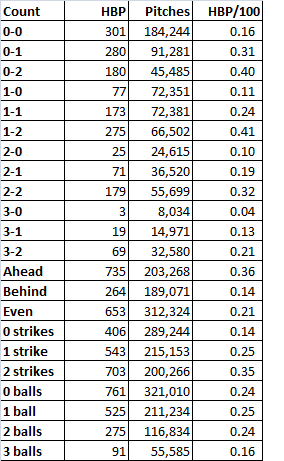
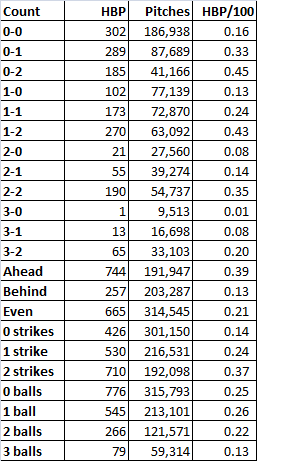
I did the PITCHf/x study Peter suggested. Using Baseball Savant data, I looked at hit by pitch by count, and as Peter found when he studied the data from 1997 and 2013, HBPs occur more when pitchers are ahead on the count. Here are the data from 2014:

2014 HBP

When the pitcher was ahead on the count, the batter was nearly three times as likely to get hit as when the batter was ahead. The most common counts for hit batters: 1-2, 0-2, and 2-2, and 0-1, all counts that encouraged pitchers to try to get batters to chase pitches on the border of the strike zone. Is this trend consistent? Baseball Savant’s data go back only to 2008, but using that season’s data, yes, the trend’s unchanged:

2008 HBP

Same thing. Batters are three times more likely to get hit when the pitcher’s ahead on the count, and the three most common HBP counts are two strikes with zero, one, or two balls, followed by 0-1.

So why the increase in hit batters? It appears that, as Peter implied, it’s because of the increase in strikeouts. Every three strike count requires a two strike count, obviously. In 2008, 22% of at bats went to 0-2 counts, 34% went to 1-2, and 29% went to 2-2. In 2014, those percentages had risen to 25%, 36%, and 30%, respectively, in line with the increase in strikeouts from 17.5% of plate appearances to 20.4%. The route to three strikes, which is being traveled more frequently, includes the four counts most likely to result in a hit batter. That’s why we’re seeing batters hit by pitches at rates not seen since before the first World War.

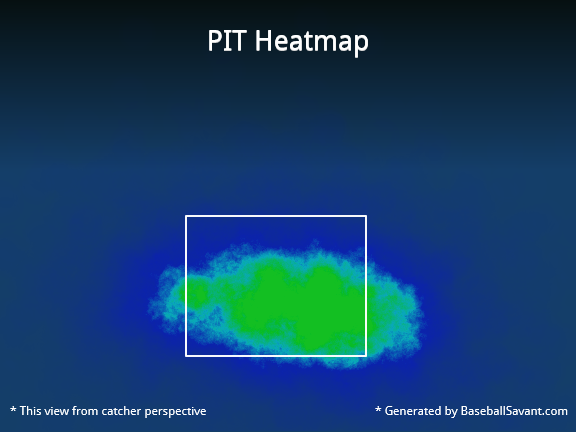
Here’s a graphical representation. In 2014, the Pirates led the majors in hit batters, handily, with 88. Here’s where Pirates pitchers threw on the hitters’ counts of 1-0. 2-0, 3-0, and 3-1:

Those greenish-yellow areas in the middle of the zone indicate that when the pitchers fell behind, they tended to locate their pitches in the strike zone. By contrast, check out the location for pitches thrown on 0-1, 0-2, 1-2, and 2-2 counts, when the pitcher could waste a pitch trying to get the batter to chase it:

That’s a much less concentrated blob, with a higher percentage of pitches outside the strike zone, where the batter can get hit.

As a final check, I ran a correlation between strikeouts per plate appearance and hit batters per plate appearance post-World War II. The correlation coefficient’s 0.82. That’s pretty high, suggesting a link between strikeouts and batters getting hit. Granted, correlation is not causation. But given that there’s an empirical link–to get to three strikes, you have to get to two, and batters with two strikes are at the highest risk of getting hit by a pitch–it’s enough to make me believe that while there are a lot of reasons more batters are getting hit by pitches, a major explanation is that hit batters are a consequence of rising strikeout rates.

CODA: If there were a day last season that I thought might’ve turned to tide on batters getting hit by pitch, it was Thursday, September 11. That day, there were 15 HBPs in 11 games. That doesn’t include the horrific fastball to the face that ended Giancarlo Stanton’s season; that pitch was a strike. A lot of stars got hit: Stanton, Mike Trout (twice), Yoenis Cespedes, Carlos Gomez, Jayson Werth. Tampa Bay’s Brad Boxberger hit Derek Jeter in the elbow. Had that pitch ended Jeter’s farewell tour, I really think it would’ve created an issue of rising HBP rates. Fortunately for Jeter and purveyors of Jeter memorabilia, it didn’t. But taking the 15 hit batters together, plus Stanton, and excluding two obvious retaliation jobs (Anthony DeSclafani hitting Gomez after Stanton got hit, Joe Smith hitting Tomas Telis after Trout got hit a second time), the fourteen hit batsmen occurred on six 0-1 counts (including Stanton and Jeter), three 1-2 counts, two 1-1 counts, and one count each of 0-0, 2-1, and 2-2. There was only one HBP with the batter ahead on the count, and ten occurred on the four counts identified here as the most dangerous for batters.