The Phillies are a remarkable 9-9 in what’s now 18 games in to the 2017 season. Why is that remarkable? Because of what they’re doing on both sides of the ball in the late innings.
The team, as a whole, has an ERA in the ninth inning of 7.36. Batters they’re facing in the ninth are OPS’ing a ridiculous .910 in the inning and the team has given up six home runs, nearly one in every ten plate appearances. By almost every metric, the ninth inning has been the worst for Phillies pitching. Only two teams have a worse ERA in the ninth and only three have a higher OPS. Of the two teams with a higher ERA, the Rangers gave up half of their ninth inning runs in two games, and no teams have given up as many home runs.
With those kinds of ninth-inning numbers you’d expect that the Phillies would have a high amount of losses attributed to blown saves. Of their 18 games so far, eight have come down to save situations, and they’ve given up runs in six of those games and blown four of them. What’s remarkable, though, is that they’ve only lost two of those games, and both games were where the Phillies didn’t get a chance to bat following the blown save. In the other two they’ve managed to come back and win.
So, how is it that they’ve managed to be at .500 over the first 18 games to start the season? Well, there’s some interesting anomalies in the late innings on the offensive side as well.
To counter the poor pitching in the 9th inning, the Phillies batters are excelling at hitting in the late innings. Through innings 7-9 as a team the Phillies are hitting .267/.336/.497 for an OPS of .834, which puts them at the best in baseball. To put that in perspective, that’s extremely close to what Edwin Encarnacion hit all of last year, .263/.357/.529 for an .886 OPS. Encarnacion finished 14th in MVP voting.
What can be interpreted from this is that the Phillies are doing something all good teams seem to do – take advantage of relief pitching. Indeed, their line against relievers so far this year is incredible at .282/.355/.531 for an OPS of .878, which is again the best in baseball. Mets slugger Yoenis Cespedes earned himself a contract with an annual average value of $27.5M over the next four years by hitting similarly to what the Phillies are doing to relief pitchers early on this year. He had a slash line of .280/.354/.530 for an OPS of .884.
For a team like the Phillies have been so far, every run seems to matter. This isn’t a situation where they’re scoring extra runs or giving up meaningless runs in blowouts. Over their 18 games they’re carrying a run differential of +7 runs. To drive home how important every run is in a typical Phillies game, 13 of their 18 games have been decided by less than two runs, and nine have been one-run games.
So to say that the late innings for the Phillies have been adventurous is a bit of an understatement. They’re giving up runs, but they’re scoring runs as well. Surely this is a somewhat unsustainable balancing act, but due to the fact that it’s happening on both sides of the ball, when it does in fact even itself out, the end results aren’t likely to be much different.
Similarly to a large portion of the FanGraphs community, I am a Philadelphia Phillies fan. I was born in South Jersey just 20 minutes away from the stadium and grew up watching every game. I was there for the tough times in the late 90’s / early 2000’s, and I was there for the glory days of 2007-2011. After an abysmal last few seasons of baseball in Philadelphia, we have finally seen some promise this season leading us to believe that better days are coming soon. One of the bright spots on the team so far this year has been Rule 5 pick, Tyler Goeddel.
After being selected in the first round of the 2011 MLB Rookie Draft, Tyler Goeddel began his professional career with the Tampa Bay Rays. Goeddel was drafted out of high school as a third baseman and for the first three years of his minor league career that would be the only position he played. In 2015, however, the Rays decided to move Goeddel to the outfield. His athleticism allows him to play all three outfield positions and that type of versatility is very sought after by big league clubs. While defense was never his problem, Goeddel’s bat didn’t develop as quickly as the Rays had hoped. He was a career .262 hitter with 31 home runs across four full seasons in the minor leagues. Ultimately the Rays made a tough decision and left him off their 40-man roster, knowing there was a great chance another team would select him in the Rule 5 Draft. Shortly after, the Phillies did just that and selected Goeddel with the first overall pick of the 2015 Rule 5 Draft.
The Philadelphia Phillies have historically been excellent in finding talent in the Rule 5 Draft. (2004 – Shane Victorino, 2012 – Ender Inciarte, 2014 – Odubel Herrera). In the early going, I (like most Phillies fans) was very skeptical as to whether or not Goeddel could follow in the footsteps of players like Shane Victorino and Odubel Herrera and become a valuable contributor to our big league team. Goeddel had a mediocre spring training but with no other serious competition in the corner outfield spots, there was no harm in keeping him around for a rebuilding year and seeing what the kid could do.
The beginning of Tyler Goeddel’s major league career could not have gone much worse. Take a look below at his stats through his first nine games:
In only 16 at-bats, Goeddel recorded only one hit (a single), and struck out a whopping eight times! Now obviously this is a VERY small sample size, and we should expect some struggles while adjusting to big league pitching. Up until this point, Goeddel has never seen pitching above the Double-A level. Now let’s take a look at his plate discipline stats over the same time frame:
O-Swing % – Percentage of time a batter swings on pitches outside the strike zone Z-Swing % – Percentage of time a batter swings on pitches inside the strike zone Swing % – Percentage of time a batter swings at a pitch, regardless of location O-Contact % – Percentage of times a batter makes contact with a ball when swinging outside of the strike zone Z-Contact % – Percentage of times a batter makes contact with a ball when swinging inside of the strike zone Contact % – Percentage of times a batter makes contact with the ball when swinging Zone % – Percentage of overall pitches thrown to batter that were in the strike zone
There is nothing noteworthy about his swing percentages as they are all just about equal to the league averages, but the contact percentages are quite alarming. Through his first nine games, Goeddel only made contact 53% of the time he swung his bat. Rather than just writing this off as a rookie being over-matched by big league pitching, I decided to dig deeper into these stats and figure out exactly where Goeddel was struggling. Check out the video below that I put together which basically sums up the beginning of Goeddel’s career in 30 seconds:
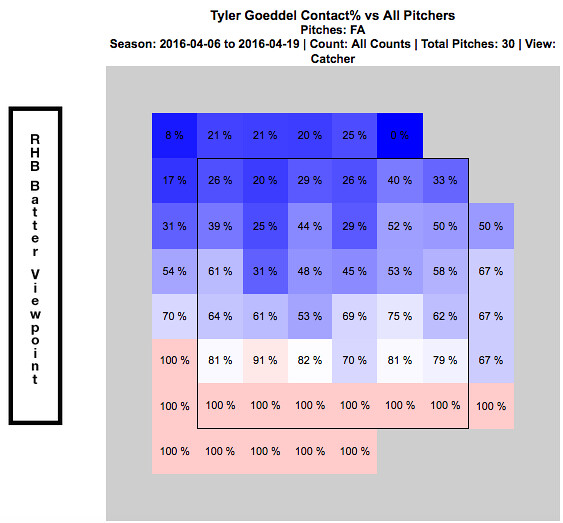
Whether or not you realized from watching the above video, every one of these swing and misses came on a fastball. They all also came in the upper portion of the strike zone. Just by watching Goeddel’s at-bats through this point of the season, it was clear as day to see opposing pitchers were attacking Goeddel with fastballs up in the zone. The chart below shows every fastball that was thrown to Goeddel over his first nine games. It is broken up by hot and cold zones and shows his contact percentage versus the fastball at every portion of the strike zone:
This chart verifies for us what we saw in the video…Goeddel really struggled to hit fastballs up in the zone to begin the season. At this point, everyone was frustrated. Tyler Goeddel was frustrated because he knew he was much more talented than his results thus far have showed. The Phillies organization was frustrated because they had such high hopes for Goeddel entering the season. And most importantly, the Phillies fans were frustrated and began questioning what the Phillies could possibly see in this guy. (Search for Tyler Goeddel’s name on Twitter and read old tweets from this time period if you don’t believe me!!)
An important thing to remember while looking at these stats, is that up until this point of his career Goeddel has been an every-day player. Not only is he adjusting to big league pitching, but he is also trying to adjust to not having consistent at-bats. Since the Phillies unexpectedly got off to such a hot start, an important decision needed to be made. On one hand, they have this young promising player who will need consistent at bats in order to show his true potential. But on the other hand, this team is surprisingly in the hunt in the NL East and may not want to allow Goeddel to go through his growing pains while they are competing for the division title. Eventually, a decision was made and manager Pete Mackanin started to put Goeddel in the every-day lineup. Below are some quotes from Goeddel at this time speaking of the decision:
“Getting regular playing time and the confidence [from that] is huge, but I try to get started a little earlier on my swing so I can be on time with the fastball. You need to hit the fastball if you want to play up here, obviously. I feel like I’ve made that adjustment and it’s been a huge help.” – Tyler Goeddel
“I didn’t play how I wanted to play in April. And I’m glad he’s (Pete Mackanin) giving me a chance, because I really didn’t play my way into a chance; he just gave it to me. So I’m trying to make the most of it.” – Tyler Goeddel
The video below (from 4/23/16) summarizes Goeddel’s early season struggles and the decision to give him more playing time:
The Phillies coaching staff deserves a lot of credit. They recognized early on that Goeddel was struggling with fastballs up in the zone and prior to this game really worked with him in that area and promised him more playing time moving forward. Here is a video of his next at bat in the game, where the pitcher tries once again to attack Goeddel with some high heat:
Goeddel responds with another base hit and his first RBI of the season. Take a look below at how his stats over his next seven games compare to his stats from his first nine games.
You can very easily see that Goeddel drastically improved his contact percentage over this time frame, which resulted in a huge drop in his strikeout rate. The video below is from 5/8/16, right after the stretch of stats we just evaluated. Goeddel had a big hit late to tie the game for the Phillies and later came in to score the winning run.
As you could see, the hit came on a high fastball. A few weeks ago, Goeddel could not touch this pitch…but all of a sudden he is beginning to prove that he can. The next video is from after that game. Tyler discusses the adjustments he has made and also how playing every day has contributed to his recent success:
This hit was the start of a new Tyler Goeddel. Pitchers continued to attack him with fastballs up in the zone and Goeddel really started to make them pay. This is what he did to a Brandon Finnegan fastball just a few days later:
Ever since that hit on May 8th against the Marlins, Goeddel has been the player the Phillies could have only hoped he one day would become. He has flashed signs of brilliance in just about every game since that have Phillies fans drooling over what the future outfield could look like. Even though he has made adjustments and is seemingly now catching up to big league fastballs, opposing pitchers continue to test him. Check out the video below that I put together showing what Goeddel has done to fastballs in the upper portion of the strike zone over the last few weeks.
As you can clearly see, this is a different player than we saw early on in the season. Take a look at how his recent stats compare to those early on:
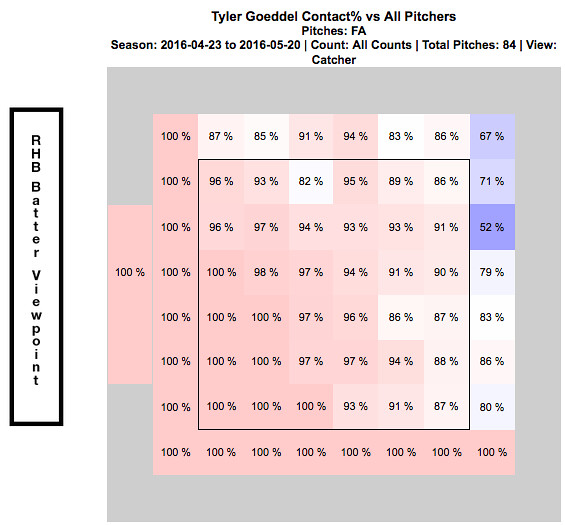
Goeddel’s contact percentage over his first nine games was only 53%. Over his last 10 games, it is 91%. That is an incredible difference and clearly his adjustments are paying off. In turn, his improved contact has led to a strikeout percentage of only 5.4% over his last 10 games. The chart below shows how Goeddel has fared against the fastball since he noted his adjustments on April 23, 2016.
Now go back up to the top of the article and compare this chart to what it looked like at the beginning of the season. More consistent at bats have clearly translated into him catching up to the fastball and the results thus far have been phenomenal. I have to admit that I was a doubter early on, but I am now completely on board the Tyler Goeddel bandwagon. This kid is only 23 years old and the fact that he was able to so quickly make an adjustment like this and immediately see results is remarkable. Now that he is having some success, opposing pitchers will start to change their game-plan against him. While the pace he is on now may not be sustainable over the course of a full season, I am confident that Goeddel will continue to make the necessary adjustments and help this Phillies team continue to find ways to win ball games. Although the video below doesn’t exactly relate to his success at the plate, I had to throw this in here and it is a must watch if you have not seen it already:
The last video I will show features Goeddel’s post game interview after this throw:
Recent Quotes:
“It’s exciting. Coming to the field everyday I’m expecting to see myself in the lineup. That’s a feeling I didn’t have last month. It’s a lot more relaxing, less stressful.” – Tyler Goeddel
“It was definitely a big adjustment, going from playing everyday my whole career to having a specific role, and then not performing well in my role, it was a little tough. But, you know, they’re giving me an opportunity now and I feel like I’m playing better, which is nice. I’m happy for myself. I always knew I could play up here, but I needed some results to prove it to myself. I’m glad, finally, there are some results to show.” – Tyler Goeddel
I love how confident Goeddel is when he speaks of his game and I am so glad the numbers back him up. I continue to be blown away watching him play every day, especially due to the fact that he has only been playing the outfield for one year.
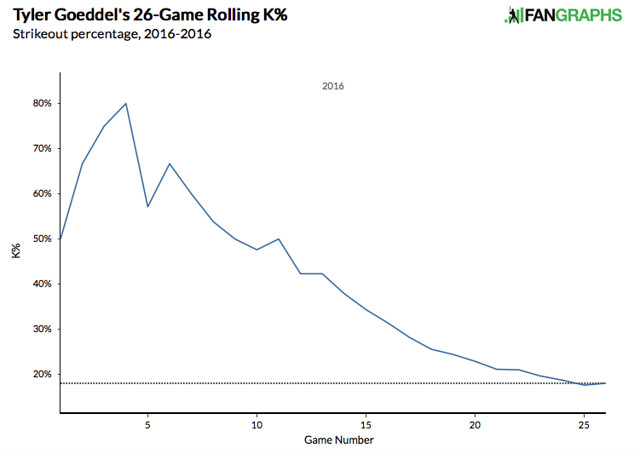
Lastly, I want to show a few graphs. The first one shows a rolling total of Goeddel’s strike out percentage so far this season. The statistics earlier show you that it has decreased, but this graph makes it much easier to see his progression:
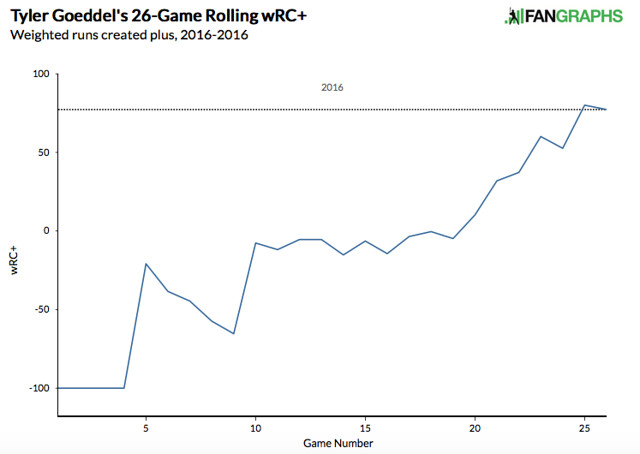
The next graph is another rolling total showing how Goeddel’s wRC+ has progressed throughout the season. For those of you who are unfamiliar with the stat, wRC+ stands for weighted runs created plus. It attempts to quantify a player’s offensive value in terms of runs. An average wRC+ is 100. Check out how Goeddel’s wRC+ has improved throughout the season:
What do you think, Phillies fans? Can Tyler Goeddel keep this up? Is the Tyler Goeddel that we have seen over the last few weeks the real Tyler Goeddel? Are you ready to hop on the bandwagon yet or do you need to see more from him to believe? Only time will tell, but I’m buying into the hype and am excited to see what the future holds for this promising young player.
In the world of sports, the catcher position is kind of weird. Catchers start each play out of bounds, facing a different direction than their teammates. On a more micro level, baseball’s most important in-bounds/out-of-bounds determination, the strike zone, isn’t static as it is other sports; it’s determined on every pitch, and the catcher has a role in making that determination. In a non-contact sport, they’re covered in protective armor. Those of us with lousy knees are in awe just of their ability to do all that squatting.
Catcher is also the only position on modern rosters where there is planned redundancy. Thirteen-man pitching staffs have more or less eliminated platoon tandems, but catching tandems persist. The Pirates don’t carry an extra center fielder to give Andrew McCutchen a rest in the second game of doubleheaders. The Nationals don’t have a second right fielder to play instead of Bryce Harper on day games after night games. The Yankees don’t roster a spare third baseman in case Chase Headley gets hurt or tossed from a game. But every team has to have two catchers, and each of them sees a decent amount of playing time. (The catchers for those three teams in particular, as we’ll see.)
Further, the impact of a catcher injury can be significant. A disabled catcher’s replacement could well be unfamiliar with his pitching staff and opposing hitters’ tendencies, impairing his ability to call a game. He may not know the league’s umpires and their interpretation of the strike zone. He might not be up to speed on his infielders’ shifting tendencies and how that may affect pitch selection and location. And his presence probably means extra work, and extra fatigue, for the team’s other catcher. Just ask a Boston Red Sox fan about the importance of healthy catchers. (That’s a rhetorical suggestion. I don’t recommend actually doing that, unless you want to hear a long exposition about the importance of good free agent signings, a reliable starting rotation, offensive production from your first basemen, keeping your closer and second baseman off the DL…really, it can go on for a while.)
This summer, while attending a Phillies-Pirates game during which the Pirates used both of their catchers, my friend wondered whether the Pirates had the skinniest catchers in the league. (Francisco Cervelli is listed at 6’1″, 205, Chris Stewart 6’4″, 210). While actually putting in the time to figure this out (the answer appears to be “yes,” if you can trust listed heights and weights), I noticed that Cervelli and Stewart had caught all but 17.1 innings for the Pirates in 2015. This was in August, but it remained the case for the entire year. Cervelli caught 1099.2 innings and Stewart 372.2. Combined, that represented 98.8% of all the Pirates’ defensive innings last year. This struck me as notable, as the Pirates had lost the durable Russell Martin to free agency over the winter, replacing him with Cervelli, who’d never played more than 93 major league games in a season previously. The Pirates are famous for their use of analytics, including monitoring player health, with an eye toward injury prevention. Maybe that’s working. Or maybe they’ve figured out something with skinny catchers. Either way, I wondered whether the Pirates’ tandem represented something unusual.
To check, I looked at every team’s catchers since the 1969 start of divisional play. Using this year’s Pirates as my model, I looked for teams for which the top two catchers caught 98.5% or more of all innings. Last year, the average team’s catchers caught 1,446 innings, so I was looking for teams for whom top two catchers were on the field for all but 21.2 innings, on average.
It turns out the Pirates weren’t unique. Brian McCann and JR Murphy caught every inning for the Yankees this year. Wilson Ramos and Jose Lobaton caught all but nine innings for the Nationals. Carlos Ruiz and Cameron Rupp were behind the plate for all but 18 innings for the Phillies. That’s about typical. Since 1969, there have been 240 teams whose top two catchers caught at least 98.5% of all innings during the season, or a little over five per year (closer to four and a half if you exclude strike-shortened seasons).
But totals don’t tell the whole story, since baseball’s expanded from 24 teams in 1969 to 26 beginning in 1977, 28 beginning in 1993, and 30 beginning in 1998. The graph below shows the percentage of teams, per season, with two catchers handling 98.5% or more of the workload. The overall average is 18.6%. There’s a very slight downward trend to the line–the slope is -0.03% (yes, I got the decimals right)–meaning that catchers have been becoming a little less durable over the years, but almost imperceptibly so. (I was tempted to say “a little less durable or managers are giving them more rest,” but other than the occasional Kyle Schwarber, who primarily plays another position but can catch in a pinch, teams just don’t carry three catchers any more, so rest for one catcher in a tandem means playing time for the other.)
(The outlier on the high side is 1994, when there were only 117 games played.)
Teams for which two catchers caught 98.5% or more of innings won, on average, 85 games during the non-strike-shortened seasons. That’s not super impressive, considering the selection bias inherent in this sort of analysis. Specifically, teams with two catchers handling virtually all of the time behind the plate are teams that not only avoid catcher injuries, but also have two catchers good enough that they’d want to have them there all year, contributing to overall team success. In 2014, for example, the Red Sox had three catchers with over 400 defensive innings, in part because none of them could hit: A.J. Pierzynski (540 innings, 71 wRC+), Christian Vazquez (458.1 innings, 70 wRC+), and David Ross (418.1 innings, 71 wRC+). (See, I told you not to ask a Red Sox fan about catchers.)
Still, 85 wins is decent, four games better than .500–that’s the Angels this year. Of the 213 teams for which two catchers caught 98.5% or more of innings in non-strike-shortened years, 77, or 36%, won 90 or more, which is generally good enough to get you into the postseason these days. So there’s certainly an advantage to getting all the work out of two catchers.
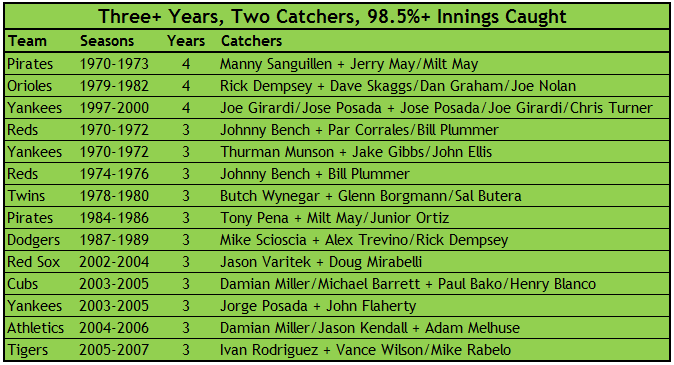
So has anybody cracked the code on keeping their two catchers healthy? I looked for teams that had three or more seasons in a row with two catchers handling 98.5% more of innings. If teams have a secret sauce, they should show up on this list with regularity:
Nope. The closest thing there is the Yankees, who had streaks with Thurman Munson in the 1970s and Jose Posada around the turn of the century. The only other teams to appear more than once are the Johnny Bench Reds and two iterations of the Pirates, over a decade apart and 30 years ago. There’s nothing in this table suggestive that it’s a matter of skill, rather than luck, to keep two catchers on the field all season. Specifically, these teams generally had an All-Star caliber No. 1 catcher who avoided injury with various guys in the backup role. That’s about it. No team has cornered the market on that formula.
So maybe that’s making the criteria too tough. Maybe I should be looking just at back-to-back 98.5%-plus inning performances. Given that, on average, 18.6% of teams had two catchers with 98.5% or more innings caught since 1969, random chance suggests that a team with two dominant catchers has about a one-in-five chance of repeating the following year, like flipping a coin that comes up heads 18.6% of the time. A rate of repeat significantly above that could indicate skill rather than luck. Of the 236 teams, 1969-2014, that had two catchers with 98.5% or more innings caught, 60 repeated the following year, or 25%. That’s not a statistically significant difference (using an N-1 chi-square test, if you were wondering). In other words, there’s no reason to believe that a durable catcher tandem is a matter of anything but good fortune.
So feel good about keeping your two catchers healthy this year, Yankees, Nationals, Pirates and Phillies. Especially the Pirates (111 wRC+) and Yankees (104 wRC+), who got above-average offensive performance from their catchers as well. (The 69 wRC+ Phillies and 62 wRC+ Nationals catchers were among the worst in baseball.) Just don’t assume you’ll be able to keep those two guys on the field all of 2016 as well.
With the trade deadline approaching (ed. note: so long!), we have players donning their current affiliation’s uniforms for a final game. Aside from a few tears shed by baseball’s infantile devotees (ages 3 and up), these will be business-like transactions; it’s the buying and selling of goods.
For this article, we’ll be looking at pitcher performances in their final game before being traded. The last game a pitcher pitches for a team is a relatively inconsequential event. What I mean is that teams searching for that piece to propel their momentum in the efforts of a playoff push know what Cole Hamels is worth. His value did not take a significant ding after two abysmal starts when he totaled 6.1 IP, 20 H, 14 ER, and 5 K (July 10th and 19th), and neither did it skyrocket after his performance on Saturday. You know what happened, but let me recap: In his last outing for the Philadelphia Phillies, Hamels threw a no-hitter against the Cubs – the very team who he could have ended up with. That’s probably already a better idea for an article – pitchers that were traded to the team they just faced – but I’ve started the research for the article I’m currently writing, an article that, much like my night, is, for lack of a better word, aimless. My one year old son is asleep, my wife went to a birthday dinner, I’m in my underwear watching X-Men 2: X-Men United (for the umpteenth time), drinking Diet Hansen’s Tangerine Lime, and thinking about Hamels’ almost 100-point game score in what was his last game as a Phillie.
For the purpose of this article, but mainly to eventually get some sleep tonight, we’re going to limit the research to this current decade (2010 being the starting point), and for pitchers that went to teams that made the playoffs only. Cole Hamels’ no-hitter scored a 98 on Bill James’ game score calculation, with the only two blemishes keeping it from being a nice even 100, being the two walks he issued over the 9 IP. There have been two pitchers traded already, Scott Kazmir and Johnny Cueto, and they each posted game scores north of 70 (73 and 78 respectively). The starting pitcher talent level that could swap hands this year is pretty special. It’s hard to remember the last time there was a talent pool this deep or when there were this many teams in viable contention to make playoff pushes, so it’s no surprise that we’ve seen a couple of really, really well-pitched games. But in terms of single-game performances, how good is a game score of even Kazmir’s 73 in the final game before a player gets swapped? You’d have to go back to 2010 to find a game score as high as 70, which was what Cliff Lee scored for the Mariners after dominating the Tigers over 8 IP. (Zack Greinke had a 72 before he was traded to the Angels in 2012, but they didn’t make the playoffs.)
Below you’ll find a table with players that were traded close to the deadline to teams that made the playoffs from 2010 – 2014. Next to their name you’ll find the game score of their last game pitched with the team that traded them (organized by game score) compared to the average game scores they posted with the team that traded them and the team they were traded to. It’s highly likely that, with so much going on tonight – X-Men just ended – I missed one or two or three starting pitchers. ((Also spoiler alert (Not about X-Men which I’ve seen close to 100 times now): There are no correlations between that one game score and their value for the rest of the season because a pitcher is the pitcher they’ve been for the body of their work)).
(Game Score Equation courtesy of Bill James: 50 + (outs recorded) + (2*IP after 4th inning) + (1*K) – (2*H) – (4*ER) – (2*Unearned Runs) – (1*BB) = Game Score)
**GmScA = Game Score Average
Player
Date/Opp
Game Score
GmScA Before Trade
GmScA After Trade
Cliff Lee
07-04-10/DET
70
65.1
56.3
Ricky Nolasco
07-03-13/ATL
64
53.1
53.4
Paul Maholm
07-29-12/STL
63
52.6
55.1
Jason Hammel
07-04-14/WSH
59
59.6
49.9
Anibal Sanchez
07-22-12/PIT
59
53.5
51.7
Jon Lester
07-25-14/TBR
58
60.3
61.7
Jake Peavy
07-25-13/DET
57
53.8
54.0
Ryan Dempster
07-25-12/PIT
56
60.9
48.3
Doug Fister
07-26-11/NYY
56
55.3
64.0
Edwin Jackson
07-24-11/CLE
54
51.2
50.1
David Price
07-30-14/MIL
53
61.5
58.2
John Lackey
07-26-14/TBR
51
54.5
49.3
Jake Peavy
07-22-14/TOR
41
49.1
59.8
Jeff Samardzija
06-28-14/WSH
37
57.2
60.6
Roy Oswalt
07-24-10/CIN
27
57.6
66.3
Justin Masterson
07-07-14/NYY
22
45.5
40.2
Edinson Volquez
08-23-13/CHC
18
43.4
51.8
Joe Saunders
08-20-12/MIA
3
49.4
50.7
Average
47.2
54.6
54.5
I know that 18 games is a small sample size, but 47.2 is a pretty sizable drop from averages of 54.6 and 54.5. Perhaps it’s the uncertainty that these players are facing with the looming trade deadline that causes a dip in performance, or perhaps this is a silly, SILLY thing to look into and it means absolutely nothing!!!
But back to this year’s impressive pool of starting pitchers that were rumored to be available. Let’s say all the top pitchers that are thought to be moving have thrown their last game for their respective teams. Here’s a look at a table just like the one above but for the pitchers thought to be moving this year. (This is assuming the caveats that all the players have pitched their final game for their respective teams and that they will all be traded to or have been traded to teams that will make the playoffs).
Player (Traded to)
Date/Opp
Game Score
GmScA before trade
Cole Hamels (Rangers)
07-25/CHC
98
55.3
Johnny Cueto (Royals)
07-25/COL
78
62.1
Mike Leake
07-28/STL
76
55.0
Scott Kazmir (Astros)
07-18/MIN
73
60.3
Jeff Samardzija
07-28/CWS
54
54.3
David Price
07-28/TBR
40
60.3
Mat Latos (Dodgers)
07-26/SDP
49
51.3
Average
66.9
56.9
That’s a lot of 70s. There are also three pitchers in this group with average game scores of over 60, which is one more than the number of pitchers that went to playoff bound teams from 2010 – 2014. After all this, I wish there was a way to make this post more interesting, or show some correlation between any of these numbers, but there’s simply not! It was a thought and I ran with it. One game does not make a player, but I think in some TINY way, it is another example of what we know to be true: there is some serious talent that’s about to switch hands – get excited.