Archive for paul goldschmidt

Paul Goldschmidt Has a Pop-Up Problem

When we were growing up, my dad would sometimes refer to my sister and me as ingrates. I always had a sneaking suspicion that statement was ruthless. I was young and under the assumption that he provided us everything we needed and wanted because that was what he was designed to do. In a sense, that perception of him probably does reflect the “ungratefulness” that young children tend to posses, innocent as it may be, what with a child’s inherently feeble comprehension of interpersonal relationships. I am now the parent of a two-year-old boy and just the other night he saw a commercial for a Power Wheels Jeep Wrangler that elicited the following outburst:

“I want to go in there!”

“I want one!”

Finally he turned to peer into my eyes and, in order to accentuate the severity of his next mandate, he raised his index finger and spoke;

“Daddy, better buy me one.”

His tone became dramatically more somber than it had been for the first two exclamations, and it made me laugh the hardest. I am certain I was the narrator of many statements similar to this as a kid, but the reality is, when kids are given everything they want, it’s up to the parent to understand that if there is a perceived lack of gratitude, it is a direct byproduct of the parent’s efforts to make them happy or even to keep them alive.

Lately I’ve been thinking of how I can be really ungrateful for even truly fine baseball seasons. Even some All-Star seasons disappoint me, and I know I’m not alone. If Mike Trout was in the middle of putting up a 5-win season, we’d all be talking about what could be wrong with Mike Trout. When players set the bar so ridiculously high we tend to hold them to that standard for better or worse. As an actual example, it’s completely understandable to be disappointed by Bryce Harper’s 2016 season after last year’s masterpiece. The reality is, however, that he’s 23 and has currently produced 3.4 WAR. His baserunning and defense have been positives and he’s compiled over 20 home runs and 20 stolen bases while hitting 14 percent better than league average; that’s damn fine and yet it’s still a damn shame.

Paul Goldschmidt, meanwhile, is hitting .301/.414/.494 and has accrued 4.7 WAR and might surpass 30 SB this year. His 136 wRC+ is still great even if it’s not quite the 158 he’s put up over the last three seasons. So why do I feel the loathsome inklings of disappointment bubbling inside of me? Firstly, and admittedly shallow of me, I like my Goldschmidt with more extra-base hits. For the first time in his professional career, at any level, Goldschmidt’s ISO starts with a number under 2. It’s possible he has a nice final week and brings that number up into the .200 range, but there are still some potentially concerning blips in his batted-ball profile that could portend of further decline in production. What I’m referring to most specifically, as the title suggests, is that Paul Goldschmidt has developed a pop-up problem.

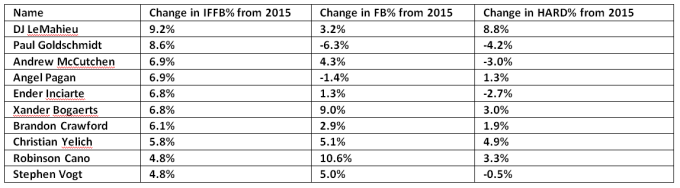
From 2011 through 2015, Goldschmidt’s cumulative IFFB% was 4.8%. This year it sits at 14%. He has 17 IFFB this year, which is the same amount he had in the three previous seasons combined. Pop-ups aren’t good as they’re essentially as productive as a strikeout. Here are the 10 players with the biggest increases in IFFB% in 2016 compared to 2015 among qualified hitters in both years.
top-10-chart

I’m not suggesting there’s a positive correlation between popping up and performance, but it’s easy to make sense of some of the names that appear on this list. If you watched Josh Donaldson break down his swing on the MLB Network, you know that a lot of players are thinking about not hitting the ball on the ground because damage is done in the air. Did you know that DJ LeMahieu, at the time of this writing, has a higher slugging percentage than Goldschmidt? That’s bonkers. The league’s slugging percentage last year was .405, and this year it’s .418, but this group of players, minus Goldschmidt, have added, on average, 21 points to their slugging percentage, and part of that, for this group, has to be chalked up to putting more balls in the air.

popupsimprove

What I’m hoping to highlight is that what is even more troublesome for Goldschmidt is that he is the only player in this top 10 who had an increase in their IFFB% while also seeing his fly-ball rate and hard-hit rate drop.

goldschmidtpopsdown

So I have what could be an insultingly obvious hypothesis: since Goldschmidt has long been a quality opposite-field hitter, I am theorizing that pitchers are exploiting him with more fastballs up and in where he can’t quite get his hands extended. A cursory glance at his heat map vs. fastballs in 2015 and 2016 reveals a minor shift in approach by the league.


 goldschmidt-fb-2015goldschmidt-fb-2016

Besides the obvious, which is that pitchers are avoiding the zone even more than they had before, we can see just a bit more red in the specific zone I was referring to. It’s not so glaring or even enough information to make any conclusions, so let’s see if that area is where pitchers are getting Goldy to pop up. On the year, per Brooks Baseball, he has 22 pop-ups, 19 from fastballs and three from offspeed pitches. The 17 that are classified as IFFB by FanGraphs are plotted in the graph below.homemade-heatmap
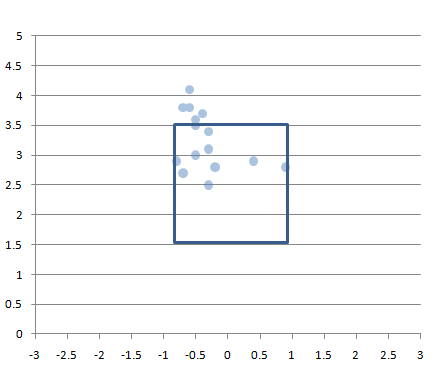
*the two pitches towards the outside corner (for Goldschmidt) are sliders.

However, it’s not as if pitchers have previously avoided throwing Goldschmidt up and in; it just appears, despite his overall swing rate being at a career-low 39%, he’s upped his swing rate against fastballs by over five percentage points in that specific area just above 3.5 ft. And that area has the largest concentration of his pop-ups.  Looking at the entire area middle/up/and in to Goldschmidt, he has increased his swing rate from 57.2% in 2015 to 60.7% in 2016 while staying away from lower pitches in general. It’s a philosophy that is being echoed throughout baseball right now, and it is not at all a bad plan, but it has caused him, either deliberately or due the effect of swinging at these pitches more often, to go to the opposite field this season less than he ever has. This also is not necessarily a negative shift in regards to a batted-ball profile, but from 2013 – 2015 Goldschmidt was the fifth-most productive hitter in baseball going the other way, and in 2016 he’s 33rd. That represents a drop in wRC+ from 204 to 158, and from a .729 SLG (.329 ISO) to a .647 SLG (.255 ISO). I’ve long since regarded Goldschmidt to be in the same tier of hitters as Trout, Votto, Cabrera, and pre-2016 McCutchen, and it would be a shame for him to move away from a facet of his game that enables him to produce at that elite level.

At the end of this season I don’t think I’ll actually be all that worried about Goldschmidt; I can reconcile a 136 wRC+, even if it would feel a little disappointing. I wrote about Paul Goldschmidt last year and I wasn’t worried then, either. But I do think if I’m going to take a 136 wRC+ for granted I should place that appreciation toward the catalyst for this change in Goldschmidt’s performance, and a lot of that credit has to go to the pitchers who have induced 17 IFFB from a player who only averaged 5.7 over the last three seasons.

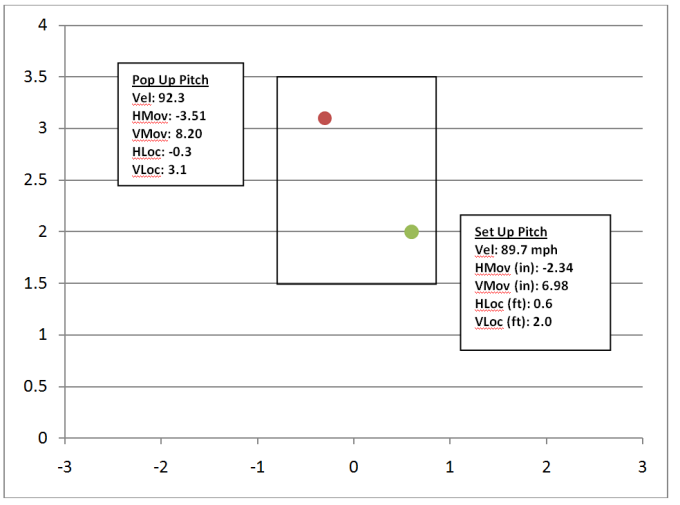
Now I know that setting up a pitch has so much more to do with an entire at-bat, game, or even season than the pitch that was thrown immediately before it, but for this exercise I want to look at the pitch that caused Goldschmidt to pop up and how it relates to the pitch thrown immediately before it. It’s crude and does not tell the whole story, but it still shows a definite approach — and, for all intents and purposes, it’s probably a decent representation of a general tactic used across the league for inducing pop-ups. I found all the data I needed using PITCHf/x at Brooks Baseball and I recorded the velocity, horizontal movement, vertical movement, horizontal location, and vertical location of each pitch Goldschmidt popped out on as well as the same data set for each set-up pitch if there was one (which would be in any situation where Goldschmidt did not pop up on the first pitch of an-bat). Below you’ll find a plot that shows the average location and characteristics of each pitch.
poppy-uppies

And here is that data in a table represented as the average difference between the two plot points.

pitchdiff

Doesn’t it make you feel warm when something fits into the shape you had pegged it to be? That’s just really simple and makes a hell of a lot of sense. Or maybe I feel warm for taking something that was disappointing and turning it into something I can really appreciate.  Now if you’ll excuse me, I have a Power Wheels Jeep Wrangler to buy.


Rendering Paul Goldschmidt a Mere Mortal

The importance of getting ahead of hitters is stressed to pitchers from the first time they play in a non-coach-pitch league.  It’s not what happens on the pitch immediately following a first pitch strike, it’s because the numbers for the rest of the at bat sway dramatically in the pitcher’s favor.

2015 AVG SLG ISO
FIRST PITCH .335 .539 .204
AB after 1st Pitch Strike .223 .338 .115

These are league averages, but for the most part they apply to individual hitters as well.  Paul Goldschmidt is not a “league average” hitter, in fact, he is at least in the conversation when discussing the best hitter in baseball right now (2015) – and I only say at least because I’m too afraid of the backlash I might receive if I declared him the best.  But regardless if a pitcher is facing an average hitter or an elite hitter, the law of getting ahead applies –  even if the numbers for Goldschmidt do look a bit different from the table of above.

2015 AVG SLG ISO
FIRST PITCH .545 1.152 .607
After 1st Pitch Strike .288 .465 .177

Paul Goldschimdt is just so strong, and so adept at making hard contact to all parts of the field that, even at his worst, he’s still so much better than other professional hitters.  The results clearly show that he’s a lesser version of himself throughout the duration of an at-bat that starts with a first-pitch strike, but here’s the thing: getting a first-pitch strike on Goldschmidt isn’t easy.  Not only is he discerning, but he is so devastatingly destructive when he sees something he likes.  Pitchers have gotten a first pitch strike against Goldschmidt 56.7% this season (league average is 61.1%).  In 471 PA, Paul Goldschmidt has only swung 126 times at first pitches, or 26.8%.  It could be said that Paul Goldschmidt “goes to bat with a plan”.  But it’s not like pitchers’ game plans will stand idle while Goldschmidt continues to pummel them; they will make adjustments, and one adjustment they have made, because the pay-off is so dramatic, lies in figuring out how to get ahead of him.

First, let’s consider two samples from Goldschmidt’s 2015 – through July 3rd of this year Paul Goldschmidt put up MVP numbers:

April 6 – July 3:

PA H AB R 2B 3B HR RBI SB BB K AVG OBP SLG OPS ISO
354 102 288 57 18 1 20 66 15 64 65 .354 .470 .632 1.102 .278

Since then, however, he has hit like someone who just might be mortal:

July 4 – August 4:

PA H AB R 2B 3B HR RBI SB BB K AVG OBP SLG OPS ISO
111 24 88 10 6 0 2 11 2 19 28 .273 .387 .409 .796 .136

So what course of action have pitchers taken to get ahead of him in the count?  The answer lies in the conveniently bolded numbers featured in the CB% column of the table below.

Numbers represent the usage of pitches in all first-pitch situations to Paul Goldschmidt.

Date FB% SINKER% CHANGE% SLIDER% CB% CUT% SPLIT%
04/06-07/03 40.18 23.46 3.52 14.66 8.21 9.38 0.05
07/04-08/04 36.04 24.32 0.00 14.41 18.02 9.38 0.90

Obviously there’s been an uptick of a larger percentage in split fingers for first pitches, but a hell of a lot more pitchers throw curveballs than splitters, so that value is not really important.  What is important is that 119.5% increase in first-pitch curveballs, because Paul Goldschmidt SPITS at first pitch curveballs.  He saw twenty-eight, 1st pitch curveballs in the sample size concluding July 3rd and swung at a grand total of 1 of them.  Since then, in a month, he’s seen 20, first-pitch curveballs and has swung at exactly 0 of them.

Goldschmidt is looking for something hard-ish (fastball/slider/change-up; league average change up velo is 83.3 compared to 77.7 for curveballs and 84.2 for sliders) that he can drive on the first pitch, and knows he can lay off curveballs to sacrifice a first-pitch strike and still be an above-average hitter.  For the record, it’s not like Goldschmidt is bad against curveballs; he owns a 3.31 wCB/C in 2015 (3.79 through July 3rd, and 2.16 after), it’s just that he’s committed to his plan.  Pitchers – or analysts – have noticed his disregard for curveballs as first pitches, and the pitchers – not the analysts – have twirled curveballs in to Goldschmidt on the first pitch at a much higher rate over the last month – again, that number is 119.5% more often.  While the strike percentage of these curveballs has only been 45%, that’s still up from the 28% of curveballs for first-pitch strikes through July 3rd.

Conjecture alert:  Perhaps expecting more first-pitch curveballs, Paul Goldschmidt has readied himself to not swing at the first pitch, as he has swung at just 25.3% of non-curveball first pitches since July 4th, compared to 32.9% through July 3rd.  Pitchers have been able to sneak their first pitch strike percentage up against Goldy from 55.9% to 59.5% in this past month – that’s a 6.4% increase.  So it seems as though the best way to beat Paul Goldschmidt is to try to find some way to make him swing the bat less, because when he does, bad things happen to baseballs.  For clarification, I’m talking about throwing him more first pitch curveballs, not walking him every time up.

Paul Goldschmidt is so good that he will probably adjust to this new approach fairly quickly.  I said earlier, “he knows he can lay off curveballs to sacrifice a first-pitch strike and still be an above-average hitter” – Paul Goldschmidt’s aim is not to be a player who is an above-average hitter – he’s a force at the plate and he will adjust.  Health permitting, Goldschmidt will likely finish the season with at least a .300 AVG, 100 R scored, 30 HR, 100 RBI, and 20 SB – a line we haven’t seen from a first baseman since Jeff Bagwell did it in 1999.

So as Goldschmidt adjusts to this new attack from pitchers, maybe the real number to take away from this research is that Goldschmidt is partying like it’s 1999.


Statistical Rarities Potentially Abound in 2015

Last night, I was lying in bed with my arms crossed behind my head, staring at my ceiling, and thinking of what a fantastic season Paul Goldschmidt is having.  “He’s so locked in; I wonder how pitchers have pitched him differently over the course of this season; I bet he’s super cool; I bet we’d hit it off; I wonder what kind of dogs he likes”.   The sheets rustled and my wife turned over and asked, sleepily, “Who are you talking about?”  I looked for her face in the dark.  I was surprised that I had been saying that out loud, but I just whispered to her, “I wasn’t saying anything, you were dreaming”.  She turned over and I said quietly to myself – “Of course it’s Golden Retrievers”.

Goldy is 3 stolen bases away from a 20/20 season which is a rare feat for a first baseman.  Todd Frazier technically did do it last year, but he only started 43 games at 1B, so I would only count him as achieving it as a 3B.  For the remainder of this exercise I’m going to only use players who reached particular milestones while playing the primary position they’re listed for instead of what positions they were eligible for – I’ll apologize to Ben Zobrist in advance.

Let’s go around the diamond and find some completely arbitrary statistical rarities that may be reached this season!  Yay!  Pointless fun!!!

Catchers: A Catcher’s Triple Crown

Buster Posey is so good.  He currently ranks, among catchers, 2nd in HR (14), 1st in RBI (67), and 1st in AVG (.325).  As a side note, he’s also thrown out 48.4% of attempted runners this year and leads all catchers in WAR by a wide margin (4.3 compared to Vogt’s second place 3.0).  But those offensive numbers I listed are clearly the triple-crown categories, aren’t they?  That’s rhetorical.  He’s second in HR right now, trailing Brian McCann and Salvador Perez each by one HR.  Posey has finished second in HR among catchers in 2014 and 2012, and comes up 3rd overall during that span with 75, trailing only Carlos Santana (76) and Brian McCann (78).

We have to travel back in time to the turn of the century to find a catcher who actually posted numbers worthy of a triple-crown among catchers and you’ve probably already guessed that it was the fabulous, Mike Piazza.  He led all catchers in HR (38), RBI (113), and AVG (.324) in the year 2000; absolutely gaudy numbers for any position nowadays.  Think about it, when Miguel Cabrera won the triple-crown in 2012, amassing 44 bombs and 139 RBIs while hitting .330, Piazza’s performance in the NL would’ve put him 2nd overall in HR, 2nd overall in RBI, and 3rd overall in average.  In the year 2000, his numbers ranked 10th, 13th, and 10th, respectively – this point of dramatic difference in his rankings falls into the “different eras” conversation.  Of course this is only about offense, and Piazza is arguably the greatest offensive catcher of all time, but I have to throw in (no pun intended) that Piazza only succeeded in apprehending 22.5% of would be base stealers that year.  Ooph!

First Basemen: 20/20 Campaign

This was the catalyst for this article and I talked about it earlier.  Goldy should be able to get to 20/20 this year and it’s been over a decade since a 1B primary player achieved this elite mark.  A few players have come close, but the man who did it was Derrek Lee.  The year was 2003 and the big, Marlins’ first baseman smacked 31 HR and stole 21 bases.  I didn’t peg Goldschmidt for a 20/20 season this year and I still think that his speed will erode over the next couple seasons, but looking back at Lee, who is not technically a good comparison for Paul Goldschmidt, except that he too was 27 years old in 2003 and had the ability to swipe a bag, he averaged 13 SB over the next 2 years.  Goldy, you may have a few years left of some good wheels, you god…I mean dog.

*Anthony Rizzo may very well get to 20/20 this season, too.

Second Basemen: 150 wRC+

Did you know that Robinson Cano never achieved a wRC+ of 150 in his prime?  That was a kind of shocking revelation for me when I picked this number to single out.  He posted a 149 in 2012 and averaged 142 from 2010 – 2013, which is a shiny number, but it’s not what we’re looking for.  New member of the Kansas City Royals, Ben Zobrist achieved a wRC+ of 152 in 2009 for the Rays, but kind of like Frazier’s 20/20 season last year, Zobrist is ineligible to be considered here because he only accrued a 124 wRC+ as a second baseman in 2009, where he played just over half of his games.  So let’s keep looking.  The last true second baseman to achieve a 150wRC+ was Chase Utley in 2007.  Yeah, Utley was fantastic, and the conversations I have with myself about Goldschmidt are reminiscent of Mac’s conversations with himself about Chase Utley (Always Sunny In Philadelphia).  So who is hitting the mark this year?  It’s not Altuve if that’s what you were thinking.  In fact, this hitter was well below average in 2014, posting a wRC+ of 86.  But he’s increased his BB rate, cut down on Ks, matched his HR output in 32 less games, and has 10 more XBH this year compared to last.  He’s known for his 2nd half slumps, as he has a career 130 wRC+ before the break and a 96 after it, but if he can continue his torrid pace, Jason Kipnis would be the next second baseman to reach 150 wRC+ over a full season.

Third Basemen: Ranking 1st in OFF and DEF (per FanGraphs)

Josh Donaldson currently ranks 1st among 3rd Basemen with a 23.4 Off number and 2nd with a 9.3 Def number.  These numbers are rarely mentioned, but they’re still worth using as measurements since Off is batting and base running combined above average, and Def is Fielding and Positional Adjustment combined above average (again, per fangraphs).  In Defense, he only trails leather-wizard, Nolan Arenado’s 10.9 mark.  It’s not impossible for him to make up that ground this year and if he does, he’d be in some elite company.  Starting from the year 2000, Donaldson would join Troy Glaus (2000), Adrian Beltre (2004), and Evan Longoria (2011) as the only players in this century to lead 3rd basemen in both categories.

Shortstops: Playing in at least 160 G and accruing less than 1.0 WAR

This isn’t a list you want to find your name on, but there’s Marcus Semien, sitting at 0.4 WAR while having played in all but 1 of the Athletics’ games this season (100 out of 101).  Steamer has him projected to play 52 more games and accrue 0.6 more WAR which would give him 152 G and a WAR of 1.0, therefore making him ineligible for this list but let’s extrapolate that pace and say he does play in 160 games.  Semien started the season like a man on fire, swatting 6 HR and heisting 7 bags through the end of May to go along with a nice .283 AVG and a .770 OPS.  Of course his glove has been a cast iron skillet, absorbing some of that heat that he started with, and his offense has taken a nose dive as well.  Since the beginning of June, he’s hit 2 HR and stolen 2 bases (all of these stats came in July – so 0 HR and SB in June) and he’s hit a paltry .206 to go with a .550 OPS.

There are a few other cases of every day shortstops being as valuable (or as lacking in value) as Semien has been this year.  Most recently, in 2013 over 161 G, Starlin Castro was actually worth negative value, and logged a -0.1 WAR.  Orlando Cabrera’s name appears twice since the year 2000, posting a WAR of 0.7 in 2009 over 161 G, and a symmetric looking 0.0 WAR over 161 G in 2004.   The one other name on this list is Neifi Perez, who in 2000 was worth a whopping 0.3 WAR and played every single game for the Rockies.  While the Rockies have had more productive shortstops since then, they have had a tough time keeping one on the field for that many games (unless you span 3 seasons or so) – that was a really mean sentence.

Outfielders: 5 players 25 years or younger with 30 HR

The talent pool of young players in 2015 is well documented.  Mike Trout is Mike Trout and he already has eclipsed 30 HR.  Bryce Harper and Manny Machado are stepping up their games to join baseball’s elite.  Giancarlo Stanton is injured now, but should be a lock for 30 if he comes back this year.  And Joc Pederson has arrived in the bigs swinging some thunderous lumber.  Each of these players (using Steamer’s ROS projections) are on pace to hit 30 HR or more.

Player Age Current HR Pace (using Steamer)
Mike Trout 23 31 44
Bryce Harper 22 27 39
Giancarlo Stanton 25 27 36
Joc Pederson 23 21 31
Manny Machado 23 21 30


Going back to my arbitrary year cutoff, 2000, I can only find 2 other accounts of this phenomenon.

2012: (2 of the same players are on the 2015 list!!!)

Player Age HR
Giancarlo Stanton 22 37
Jay Bruce 25 34
Josh Reddick 25 32
Andrew McCutchen 25 31
Mike Trout 20 30


And the year 2000

Player Age HR
Vladimir Guerrero 25 44
Richard Hidalgo 25 44
Andruw Jones 23 36
Geoff Jenkins 25 34
Preston Wilson 25 31
Richie Sexson 25 30

Again, the year 2000 was a completely different era.

Starting Pitchers: K-BB% above 30%

This one is a little less likely, but the player in the hunt is Clayton Kershaw, so, yeah.  Kershaw led all of baseball last year with a 27.8 K-BB%.  He’s at it again this year, pushing the needle to 28.9%.  His SwStr% is trending up yet again and it’s up to 16.1%.  It’s gone up every year since 2012 when it was 11.1%.  You know I love tables, so here’s one for Kershaw

Year FB% SL + CB% SwStrk%
2010 71.6 26.6 10.1
2011 65.3 30.9 11.2
2012 62.0 34.3 11.1
2013 60.7 36.9 11.4
2014 55.4 43.7 14.2
2015 55.6 43.8 16.1

*Whatever percentage points are missing from his pitch usage in that chart are allocated to change-ups.  **I think the table is self explanatory and therefore, won’t waste any time explaining it.

Kershaw’s 27.8 K-BB% was the highest mark since Curt Schilling’s 27.9% in 2002.  If Kershaw can push it above 29% he’d leap over 2002 and he’d be the first pitcher since Randy Johnson in 2001 to be at 29% or higher.  Kershaw’s “rebounded” from his early season “struggles” with the long ball and has been as sharp as ever dating back to June 6th.  From the beginning of the season through his start on June 1st, his K-BB% sat at 24.8%.  Starting on June 6th and including his start on July 23rd, his K-BB% has been an absurd 33.9%.  If he can keep that up over his next 6 or 7 starts, depending on how many he has left, he could push that number to 30% and be the first pitcher since Pedro Freaking Martinez in 2000 to do so.  The insane thing about Pedro is that, in 2000, the league average K-BB% for starters was 6.7%; his was 30.8%, or 4.6 times the league average.  This particular category saw the leader’s rate drop every season until Cliff Lee led the category in 2010 with a 19.8 K-BB%.  Meanwhile the league’s starting pitcher average rate has gone up and is 12.2% this year.  Clayton currently sits at 2.4 times the league average, which is still phenomenal for a starting pitcher, but if you think about how inhuman he’s seemed over the course of the last couple of years, that just makes Pedro even more amazing, superlative, superlative, and superlative.

Relief Pitchers: AVG Velocity at 100 mph.

We’ll keep this one brief.  Pitch f/x data goes back to 2007 on FanGraphs, so that’s as far back as I can go, too.  Before 2011, Aroldis Chapman’s first full season in the pros, no one had averaged a 98 mph fastball before.  He did in 2011, and it sat at 98.1.  That number actually increased and kept increasing until it reached 100.2 mph in 2014.  That was his average fastball.  This year it’s a measly 99.5, but if anyone can do it, it would be the only man to do it.


Baseball is selfless in its ability to give us never-ending fun facts that the initiated will appreciate (I feel like there was some redundancy in that sentence).  This selflessness also serves as the primary reason why I’m sleep deprived and why my personal relationships are stunted.  So the next time your wife or husband or whoever, wakes up from their slumber to ask who you’re talking about, think of me, and if they’re statistically inclined, too, just say something like, “Oh hey, sorry to wake you, sweetie, it’s just that Paul Goldschmidt’s BB/K rate has been over 1 the last two months”, and then maybe, you two can lie awake and wonder about the wonders of Paul Goldschmidt’s approach at the plate this year.