Archive for Orioles

Nick Markakis’ Forgotten 2008 Season

While browsing Baseball Reference’s database, I encountered a strange thing. I was looking at the WAR leaders for each season. WAR stands for Wins Above Replacement, which is a statistic that measures how many wins a team gained by having a certain player instead of a replacement player, who would have a WAR of 0. The leaders were all recognizable names — MVPs, World Series Champions, Cy Young award winners, etc.

Surely the leader in WAR in 2008 finished near the top in the MVP voting. And of course he was an All-Star. And sure, maybe he even won a Silver Slugger or a Gold Glove.

Nope.

Nick Markakis led the American League in WAR with 7.4 and did not receive an MVP vote, make the All-Star team, win a Silver Slugger or take home a Gold Glove.

Markakis is now a veteran outfielder for the Atlanta Braves. But back in 2008, he was a stud for the Baltimore Orioles, and he led his team in hits, walks, batting average, and on-base percentage. Markakis had a reputable slash line of .306/.406/.491, scored 106 runs, drove in 87, clobbered 20 homers and stole 10 bases. These stats are excellent, and Markakis finished near the top of many leaderboards once the season ended.

He finished in the top ten in the AL in batting average, OPS (on-base + slugging), hits, extra-base hits, and Offensive WAR. The right fielder also closed the year in the top five in the AL in on-base percentage, runs, doubles, and walks. Markakis was also a great asset in the field, leading AL right fielders in games played and putouts while leading all AL outfielders in outfield assists.

According to Baseball Reference, there have only been 32 seasons when a player either matched or exceeded Markakis’ WAR, Offensive WAR, Defensive WAR, batting average and on-base percentage.

Markakis’ excellent stats were matched by only 32 players ever, but he was snubbed from every award.

Markakis was not selected as one of the six outfielders to compete in the All-Star Game despite his achievements.

Instead, Ichiro Suzuki, Josh Hamilton, Manny Ramirez, J.D. Drew, Carlos Quentin, and Grady Sizemore were selected. None of them recorded more than 6.0 WAR, while Drew did not even record 3.0 WAR. Markakis was thoroughly robbed of an All-Star appearance.

Looking back on it, it’s an injustice that Nick Markakis had such a standout year and did not even receive a single vote for MVP. His 7.4 WAR outnumbered every other candidate, including winner Dustin Pedroia, who recorded 6.9 WAR.

Markakis had arguably a better year than anyone in the American League in 2008, and yet was not recognized at all.

Markakis was also a standout defensively, and recorded 1.7 Defensive WAR. Yet he was not appreciated for this achievement either, as Torii Hunter (-0.1 dWAR), Ichiro Suzuki (0.8 dWAR), and Grady Sizemore (0.1 dWAR) took home the outfield Gold Gloves in 2008.

Another intriguing aspect of Markakis’ season, besides being slighted from every award, was that this explosion came out of the blue. Markakis’ 7.4 WAR in 2008 soars above his career average of 2.6 and towers above his next-best season, when he recorded 4.2 WAR in 2007.

Markakis’ defensive exploits in 2008 were also very surprising. He has never been a great defender, and he has only two years in his 12-year career in which he has a positive dWAR, 2008 (1.7) and 2016 (0.3). Markakis has a career dWAR of -6.5, which shows that his excellent 2008 season was an anomaly.

Markakis also logged a career high in Offensive WAR in 2008, as he achieved career highs in runs, doubles, walks, batting average, on-base percentage, slugging, and OPS.

I’ll never know why Markakis could not even come close to matching his exploits from 2008. Markakis was just 24 in his breakout season, but his stats decreased as he headed toward his prime. I can’t find an explanation for his decline, as injuries weren’t a factor — Markakis has played at least 155 games in every season from 2007-2016, with the lone exception of 2012. Markakis was a bit lucky in 2008, as his BABIP (batting average on balls in play) was .350, higher than his actual batting average of .306. However, his career year cannot be explained away by luck.

The lack of recognition of Markakis’ magnificent season is puzzling. He did play in one of baseball’s smallest media markets (Baltimore) for a team that stayed in the basement of the AL East, but at a certain point, efforts like his need to be noted.

Markakis never again reached the heights of his 2008 season, and I’ll always wonder two things: why he wasn’t recognized for his achievements, and why he was never able to match his production again.

Special thanks to Baseball Reference for all of these helpful statistics


Tyler Wilson and His Five Plus Pitches

Let me preface this article by saying that I watch A LOT of baseball.  I also have an extensive analytical background and am always analyzing baseball stats looking for value in players.  Last week, I was watching an Orioles game and the starting pitcher was a player I have never heard of.  His name is Tyler Wilson.  While watching the game, I was very impressed with his overall make-up and the confidence he displayed in each one of his pitches.  Many times what separates a pitcher from being able to start at the big-league level versus being destined for the bullpen is the ability to throw multiple pitches.  The ability to throw each of those pitches effectively, however, can be what separates a good starting pitcher from a great starting pitcher.  The more I watched of Wilson, the more intrigued I became about his future outlook, and the more motivated I became to write this article.  (I went back and watched all of Wilson’s starts this year before writing this article.)

To give you a little background, Tyler Wilson has never been an elite prospect.  He attended college at the University of Virginia, where he was overlooked by fellow staff-mate, and future 1st round pick, Danny Hultzen.  Wilson was drafted by the Orioles in the 10th round of the 2011 MLB Draft.  Ever since being drafted, he has quietly excelled at every level.  He doesn’t have the dominant strikeout numbers that you look for in pitching prospects, which is a big reason he has gone overlooked for much of his career.

After climbing his way through the organizational ladder, Wilson made his major league debut with the Orioles last year and eventually made the team this year out of spring training.  Although he made the team in a bullpen role, early season injuries to the Orioles pitching staff opened up an opportunity and Wilson has really taken advantage of it.  Enough of the background though.  Let’s move on to what I saw while actually watching him pitch.

Tyler Wilson features a cutter and a two-seam fastball.  Each of these pitches sit in the 89-91 mph range and both show a great amount of movement.  The cutter is most effective against right-handed batters when thrown on the outside portion of the plate.  Check out the video below to watch him fool Kansas City Royals outfielder Lorenzo Cain with three straight cutters:

He essentially gave Cain, a very good hitter, three of the exact same pitches in a row…and Cain couldn’t touch them.  In every start this year, Wilson has pounded the outside corner with this cutter and has had fantastic results.  Don’t think by any means though that he is a one trick pony.  As soon as you start to expect that cutter on the outside corner, Wilson will come right back in on you with a two-seam fastball:

Look at the horizontal movement on that pitch!  Absolutely filthy!  Wilson has showed a ton of confidence in both of those pitches so far this season as he uses them to pound both sides of the strike zone and his command of them has been exceptional.  He is not afraid to throw them in any count and they are equally effective vs both left-handed and right-handed batters.

While his fastballs both seemed to be plus pitches upon first glance, I started to have thoughts that this guy might be for real as soon as he started throwing his curveball.  Wilson’s breaking ball sits in the 77-79 mph range.  I was astonished by how well he was able to locate his curve and the amount of movement on each and every one he threw.  Watch him send White Sox slugger Jose Abreu down swinging in the video below:

Abreu had no chance.  In his most recent start against the Twins, Wilson’s curve looked even better.  Check out the one he threw to Byung-Ho Park:

Both of those pitches came in a 2-2 count.  Many pitchers are scared to throw a breaking ball in a 2-2 count, especially to players with plus power such as Abreu and Park.  If you miss your target, two things can happen.  One — you leave the ball up in the zone and it gets hit out of the stadium.  Two — you throw it in the dirt; the hitter lays off; and now you have to pitch to this slugger with a full count.  Wilson isn’t scared to throw his curveball in any count and that is what makes him so dangerous.  You never know when to expect it, but at the same time you have to expect that he can throw it at any moment.

The last pitch in Wilson’s arsenal is his changeup.  This pitch has a ton of downward movement and produces a lot of groundballs.  While there were many better examples that I could have shown you of his change-up in action, I wanted to show one of his bad ones.  Even when he missed his target, the batter was still fooled by the amount of movement on this pitch.  Check out the following pitch to Royals SS Alcides Escobar:

The catcher set up down in the zone and Wilson clearly misses his target.  Luckily it didn’t seem to matter as the pitch had an insane amount of horizontal movement, running in on Escobar and jamming him.

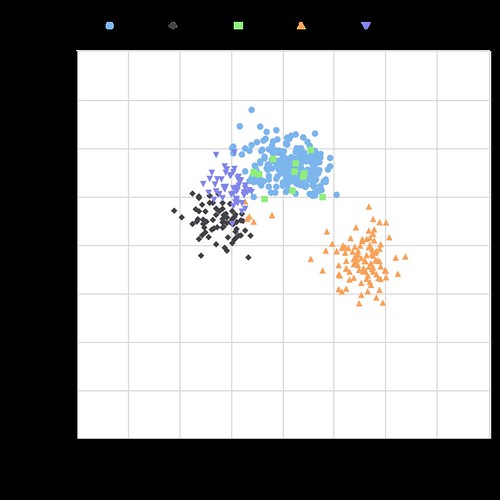
Take a look at the chart below, showing the vertical and horizontal movement on each of Wilson’s pitches:
Tyler Wilson Movement

The middle portion of this chart is empty.  All five of his pitches have a tremendous amount of movement, and none of them move in the same direction.  The fact that he is able to command each of these pitches so well and keep hitters guessing with which one will come next is the reason why he has had so much success.  A big reason why hitters are having trouble guessing his pitches is because of how well Wilson is able to repeat his delivery.  The chart below shows Wilson’s release point for each type of pitch:

Tyler Wilson Release Point
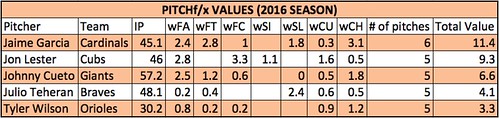
As you can see, his release point is almost identical with all five of his pitches.  At this point, I have watched all of his starts from this season and was very impressed.   I then decided to do some research and was immediately impressed with stats such as his career BB rate and low WHIP, but wanted to dig further.  I began to look through the PITCHf/x data because I was curious to see how effective each of his pitches actually were.  Based on the PITCHf/x value metric, all of his pitches so far this year have graded as above average.  If you are not familiar with the PITCHf/x value scale, someone who has a fastball ranking of zero means that he possesses an average fastball.  Any value above zero means that pitch is above average.  Obviously the higher the number, the better the pitch.  The same goes for negative numbers and pitches being below average.  See the table below for the breakdown of Wilson’s arsenal:

Screen Shot 2016-05-15 at 1.19.17 AM

Based on the above values, the change-up has been Wilson’s most valuable pitch this season with his curveball close behind.  Obviously it is very early in the season and we are working with a small sample size…but that doesn’t mean we can’t have fun!  While doing this research, I set out the goal to find every starting pitcher who throws five or more above-average pitches.  Below is the list of players who fit that description:
Screen Shot 2016-05-15 at 1.41.09 AM
IP = Innings Pitched
FA = Fastball
FT = Two-Seam Fastball
FC = Cut Fastball
SI = Sinker
SL = Slider
CU = Curveball
CH = Change-up
KC = Knuckle Curveball
EP = Eephus

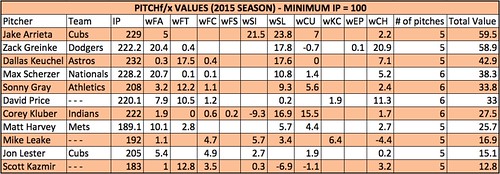
There are only five pitchers who have thrown five or more pitches above average so far this season!  Wilson is in great company, as the other four pitchers are all All-Star-caliber players and borderline household names.  Being that this is such a small sample size, I decided to look back at last year’s stats to see how many players fit this description over a full season.  Using the same parameters and setting the minimum IP to 100, the following table was produced:
Screen Shot 2016-05-15 at 2.05.17 AM

Once again, the names on this list are some of the top pitchers in baseball.  A few of these pitchers have a pitch that graded out as below average, but since they had five or more different pitches all individually grade as above average, they made the final cut.

As you can see, it is very rare to have a pitcher who has five legitimate plus pitches.  I am very interested to see if Tyler Wilson can maintain these results over the course of a full season, and I really hope he is given the opportunity to do so.  If he continues to pitch the way he has been, the Orioles will have no choice but to leave him in the rotation.  Although he has had limited success, Wilson has struggled in each of his starts when facing the lineup the third time around.  This could be due to the fact that he is still in the process of being stretched out from his bullpen role.  When in the bullpen, you don’t have to prepare to face the same hitter three times.  I am hopeful that once he is fully stretched out and back into his starter mentality, he will be able to make the necessary adjustments and continue to throw all of his pitches with confidence.  If he can continue to make quality pitches as he faces the lineup for a third time, I believe Tyler Wilson has the chance to become a very special pitcher.

Memorable quotes I heard during the TV broadcasts:

“Everyone thinks that I pitch with a chip on my shoulder but I really don’t.  I just go out and compete.  I don’t think of it that way.” – Tyler Wilson

“I think he understands himself.  He can maintain his game-plan throughout the game.  He’s going to keep us in the game and give us a chance to win.  What more can you ask for?” – Pitching Coach Dave Wallace

“I love that he can make the ball run in and then cut away.  He pitches to both sides of the plate.  Not a lot of young pitchers can do that.” – Manager Buck Showalter

…no Buck, not a lot of young pitchers can do that.

Twitter – @mtamburri922


A Case For Wei-Yin Chen Ownership

I’m not going to tell you anything you can’t find out for yourself.  This is just a little research on Mr. Chen.  Alternative title would’ve been Chen Music, but I couldn’t find proof of an increase in high and inside fastballs.  Anyways:

Wei-Yin Chen’s surface level numbers have been great this year:

18 GS,   2.86 ERA,   1.12 WHIP,   93 K/116.1 IP

The thing is, he’s been just as good dating back to Jul 1st of 2014:

33 GS,   2.88 ERA,   1.14 WHIP,   164 K/209.2 IP

His peripherals over that time have declared him lucky and say that this success in unsustainable.  His FIP, xFIP, and SIERA for each half have been quite different from the ERAs he’s put up.


FIP xFIP SIERA ERA
JUL – SEPT 2014 3.37 3.68 3.79 2.89
APR – JUL 2015 4.09 3.85 3.78 2.86


Look, I get it, he doesn’t strike out even 20% of the batters he faces and he can struggle with the long ball.  But the Orioles’ defense is ranked 3rd in the league by UZR, and 3rd by UZR/150.  Ahead of the Orioles are the Rays and the Royals.  Each of these teams are outperforming their ERA indicators by a decent amount.

FIP xFIP SIERA ERA
Royals 3.80 4.09 4.03 3.54
Rays 3.86 3.81 3.66 3.59
Orioles 4.01 3.91 3.76 3.73


This does not mean that every pitcher on each of these teams is outperforming their peripherals but it’s obvious (and not because of that table) that defense helps pitchers’ numbers.  I also understand that Camden Yards is a little bit more of a hitters’ park than Kauffman and Tropicana, but that shows up in Chen’s numbers as he has surrendered HR at the rate of 1.29/9 IP at home and 0.89/9 IP on the road (July 3rd 2014 – present).  To be fair, I don’t know if 112 IP and 97.2 IP (home and away, respectively) are large enough sample sizes compared to his full body of work to be worth anything, but let’s say they are, and let’s see what Chen has done differently over his last 209.2 IP compared to his first 422 big league innings.


K% BB% K-BB% GB FB LD PU HF/FB SOFT MED HARD
209.2 19.2 5.2 14.1 40.3 39.5 20.2 10.5 10.1 20.6 53.0 26.5
422 18.2 6.3 11.9 37.2 40.7 22.1 11.1 11.5 14.9 54.2 30.9
DIFF 1.0 -1.1 2.2 3.1 -1.2 -1.9 -0.6 -1.4 5.7 -1.2 -4.4

(209.2 denotes the last 209.2. IP by Chen, spanning from July 3rd, 2014 to his last start against the Yankees, and the 422 is the 422 IP prior to July 3rd of last season, which encompasses the rest of his career)

Even though his ground ball rate doesn’t lead to much confidence in terms of sustainability in that soft contact management, he still is inducing pop-ups at an above-average rate.  So whether it’s a change in sequencing or it’s just as easy as working ahead in more counts, there has been some variation in his pitch usage…another table.

FB SL CB CH
203.1 66.4 17.5 6.2 9.9
422 65.8 13.6 7.4 13.1
DIFF 0.6 3.9 -1.2 -3.2


Obviously he’s traded some curveballs and change-ups for sliders.  His fastball has become increasingly more valuable in 2015 at 8.9 runs above average, compared to 3.3 runs above average from 2014 which was his previous high.

The last thing he’s done better is pound the zone early in counts which has led to a slight decrease in batters’ plate discipline against him.

F-STRK SWING OSWING ZSWING CONTACT SWSTRK
203.1 65.1 50.8 33.3 69.4 82.2 8.9
422 59.0 49.1 30.3 68.8 82.9 8.3
DIFF 6.1 1.7 3.0 0.6 -0.7 0.6


(Almost) Everywhere you want to see improvement there is improvement even if you have to look through a magnifying glass.  Granted, this could be Chen adjusting to the league and now the league will adjust to him.  It would be perfect for him to just cleanly split from the success he’s been having after the all star break and after this piece.

In conclusion, it’s hard to know what to make of Chen as a fantasy option in the long term because he is experiencing a deflated BABIP and a higher LOB% than he has in the past.  Is it all about the luck??  I’m not too bullish on him; the tweaks he has made, while they have led to some slightly positive results, do not warrant picking him up in a dynasty league, but if you’re behind in starts or innings Chen seems to be a solid option for QS/ERA/WHIP this season if he can thwart off the regression monster.  After all that, I did not recommend him in his start against the Yankees and their .325 wOBA (results on that game were meh – it was a QS, but he gave up 10 H in 6.1 IP, 3 ER, and struck out 3) but he’s at Tampa (94 wRC+) after that.  Projecting ahead, he’d face the Tigers (113 wRC+ which is best in the majors, but they could be selling some pieces and they will still be without Miguel Cabrera), and the Athletics (99 wRC+)who are also sellers.  After that it’s likely the Mariners and their 92 wRC+; I’d take that 4 start stretch.  Something to scratch your Chen about.


Nick Markakis, What Happened?

Nick Markakis has carved himself out a nice major league career. He now has the 8h most hits in Orioles history and by seasons end he’ll likely be in sole possession of 6th place. Markakis, now with nearly 1,500 hits, at 30 years old has a shot at gathering 2,500 hits in his career. While hits are a compilation statistic,  that would still place him in the top 100 of all time. However, Markakis still strikes me as a player of unfulfilled potential. In his last four seasons, Markakis has not compiled a WAR higher than his rookie season (2.1 in 2006). His two highest WAR seasons—far and away—were at ages 23 and 24. In 2008, a season in which he compiled 6.1 WAR, he had the 11th highest total in all of baseball. To peak so young is a very odd career trajectory. While Markakis was on the path to being one of the best all around players in baseball, he cratered early. This loss in value is due to two reasons, which are readily apparent to date this season, a reduction in power and a reduction in defense.

Markakis early on posted decent advanced defensive numbers. But, since 2009 he has been bad according to the metrics. To follow up that up with some regular scouting, he has simply lost a step. He lost his range at a young age and has never been able to get it back. His arm keeps him respectable but he has even lost some of that strength as well. He remains a below average right fielder and it is not getting any better.

While his defense has hindered his overall value, the most critical aspect of his game to leave him at young age was his power. Markakis never hit many home runs, with a career high of 23, but the doubles were critical to his value. He had four straight seasons of 43, 48, 45, and 45. All fantastic numbers. In fact, after the 2010 season, he had a decent shot of reaching the top 10-20 for the all time doubles record if he kept up that pace. However, his homers and doubles fell following 2010. If he had maintained a 40 double, 15-20 homer pace over the course of his career, alongside his .300 batting average and decent walk rate, Markakis could have been one of the most valuable outfielders in the game. The graph below tells the story best of when he lost his power. Those are his season by season ISO and SLG numbers.

NickMarkakis_PowerGraph

Looking at the graph above, once can see that Markakis was average to above average in power production for his first handful of seasons. Starting in 2010 is when his power began to fall to below average. His numbers spiked in 2012, however that is his shortest season to date so the sample size is smaller than the other years around it. Also, 2012 was still lower in both ISO and SLG than 2007 and 2008. Since 2009, Nick Markakis has been a below average power hitter. And his most recent season, 2013, was his worst ever producing a paltry .085 ISO (.145 is considered average and .080 is considered awful) and posting a -.1 WAR number. But, the question still remains to why did he lose his power?

After watching Markakis for years and staring at hours of tape it is hard to tell if this power reduction is due to mechanical issues. Markakis has been known to change his stance and approach at the plate nearly every week. He will lower or raise his hands, stay open or close up, he is a constant tinkerer at the plate with his mechanics. I do not believe mechanics has anything to do with the steady power decline. Nor is it necessarily how pitchers are pitching to Markakis. Looking at the numbers, he is seeing a similar amount of pitches in the zone, a little less than the early years but nothing unexpected and in fact his rate has rebounded recently. Furthermore, the mix of pitches he is seeing is similar to his early years. It has not been an adjustment from pitchers. Rather, much like his defense, he simply lost a step earlier than most other position players do.

Looking at the two heat maps below. One shows his power peak years (2007 to 2010) and the one below that shows the last two seasons (2013 to 2014). They are ISO heat maps showing which pitches in which locations Markakis has been able to drive for extra bases.

Markakis2007to2010ISOMarkakis2013to2014ISO

Clearly, Nick Markakis has shown over the past two seasons to not be able to drive the pitches for extra bases that he once could. In particular the pitches in the outside middle of the plate—which if you remember those great Markakis years he could artfully fade right in between the center fielder and the left fielder for a double like clockwork—he has shown a clear ability to not drive for extra bases anymore. The only power left in Markakis’ game comes from pitches down and in and even then its limited power at best. Basically, he can still run into a meatball, but his double-hitting days are over. And with someone who cannot and has never been able to hit the ball out of the park readily, Markakis is basically a slap-hitting right fielder who can post some decent value at the plate, but nothing special.

The career arc is strange and unfortunate but clearly obvious. Markakis simply could not and cannot maintain the production of his early seasons. His skills broke down sooner than most. He is a nice piece and if he kept up his early pace, he would have been a steal on his current contract. However, unless he is brought back at a reduced price—or if Peter Angelos decides that loyalty is worth $17.5 million—Orioles fans better get used to having a new right fielder in 2015.

Article originally posted at www.Orioles-Nation.com