Author Archive

Kevin Gausman and the Elevated Fastball

Orioles fans have been pining for Kevin Gausman ever since 2015 Opening Day at Camden Yards when Bud Norris got shelled by the Blue Jays. The now-24-year-old started in 20 games last season as he was yanked back and forth between the majors and minors and posted a 107 ERA+ in 2014. A good number — not excellent, but good. He stabilized the rotation after Ubaldo Jimenez struggled mightily in his first year as an Oriole. In 2015, he will be asked to do the same as Norris has scuffled in the rotation so far. Two starts in, the results are promising, even better than 2014. One key change so far for Gausman is his willingness and ability to elevate his plus fastball.

The community’s own Jeff Sullivan has written about this as well. Both, before the season and after Gausman’s first couple of relief appearances in 2015. The idea being that some teams have emphasized throwing high fastballs and that not every pitcher is equipped to do so. But, Gausman has a heavy fastball that could stand to work more up in the zone; in fact in 2014 he was at the bottom of the league only throwing that pitch in the upper half 33% of the time. Jeff Sullivan also noted astutely that Gausman and the Orioles have talked about him throwing up more and that he had been doing so coming out of the bullpen.

Well, after two starts, Gausman continues to work up in the zone with the fastball and he is getting some great results. In 2015 his strikeout rate is up from 18.5 percent to 21.7 percent while his walk rate is around the same. His hard contact rate is down from 28.7 percent to 26.9 percent and his soft contact rate is up from 17.2 percent to 25.4 percent. Meanwhile, his fly-ball and groundball rates are up as well while his line-drive rate is at only 10.4 percent. This helps to explain how he has only given up eight hits in his last 11.1 innings pitched.

First, below is a graph of the average vertical location of Gausman’s fastballs over the past three seasons.  Brooksbaseball-Chart.0.jpeg
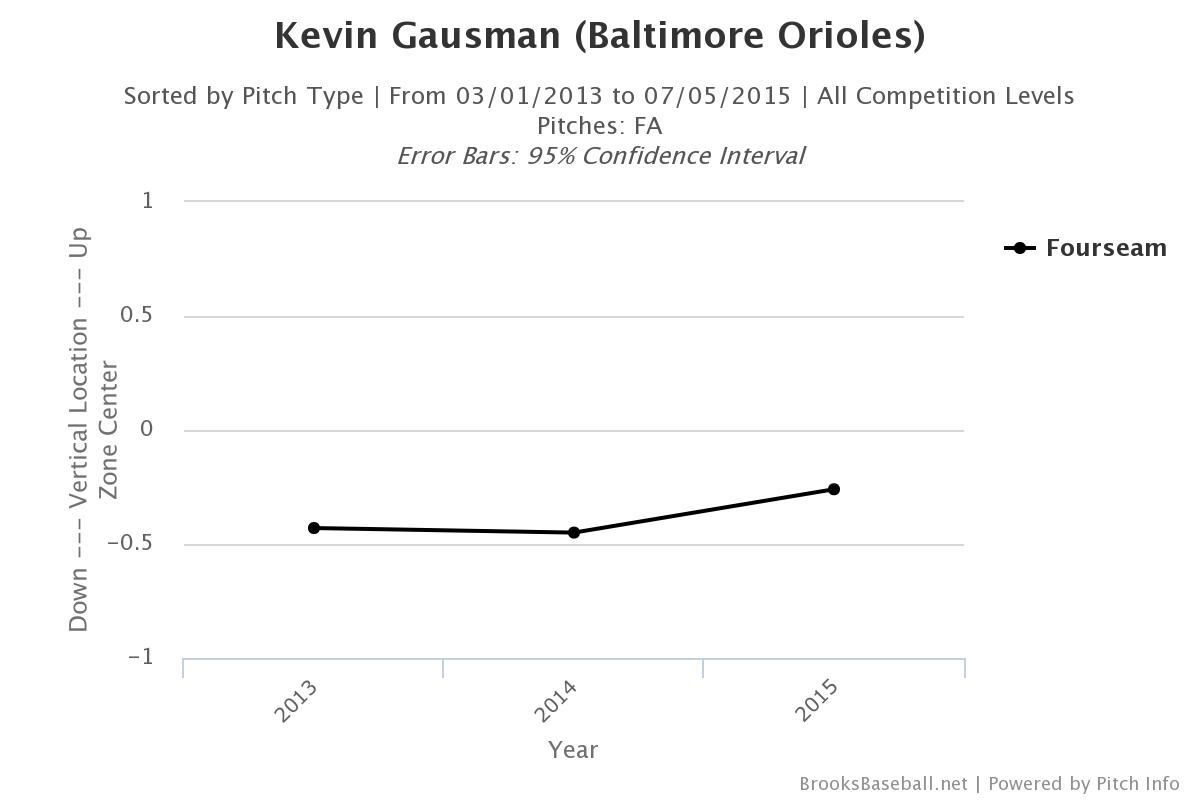
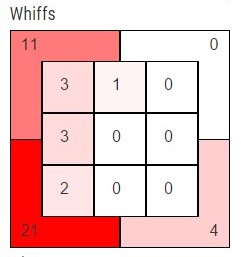
As you can see, Gausman has worked more up in the zone. Not by a lot, but enough to call it a trend so far this year. Working mostly down is always going to be more friendly for a pitcher, but the ability to throw high strikes and for the batter to know that you can, is a very effective weapon. For instance, below is a chart of the whiffs Gausman has gotten from batters so far in 2015.
Gausman_Whiffs.0.jpg

Notice the upper left portion of the zone. Gausman so far has gotten 11 swings and misses in this area in 2015; he had 29 whiffs all of last year in the same area. Every one of those 11 whiffs in 2015 has come on a four-seam fastball. Again, the bread and butter for Gausman will be dotting his fastball on the outside corner and working his splitter away, but the added weapon of a high fastball has produced some great in game results thus far in 2015.

I paid close attention to the game against the Rangers on July 2nd, in which Gausman pitched 6.1 innings striking out 7 walking 2 and allowing only 4 hits. Gausman utilized his fastball in this upper area of the zone to great effect during this start. Below is the strike-zone plot for Gausman from this game. Gausman_v_Rangers_Pitch_Location.0.png
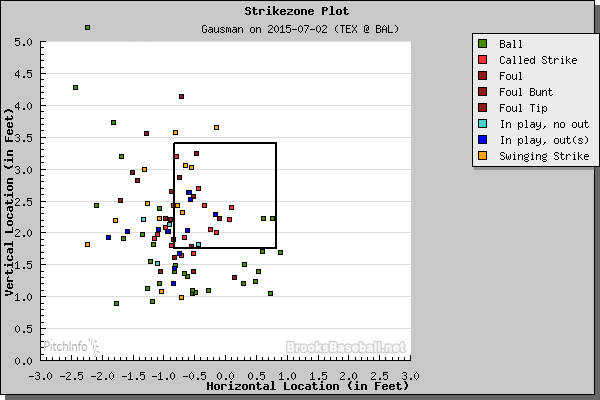
Here you can see Gausman was able to work mostly arm-side low, but he also worked up in the zone and got five swinging strikes on balls at or above three feet off the ground. I also wanted to point out some specific at bats from that game. Below is the strike-zone plot against Robinson Chirinos in the third inning. Gausman_v_Chirinos.0.gif
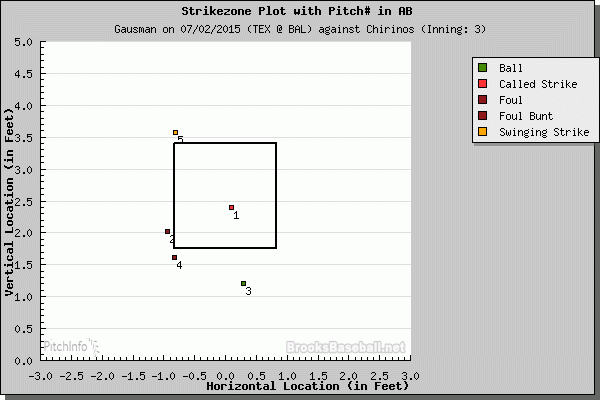
Gausman starts him out with a pretty bad fastball that Chirinos simply swings through, although to be fair it was 97 mph. He then throws two more low fastballs and get Chirinos to foul off the second one. Now with the count 2-1 Gausman throws his splitter which Chirinos is again able to foul off. Now, the key pitch in the at bat, Gausman climbs the ladder for the fifth and final pitch with another 97 mph fastball to get the swinging strikeout. Here is another at-bat where Gausman used the elevated fastball, this one is to Adrian Beltre in the fourth inning. Gausman_v_Beltre.0.gif
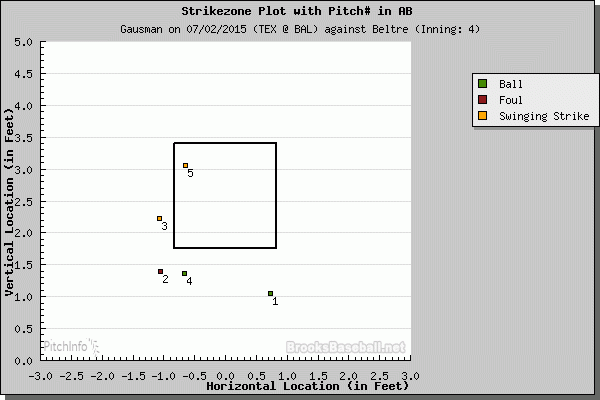
This at-bat is again five pitches. Gausman first throws a fastball low and away for a ball. Then, Beltre fouls off an inside and low fastball. Gausman then throws the splitter inside for a swinging strike and follows that up with a low and inside fastball for a ball. Now with the count 2-2 and every pitch in the lower half or below the strike zone so far in the at bat, Gausman elevates a 97 mph fastball high and tight to Beltre who swings through to get another strikeout for Gausman. All right, last one, I swear.
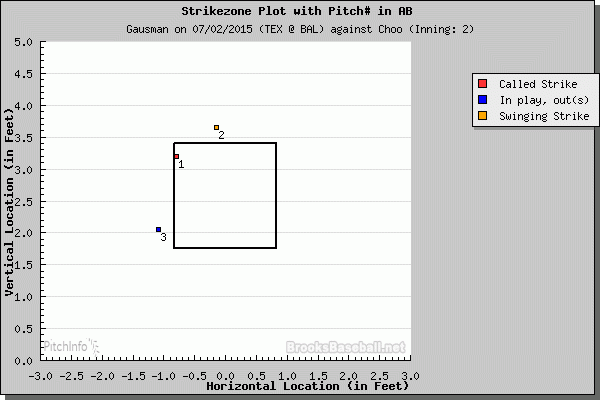
Gausman_v_Choo.0.gif

This at-bat is against Shin-Soo Choo in the second inning. Gausman starts him off with one called strike fastball up and away at 96 mph and follows that up with another elevated fastball at 97 mph that Choo swings and misses on. So now Choo has seen two high 90s fastballs three feet off the ground. Next, Gausman drops an 88 mph splitter a foot lower and Choo rolled over on it to second base. Not only can the elevated fastball get strikeouts, it can also setup his other pitches.

Here are the video highlights for that Rangers game where you can see the end of the two strikeouts above. Also, here are the video highlights of his start in Toronto wherein he gets two infield flies and a strikeout on elevated fastballs. Watch both for some more context.

The Orioles are now looking for Gausman to become a rotation stabilizer. Gausman has struggled somewhat in his career thus far because of a lack of true third pitch; he has gone back to his curveball this year which has shown some early promise. However, he has also struggled because for the most part he worked everything down in the zone. With the added focus of throwing elevated fastballs in 2015 it changes the hitter’s eye level and lets them know that Gausman can throw to all parts of the zone, so all parts of the zone are in play. So far, in 2015 that pitch has achieved great results. Now, we’ll have to see if Kevin Gausman can keep replicating those results.

The original version of this article was posted on www.camdenchat.com on 7/6/2015


Manny Machado and Selective Agression

In the off season I wrote about how Manny Machado’s 2013 second-half struggles lied in his inability to select pitches he could hit. Essentially, his innate ability to get bat to ball combined with a poor understanding of knowing which pitches he could drive led to him swinging and making contact on pitches he could not barrel up. This led to an increase in fly balls – especially infield fly balls – which indicate poor contact is being made. Machado was swinging at junk and this caused his batting average and extra base hit production to plummet in the second half of 2013.

Fast forward to now, and Machado has been hitting .301/.340/.494 for the last two months after a cold start coming off of knee surgery. He has a .193 ISO during that time period as well as a 24.3% line drive rate. He certainly has been barreling up the ball for the last two months and has been one of the only Orioles hitters  doing so since the All Star break. Therefore, I wanted to see if Machado has changed his approach in any meaningful way and has learned to be selectively aggressive. Meaning, while he still is never going to be an on base machine, he can still be patient enough to wait on pitches he knows he can hit and hit well rather than making contact on pitches he cannot hit well.

Looking into his basic 2014 plate discipline numbers, interestingly, reveals little to no positive change from 2013. He is swinging more at pitches in the zone and out of the zone. He has an O-Swing% of 32.8%, a Z-Swing% of 68.6% and an overall swing% of 49.9% all of which are two to three percentage points higher than last year. Furthermore, he is making less contact on pitches in and out of the zone. His O-Contact% is 63.5% and his Z-Contact% is 85.4% alongside an overall contact% of 77.9% all of which are three to four points lower than last season. If Manny was swinging and barreling up better pitches to hit his swing rate may be the same, but he should not be swinging at pitches out of the zone more often. Furthermore, his contact rate would be higher especially on pitches in the zone, which it is not. Also, his swinging strike rate is up and his pitches seen in the zone are down. So, if those numbers are not showing why Manny is being more successful to date this year, then either there is another reason or it has simply been luck so far.

A quick look at some other figures tells a slightly different story.  His walk rate is nearly two points higher to date this season and his pitches per plate appearance is up from 3.53 P/PA to 3.68 P/PA. While that may not seem like an astronomical increase, it is significant. Manny had 710 plate appearances last season, if he had this season’s rate of P/PA he would have seen 106.5 more pitches last year. Therefore, his increasing strikeout rate is not surprising simply because he is seeing more pitches. He also is not striking out at an absurdly high rate to begin with, only slightly above 2014 league average. Basically, Machado is seeing more pitches this year than last, and this has led to a higher walk rate and a higher strike out rate.  This, however, does not quite prove the theory of selective aggression that I am purporting.

Using heat maps, this theory can truly be put to the test. Manny may be swinging slightly more and making a little less contact, but what matters here is whether or not he is swinging at good pitches for him to hit, which his recent numbers and line drive rate would suggest he is doing. Below are two heat maps. One is of Manny’s 2013 season swing rates by pitch location, the whole season, and the second one is his 2014 season swing rates by pitch location to date.

Manny 2013 Swing Manny 2014 Swing

Of note, Manny Machado thus far in 2014 has swung significantly less at pitches out of the zone that are down and away, down and in, and up and in.  Also, he has focused on swinging at pitches that are middle in, middle, down, middle up, and even up and away. This allows him to extend his arms and drive the ball, especially the other way. In 2013, Manny focused much more on pitches in the middle of the plate and up and in. The swings at pitches that are up and in especially, and the other problem areas as well, zapped his ability to make solid contact and nosedived his 2013 offensive production.

Next up in this what is turning more and more into a slideshow are contact rate heat maps for 2013 (first picture) and to date in 2014 (second picture).

Manny 2013 Contact

Manny 2014 Contact

Manny seemed to make much more contact on pitches inside and outside the strike zone in 2013.  In particular, he made contact at a much higher rate on pitches up and in, down and in, and up and away. These are pitches that Manny simply cannot drive well, which means that if he is making contact with these pitches they are most likely to be outs, which in turn led to his struggles in the second half of 2013.  In 2014 his contact rates are much more concentrated within the strike zone and specifically middle in, down, and up. He is still making lots of contact on pitches too far up and away and down and away, but much lower than he was in 2014. This minimizes the bad contact and allows him to see more pitches that he can make hard contact on.

To bring it all home, below are two more heat maps. These heat maps are Manny’s batting average by pitch location again for the entirety of the 2013 season and the 2014 season to date. Again, the first one will be 2013 and the second one will be 2014.

Manny 2013 AVG

Manny 2014 AVG

These heat maps reveal more about how Manny’s approach at the plate has transformed. In 2013, the averages were decently high all around the plate and even out of the zone. However, this is not necessarily a great thing. Manny was swinging at pitches wherever they may be and his average was not great in many of those pitch locations. Fast forward to 2014, and the hitting zones are much more concentrated and with higher batting averages. The section that is middle in Manny is hitting .242 on pitches thrown to that location and is swinging 82% of the time at pitches in that location, tied for highest of any spot on his 2014 swing map.  He is swinging and driving pitches that are middle in, up, and down. He can drive the ball by extending his arms on up and away pitches and he can pull his arms tight to either pull the middle pitches or inside out them to center field or right field. These are the pitch locations that Manny can hit and hit hard and he is swinging more at those pitches than he was in 2013.

The adjustments made to Machado’s plate discipline provide a selective aggression that make him a better batter. As stated before, he is unlikely to become an on base machine. But, Manny has shown that he can hit doubles and home runs. If he maintains a higher average and his selectively aggressive eye at the plate he can continue to be an all star level player for the Orioles. Time will tell how pitchers adjust and how he adjusts, but the developments this year over last provide a great picture into Machado’s ability to adapt and thrive.

This post was originally posted to www.Orioles-Nation.com on 8/8/2014


Nick Markakis, What Happened?

Nick Markakis has carved himself out a nice major league career. He now has the 8h most hits in Orioles history and by seasons end he’ll likely be in sole possession of 6th place. Markakis, now with nearly 1,500 hits, at 30 years old has a shot at gathering 2,500 hits in his career. While hits are a compilation statistic,  that would still place him in the top 100 of all time. However, Markakis still strikes me as a player of unfulfilled potential. In his last four seasons, Markakis has not compiled a WAR higher than his rookie season (2.1 in 2006). His two highest WAR seasons—far and away—were at ages 23 and 24. In 2008, a season in which he compiled 6.1 WAR, he had the 11th highest total in all of baseball. To peak so young is a very odd career trajectory. While Markakis was on the path to being one of the best all around players in baseball, he cratered early. This loss in value is due to two reasons, which are readily apparent to date this season, a reduction in power and a reduction in defense.

Markakis early on posted decent advanced defensive numbers. But, since 2009 he has been bad according to the metrics. To follow up that up with some regular scouting, he has simply lost a step. He lost his range at a young age and has never been able to get it back. His arm keeps him respectable but he has even lost some of that strength as well. He remains a below average right fielder and it is not getting any better.

While his defense has hindered his overall value, the most critical aspect of his game to leave him at young age was his power. Markakis never hit many home runs, with a career high of 23, but the doubles were critical to his value. He had four straight seasons of 43, 48, 45, and 45. All fantastic numbers. In fact, after the 2010 season, he had a decent shot of reaching the top 10-20 for the all time doubles record if he kept up that pace. However, his homers and doubles fell following 2010. If he had maintained a 40 double, 15-20 homer pace over the course of his career, alongside his .300 batting average and decent walk rate, Markakis could have been one of the most valuable outfielders in the game. The graph below tells the story best of when he lost his power. Those are his season by season ISO and SLG numbers.

NickMarkakis_PowerGraph

Looking at the graph above, once can see that Markakis was average to above average in power production for his first handful of seasons. Starting in 2010 is when his power began to fall to below average. His numbers spiked in 2012, however that is his shortest season to date so the sample size is smaller than the other years around it. Also, 2012 was still lower in both ISO and SLG than 2007 and 2008. Since 2009, Nick Markakis has been a below average power hitter. And his most recent season, 2013, was his worst ever producing a paltry .085 ISO (.145 is considered average and .080 is considered awful) and posting a -.1 WAR number. But, the question still remains to why did he lose his power?

After watching Markakis for years and staring at hours of tape it is hard to tell if this power reduction is due to mechanical issues. Markakis has been known to change his stance and approach at the plate nearly every week. He will lower or raise his hands, stay open or close up, he is a constant tinkerer at the plate with his mechanics. I do not believe mechanics has anything to do with the steady power decline. Nor is it necessarily how pitchers are pitching to Markakis. Looking at the numbers, he is seeing a similar amount of pitches in the zone, a little less than the early years but nothing unexpected and in fact his rate has rebounded recently. Furthermore, the mix of pitches he is seeing is similar to his early years. It has not been an adjustment from pitchers. Rather, much like his defense, he simply lost a step earlier than most other position players do.

Looking at the two heat maps below. One shows his power peak years (2007 to 2010) and the one below that shows the last two seasons (2013 to 2014). They are ISO heat maps showing which pitches in which locations Markakis has been able to drive for extra bases.

Markakis2007to2010ISOMarkakis2013to2014ISO

Clearly, Nick Markakis has shown over the past two seasons to not be able to drive the pitches for extra bases that he once could. In particular the pitches in the outside middle of the plate—which if you remember those great Markakis years he could artfully fade right in between the center fielder and the left fielder for a double like clockwork—he has shown a clear ability to not drive for extra bases anymore. The only power left in Markakis’ game comes from pitches down and in and even then its limited power at best. Basically, he can still run into a meatball, but his double-hitting days are over. And with someone who cannot and has never been able to hit the ball out of the park readily, Markakis is basically a slap-hitting right fielder who can post some decent value at the plate, but nothing special.

The career arc is strange and unfortunate but clearly obvious. Markakis simply could not and cannot maintain the production of his early seasons. His skills broke down sooner than most. He is a nice piece and if he kept up his early pace, he would have been a steal on his current contract. However, unless he is brought back at a reduced price—or if Peter Angelos decides that loyalty is worth $17.5 million—Orioles fans better get used to having a new right fielder in 2015.

Article originally posted at www.Orioles-Nation.com


Is Bud Norris this Good?

Back in January, while everyone was still waiting around for the Orioles to sign a free agent, I wrote this post on what I thought about Bud Norris at the time. I came to the conclusion that Bud Norris pitched too few innings, gave up too many walks and home runs, and struggled too much against lefties to be an effective starter for the Orioles. I believed he was better suited to a bullpen role where his stuff would play up some and Buck could protect him against his horrendous splits. To date, Bud Norris has proven that diagnosis incorrect. Norris has posted a 3.58 ERA and averaged 6.27 innings per start and has been one of the better starters on the Orioles this year. I wanted to figure out what has made Bud better this year and see if he could continue his early season success.

The worst part of Norris’ game prior to this season were his bad splits against lefties. Last season, he had .387 wOBA against lefties, this seasons its a much more manageable .312. His HR/FB rate is down as well from last year’s second half and sitting at a more reasonable 10.9% this season down from 12.9% in the second half of 2013. Also, his walk rate is down to 6.8% this year while it sat in the second half of last season at 10.8%. However, Norris’ strikeouts are also down, he is striking out only 16.1% of batters this season while he struck out 23.0% of batters in the second half of 2013.  With the reduced walks and strikeouts Norris has been able to pitch longer into games this season.

Norris is not walking as many batters, controlling his home runs, improving against lefties, but he is also not missing as many bats as he used to. At first glance at some of the peripheral statistics one would say Bud Norris has been very lucky to this point in the season. The main reason being that his BABIP to date is .253. League average is somewhere around .300, meaning that 30% of balls put into play fall for hits. Norris is yielding hits at only a 25% rate on balls put into play. That would indicate some luck. However, I hate it when people simply list BABIP as reason for good or bad luck. It’s a decent indicator, but how balls are but into play matter most. Line drives fall for hits more often than ground balls and ground balls more often than fly balls.

Looking at the batted ball numbers, Norris has shown some  improvement. He has 20.5% line drive rate, a 43.0% ground ball rate, and a 36.4% fly ball rate. In the second half of 2013 he had rates of 22.7%, 39.5%, and 37.8% respectively. The reduction in line drives and increase in ground balls are good indicators that batters are barreling up the ball on Norris less than they did last season.  (Side note, while fly balls fall less often for hits than ground balls do, its better for a pitcher like Norris to have a higher GB% because he is home run prone and the Orioles infield defense is plus). All of his batted balls rates are around league average thus far into the season.

However, I would not be a good analyst if I did not tell you how he has gotten batters to make weaker contact against him. Looking at the tape reveals no major mechanical changes, unlike Matt Wieters for instance. He is a little higher in his set this year, a little taller on the follow through, but nothing of particular note. Bud Norris is simply pitching better this season. Looking at the graph below, all of his pitches are lower in the zone (the middle of the graph is the middle of the plate). In particular, he is locating his change up nearly half an inch lower than he did last season, indicating he is sharpening his command and refining that pitch. Also, his whiff rate on his change up is double what is was last season (6.5% in 2013 and 13.24% to date in 2014). This improved change up is likely what is helping him against the lefties.

Brooksbaseball-Chart (1)

Furthermore, as seen in the graph below, Norris’ velocity has increased with every pitch this season. His average fastball velocity is 1 MPH faster than last season. Velocity is not everything, but higher velocities tend to, regardless of location, induce weaker contact and make it harder to make strong contact.

Brooksbaseball-Chart

There are good and bad sides to Bud Norris’ start to the 2014 season. The good side being a lowering walk rate, better results against the lefties, a controlled home run rate, increased velocity, and improved pitch location. The bad side of Norris’ start to date this year is the decreasing percentage of which he is getting hitters to swing and miss and his unsustainable low BABIP (even with the slightly improved batted ball numbers). His plummeting strike out rate and low BABIP even with the increased velocity and location are bad signs moving forward.  Bud Norris has been a better pitcher than he was last year, but I highly doubt he is a 3.5 ERA pitcher for the entirety of the 2014 season.