Archive for nationals

2016 Cubs Run Differential

In this post, I take a look at the 2016 Chicago Cubs though their first 100 games. I’ll start out by focusing on the Cubs’ run differential (Runs Scored – Runs Allowed). After a historic start, they reached their pinnacle after the 67th game of the year against the Pirates. At this point, the Cubs were 47-20 and had outscored opponents by 171 runs! Since then, the ball club is 13-20 and their current run differential is at +153.

Still, the Cubs’ +153 mark is 42 runs better than the next-closest team (Washington Nationals). The Cubs and Nationals are the only clubs to have a run differential that is greater than +100. The second-place Cardinals rank third in the league at +95 right now. While the Cubs dominate the top end of the spectrum, the Reds and Braves are running away with the worst run differentials in the league. The Reds have a -143 mark, largely due to the thrashings they have taken at the hands of the Cubs so far in 2016. The Braves have the second-to-worst differential at -134 runs.

Projected Runs to Wins

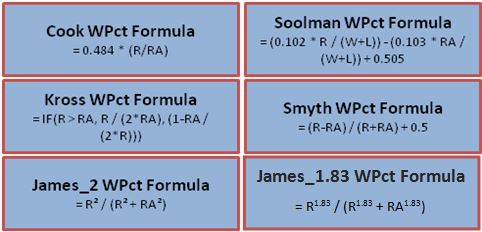
In another place, I introduced the “Pythagorean Theorem’s of Baseball” which basically tries to determine the number of games a team will win based on their number of runs scored and number of runs allowed. Here are the formulas for six of the most common win-percentage projection formulas:
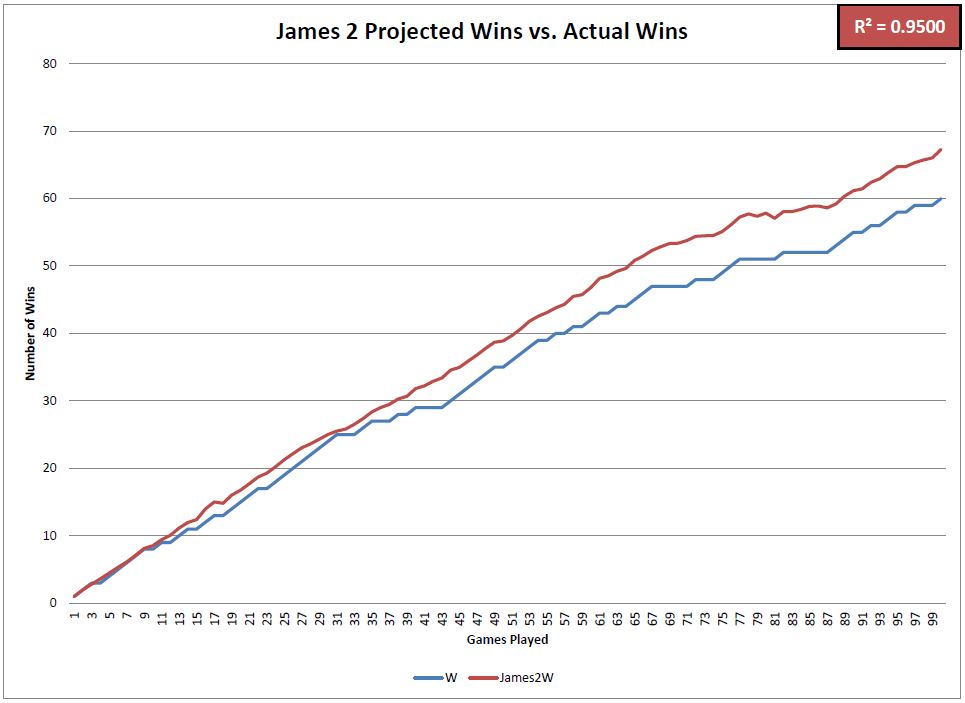
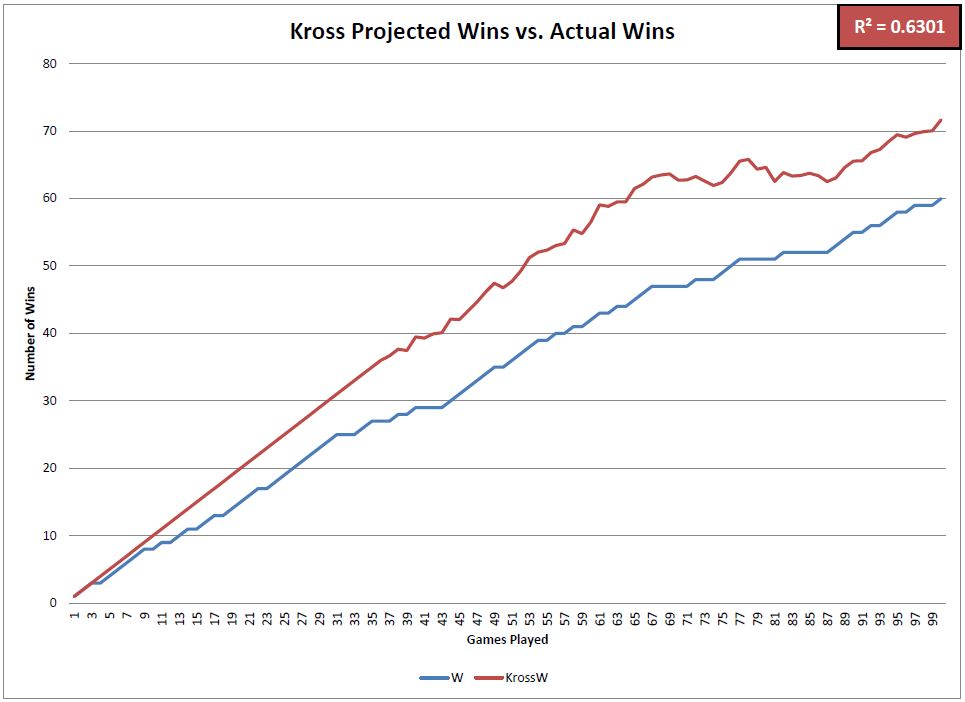
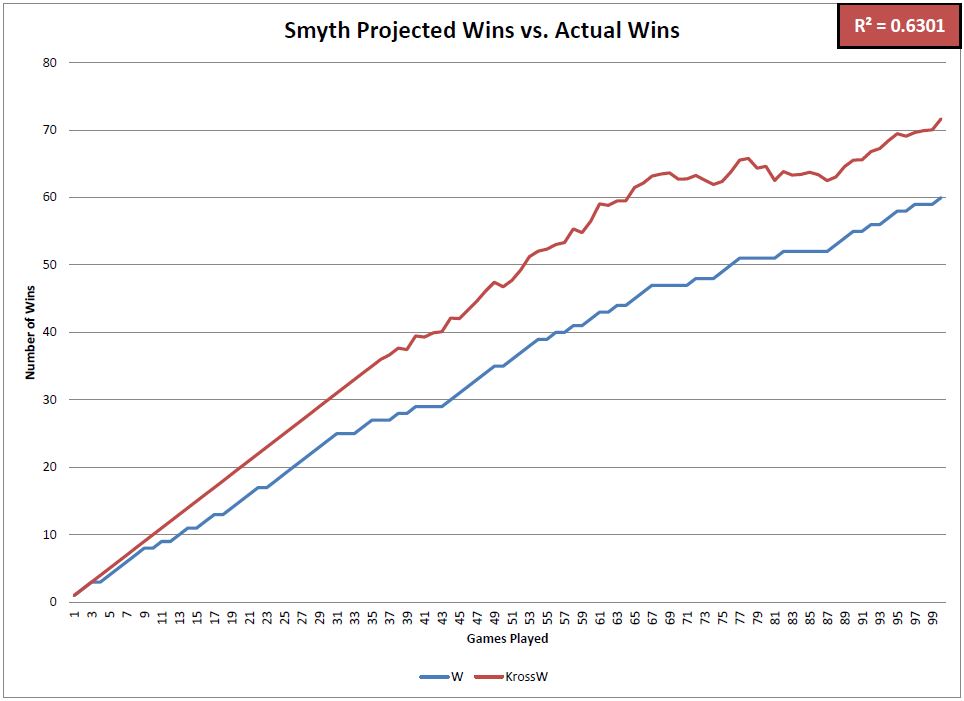
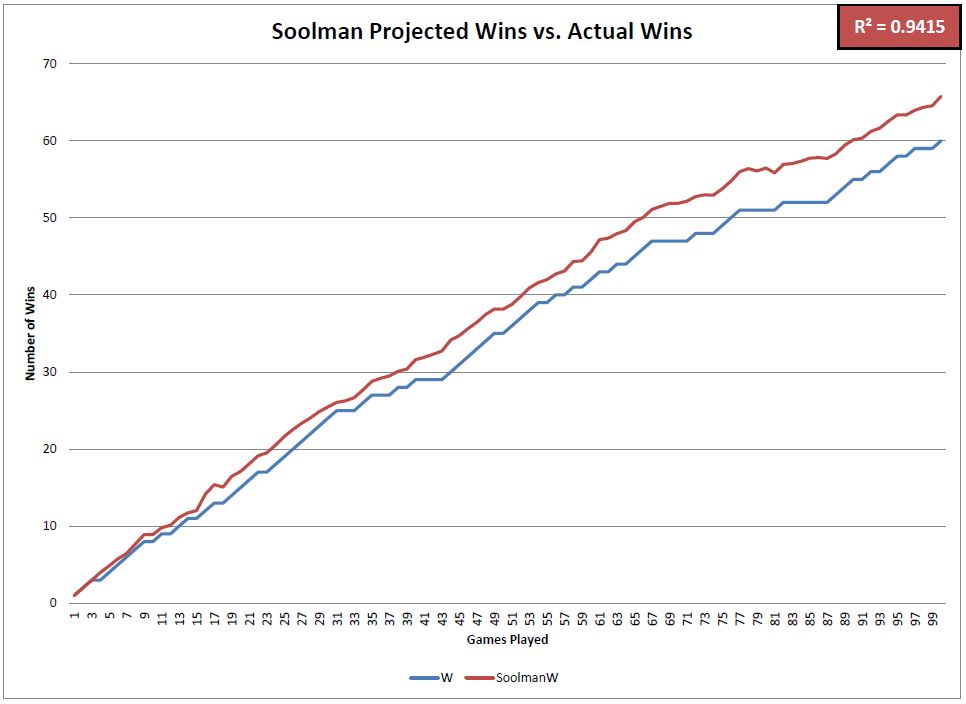
I added up the Cubs’ total runs scored and total runs allowed after each game this year and compared their actual number of wins to the projected number of wins based on each formula. These charts visualize the differences between those numbers.

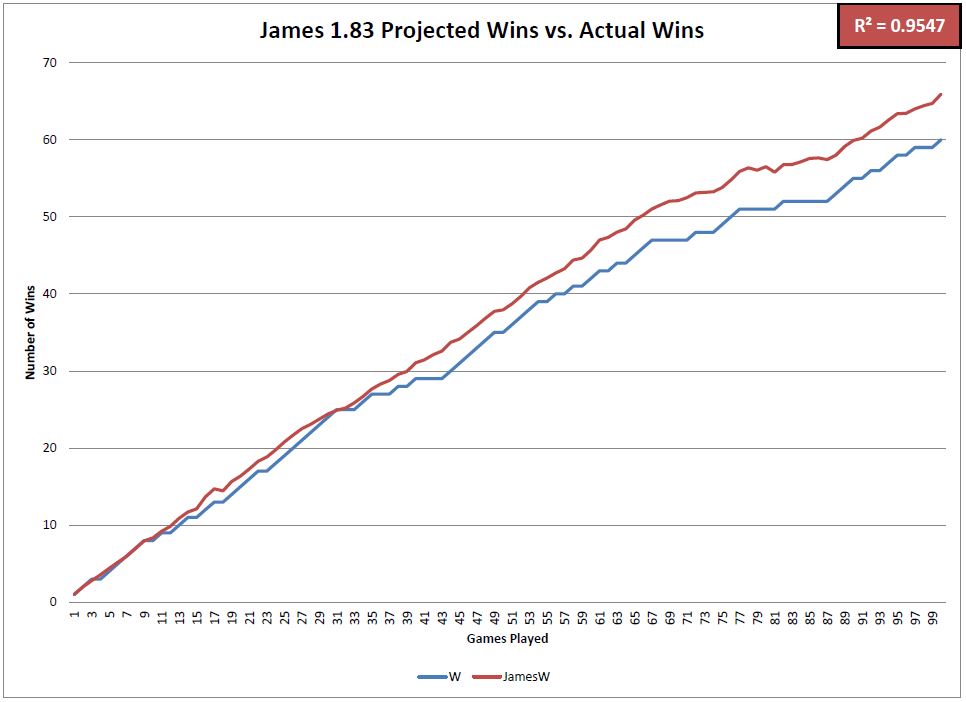
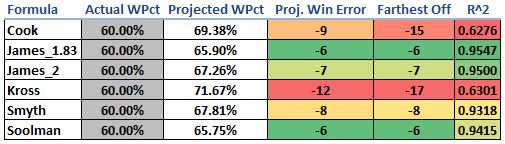
This matrix summarizes how accurate each of the projection formulas has been in predicting the Cubs’ winning percentage and total number of wins so far in 2016. The most accurate formulas was the James_1.83 followed by the James_2 and Soolman. Four of the six formulas were very good predictors, but the Cook and Kross formulas overforecasted the number of wins that they expected the Cubs to have. Notice that at one point this year, each of those formulas projected the Cubs to have over 15 more wins than they actually had. The R^2 value (coefficient of determination) is indicative of how well the projected win percentage matched up to the actual win percentage after each game this season.

All in all, the Cubs have should have at least six more wins this year based on these formulas. Scoring as many runs as they have (4th most in the MLB) and allowing as few runs as they have (T-1st in the MLB) should result in an even better record than 60-40. We knew it was unlikely that they would keep up their record-setting start in the run-differential category, but it will be interesting to see how these numbers match up as the season progresses.

@CubsAdvMetrics on Twitter


Stephen Strasburg Is Better Than You Think

To a casual baseball fan, Stephen Strasburg’s numbers are not pretty. The owner of a 4.76 ERA and a 1.38 WHIP, Strasburg is clearly having the worst season of his career. But how bad has he been, really? Not as bad as you think. Take a look at these 2015 stats:

Player A: 3.48 xFIP, 22.8 K%, 5.5 BB%
Player B: 3.31 xFIP, 24.1 K%, 5.3 BB%
Player C: 3.18 xFIP, 24.9 K%, 6.0 BB%

Player A is none other than Johny Cueto, recently traded to the Kansas City Royals. 12th in ERA among qualified pitchers, Cueto is widely considered among the best, and perhaps deservedly so with five straight years of a sub-3 ERA. While he has consistently outperformed the above metrics, they are still indicative of general pitcher performance and should not be overlooked when comparing the quality of different pitchers.

Player B actually has the fifth lowest ERA among qualified pitchers and was also traded at the deadline. He’s been one of the most reliable pitchers over the past five years and has been an ace on every staff for which he’s pitched. Player B is David Price.

Player C is obviously Stephen Strasburg, and as you can see, his peripheral stats stack up against the best in the game. In addition to these 2 players, Strasburg also compares positively to others like Sonny Gray and Scott Kazmir, both of whom have better ERAs but a worse xFIP, K%, and BB%.  Strasburg is pitching like an ace, and xFIP shows that, so why have his results been so poor?

Well, first of all, there’s his .345 BABIP. Not only is this high compared to the league average (.296), it’s well above his career mark of .302. Considering he’s not giving up any more line drives or hard contact than usual, his BABIP should fall back to around the .300 mark and bring his ERA down with it.

Not only is his BABIP at an all-time high, his LOB% is at an all-time low. Currently at 65.3%, it figures to inch back up to his career 73.2% mark, or at least to the league average of 72.4%. Considering his strikeouts have not dropped off, there’s no reason for his drop on LOB%, and it can simply be chalked up to bad luck, something that he’s had plenty of this year.

Looking at these stats, there’s nothing that suggests Strasburg is anything but unlucky. However, as Jeff Sullivan pointed out here, Strasburg’s problem could stem from the injury he suffered in the spring. He had apparently adjusted his mechanics to compensate for the discomfort, and even though it appears as though he has fixed this, it’s possible that when pitching from the stretch and in higher leverage situations, he returns to this altered motion by default. When looking at the difference in Strasburg’s stats between pitching from the windup and the stretch, this is what we see:

K% xFIP
Bases Empty 30.1 2.73
Runners on Base 17.0 3.98

Evidently, this claim has some ground. Strasburg is clearly having some problems with runners on base, particularly in striking batters out. Before we deal with the strikeout numbers, let’s take a look to make sure that he’s not just getting killed during the at bats that don’t end in strikeouts.

GB/FB Batted Ball Velocity (mph) Hard Hit % Infield Hit %
Bases Empty .98 89 29.7 4.5
Runners on Base 2.05 88 28.7 12.2

Strasburg is actually generating more ground balls and weaker contact with runners on base. His infield hit percentage is triple what it is when the bases are empty, something that can be attributed to luck. With such weak contact, it’s safe to say this isn’t the problem. So it must be the strikeouts. If we take a look at his whiff rates, the results are intriguing:

2010-2014 2015
Bases Empty 20.1% 17.5%
Runners On Base 17.9% 8.6%

OK, so there’s definitely a problem here. With runners on base, he’s only whiffing batters at half the rate he’s done previously in his career, as well as half the rate that he does with the bases empty. So what’s the issue? Well, it’s not his pitch velocity:

4 Seam 2 Seam Changeup Curve Slider
Bases Empty 95.1 mph 95.4 mph 88.4 mph 81.3 mph 86.7 mph
Runners on Base 95.2 mph 94.9 mph 88.0 mph 81.5 mph 87.2 mph

Strasburg’s average velocity with runners on base is 91.5 mph, compared to 91.0 mph with the bases empty, so he’s actually throwing the ball harder when there’s runners on base. That can’t be the problem. He’s also not walking a significant amount more batters when there are runners on base, so it’s not like he’s sacrificing control for increased speed.

Without any numbers to provide a reason, it appears Strasburg’s struggles when striking out batters with runners on base are either based purely in luck or are completely mental. This is not necessarily a good thing, as we have no idea if or when he will sort it out. With his skill, Strasburg has the potential to be one of the best in the game. He just needs to get out of his own head, and maybe get just a little bit luckier.


The Curious Case of Cody Dent

From my personal blog: msilbbaseball.wordpress.com

Path to the Draft

     What’s the usual story with first-year draftees?  They put up stellar numbers in college and/or high school, but can’t replicate those numbers after they’re drafted due to better competition in the minors.  A college All-American who hit .400 can struggle to stay above .200 as they adjust to minor-league ball.  It’s nothing to worry about, just the way things go.  So what would you expect to see from a college senior infielder, converted outfielder, converted back to infielder who hit .176 in 330 career at-bats, who didn’t hit a home run until the end of his last season, and who only had six extra-base hits in his entire college career?  I’d have my doubts that this player would even record one minor-league hit.  However, I present to you Cody Dent, the man who’s mirroring the trend.

Speaking of home runs, his father did this.

     Cody played for four years at the University of Florida, and reached the College World Series three times.  Throughout his career, he was a light-hitting utility infielder who saw a majority of his time as a defensive replacement.  During his senior year, Dent started 48 games for the Gators, but his struggles at the plate still remained.  Cody hit .233 his freshman year, then .207, .134, and .169 in each subsequent season.  But, he’s 6th on UF’s all-time sacrifice bunt leaderboard with 26 in his college career.  So, that’s something; It seems like he’d make a good-hitting pitcher.

Cody Dent Bunting for the University of Florida

     Dent’s bright spot was the 2011 NCAA Tournament, where he played in and started 11 games, and hit .273 with a double, triple, and 4 RBIs as the Gators made it the championship series in Omaha.  He was named to the All-Tournament team.  Following his senior season, the previously undrafted Dent was selected by the Washington Nationals in the 22nd round of the 2013 First-Year Player Draft, likely/hopefully for his defense.

Faux-Struggles?

     As a student a the University of Florida, I attended a large amount of baseball games, and I always rooted for Cody to do well.  He never showed negative body language, and went about his business professionally.  Also, he was the king of the “at ’em ball”.  I can’t count how many times he’s hit a rope right at an outfielder.  I always imagined what kind of horrible BABIP Dent would have, so I calculated it.  During his senior season, Cody Dent had a .193 BABIP.  With an average BABIP ranging from about .290 – .310, this created a huge dent in his average (pun intended).  Some players have established BABIPs in a different range (ex. Miguel Cabrera and Ichiro Suzuki around .345), however .193 can not be the true average for an SEC starter with MLB bloodlines.  By personally watching Dent play, I can also attest that he’s better than the numbers show.  I consider BABIP to be a measure of luck, and use it to determine whether a player is playing at their true ability.  A BABIP far under the average means that a player is under performing, and a BABIP far above the average means that a player is over performing.  To re-iterate, Dent’s senior BABIP was .193.  This, coupled with only an 11.7% Strikeout Percentage (K%) creates a sense of hope that Cody could grow into a serviceable/not as dreadful bat.

Dent’s Adjusted AVG

Professional Performance

     So what does he do during his first 27 games in Short-Season A ball?  Hit .278/ .365 /.300 with a .326 wOBA and a 108 wRC+.  With 100 being the standard average for wRC+, this means that Cody Dent is an above-average producer in Short-Season A ball.  ABOVE AVERAGE!!!  Considering the offensive woes he went through as a Gator, this is absolutely huge.  Maintaining his improved offense will be a challenge for Cody, as he’s in danger of regressing.  Dent’s minor-league BABIP is .387, way above average, and astronomically above his college numbers.  Is this a sign of the real Cody Dent?  Is he having a lucky month?  Or has Cody Dent gone through enough punishment and suffering from the baseball gods that they’re rewarding him for his perseverance?  It’s time to sit back and watch The Curious Case of Cody Dent.

Like Father, Like Son

     Also, now he’s breaking up perfect games. This came against the Lowell Spinners, the Boston Red Sox’s New York-Penn League team.  The pure perfection of this can’t be explained. Cody “Bleeping” Dent!