Archive for mike trout

Stars or Depth? What Is the Best Way To Build an MLB Roster?

Building an MLB roster is anything but simple, to say the least.

It would be very convenient if it was as easy as playing MLB: The Show, but as we are well aware of, there are many complexities to roster construction. Not only do organizations need to have high-end talent, but they also need to have 26 quality big-leaguers as well other players in the pipeline when adversity hits.

In a perfect world, teams would be able to have tons of star talent as well as intriguing depth. However, we do not live in a perfect world, and for that reason, teams need to adopt a specific strategy when it comes to building the best roster possible in the most efficient way imaginable.

Teams have generally two courses: will they prioritize star talent, or will they look to have as deep a team as possible? The first option is typically known as the “stars and scrubs” approach, and it is one that you see often see in basketball. Meanwhile, the latter approach is one that you’ll see with sports with deeper rosters, primarily football. Overall, both methods are used frequently by teams, but it is unclear which one is the more efficient when it comes to roster building.

What good is there to posing a problem if we aren’t going to find the answer for it? We need to dig deep into these two approaches! Should teams prioritize star talent even if it means their depth is lacking? Or is quantity more valuable than quality? Let us try to discover the answer to this critical question! Read the rest of this entry »


2019 MVP Winners as Voted by Dead Sportwriters

“Alex Bregman is the runaway AL MVP for 2019” – MVP voters from the 1950s & 1960s

“Mike Trout finishes a disappointing 5th in 2019 AL MVP voting” – MVP voters from the 1960s & 1970s

“Christian Yelich is the near-unanimous 2019 NL MVP” – MVP voters from the 1980s & 1990s

“Xander Bogaerts narrowly misses the 2019 AL MVP” – MVP voters from the 1960s & 1970s

The Evolving MVP Voter’s Criteria

The winner of the MLB MVP awards is a function of two factors: How the players performed, and how the electorate evaluated that performance.

Much attention is paid to how players perform and how they stack up historically to peers from different eras, but for MVP selection, little attention has been paid to how the electorate has changed and shifted the definition of the Most Valuable Player.

Since 1931, the Baseball Writers Association of America (BBWAA) has voted and awarded each league’s MVP award. Over this period of time, the world’s understanding of player performance and what contributes to winning has changed dramatically. The 1931 voters probably looked at home runs, RBIs, and batting average leaderboards printed at year-end in their daily newspaper before filling out their ballot. That’s not to accuse them of being narrowly minded, it was just all they had available to them and all the baseball world knew to look at.

On the other hand, the 2019 voter (hopefully) spent at least a few minutes on FanGraphs or a similar site looking at things like WAR, wRC+, and DRS, and at best also considered advanced Statcast data and maybe even built their own AI-powered simulations to model a season without the player to see how much worse their team performed. At least, that’s what I would do if I had a ballot, and that’s what I would call “responsible voting” in 2019. Read the rest of this entry »


The Elite Imperfections of Mike Trout

It’s hard to tell exactly what’s going on with a player when their numbers get skewed. Sometimes its injury, others could be due to team/manager/front office resentment, more often than not it can be attributed to bad luck. However, when numbers begin to become conventional or eclipse career norms on a regular basis, under certain conditions, it behooves me as a curious self-proclaimed ‘baseball scientist’ to look into that.

Today’s subject is one Mike Trout of the Los Angeles Angels. Observe his monthly OPS through his seven seasons in Major League Baseball.

troutMonthOPS

Before I proceed, this is not an indictment or deposition on Trout. This is a scrutinization that will attempt to answer why his OPS drops so sharply once we hit the dog days of summer.

Trout is a great player, no one can deny that. You ask just about any baseball player if they’d like to have numbers like Trout and they’d answer before you even finish the question.

A simple assumption through basic observation would be that it’s the fault of the three true outcomes; striking out more and walking less while his power remains the same or takes a dive as well. Since I don’t have a better explanation yet, we’ll stick with that.

But first, I wanted to see if Trout was any sort of outlier; does the average player peak mid-season, then drop off as Trout does? Sort of.

mlbMonthlyOPS

I see the same dip, somewhat as steep for Trout, in July but followed by a resurgence into August. OK, so nothing extreme; basically the same start with a disjunct finish.

Going back to his monthly performances, what also stood out is that as his at-bats increased, his OPS seemed to decrease. However, that only occurred once he surpassed 500 ABs. In the scatter plot below, the coefficient of determination reveals that just about 60% of Trout’s OPS change is attributed to his increase in ABs. That’s a pretty good interrelationship.

troutScatterOPSAB

So far we know that Trout seems to fade in late summer and that his OPS plummets as his at-bats go up. Is it as simple as that? I can somewhat understand that as the season progresses, players get worn out and, sometimes but not always, their production drops. But the ABs situation makes it more intriguing; you’d think a great hitter is usually always great regardless of the number of times he comes to bat. It doesn’t always follow that the more chances you have the more likely you are to fail.

Remember my original supposition of K/BB/HR variation causing his OPS drop? That’s an invalid inference because we have the same thing happening; as ABs increased, his strikeouts and walks did also. Home runs bounced a little with no correlation to AB figures.

troutPercentIncrease

Trout’s strikeouts did jump quite a bit from June to July while his walks increased at the same rate as his ABs. However, his biggest OPS drop-off was from July to August, so we can’t parallel that to a conclusion. The following month (July to August), his ABs increased at the same 11% with both walks and strikeouts growing at the identical rates.

Not satisfied, I needed a couple of player comps to see if they showed any of the similar tendencies I see with Trout. Using his career wRC+ (the best all-inclusive offensive stat) of 169, I see Joey Votto, Miguel Cabrera, and David Ortiz in his range.

  • Votto- 162
  • Cabrera- 158
  • Ortiz- 151

Now, lets move back to their OPS. I took the quad’s career monthly average and created a comparison chart. Keep in mind we aren’t concerned about the numbers, only the trends.

And, because I’m a cheapskate, I have to use Google Sheets to create this chart which will not let me customize the labels.

 So you have: Trout, Cabrera, Votto, Ortiz

compareCareerMonthlyOPS

Cabrera dips about the same time as Trout but his trend line is much more stable. Votto seems to get better as the season goes on, while Ortiz seems to match pretty well except for his minor improvement in Sept/Oct.

So, is Trout and anomaly? Not really; Oritz has very similar tendencies, but also played twice as long as Trout has. To say for certain they match will take more playing time for Trout. In any case, for a player as good (and highly regarded) as Trout, that drop-off is still vexing.

So, I moved on to check and see if his hitting tendencies change. We can view Trout’s career monthly contact figures to determine if there are any obvious signs that could give any sort of explanation for the drop. Things like putting more balls on the ground instead of the air, contact type such as line drives which end up as hits more often, any infield pop-ups indicating a change in swing path, and directional hitting in regards to beating any sort of “shift” to his hitting proclivities (e.g. more balls are finding well-positioned fielders).

contactTypeTrout
A couple of things stand out. The first being his line drive rate; dropping from 23.6 to 19.2 from June to Oct. Secondly his hard contact; while not a huge difference, we can see less potential for barreled contact. Lastly, as you would expect, his BABIP and OPS drop sharply from June on; .395 to .333 and 1.036 to .919 respectively.

Perhaps looking into what causes line drive as well as his hard contact regression will provide the answer; are there changes in exit velocity and/or launch angle? As a reminder, we only have the data that is available through the Statcast era (2015-2017), so take this with a grain of salt; I’m not sure we can glean much from it but its worth looking because it covers roughly half of his career.

  • June- 13.8 degrees/91.6 mph
  • July- 13.9 degrees/91.4 mph
  • August- 14.3 degrees/91.3 mph
  • Sept/Oct- 14.7 degrees/91.1 mph

There are drops but the change is slow; launch angle changes by nearly one degree and exit velocity declines by .5 MPH. Can we claim that as the cause? It’s hard to say because as I noted, it only covers his last three years.

To reinforce the lack of apparent swing path/tendencies, observe the gif that goes in chronological order from June through Sept. Do you see any pronounced change, because I don’t?

troutLA

Perhaps I’m thinking about this too hard. Perhaps I’m asking the wrong question(s). Perhaps its just the way it is; sometimes you eat the ball and sometimes the ball eats you. As I said before, this isn’t a judgment or doubt on Trout’s ability; when he’s at his worst, he’s still better than most of the other hitters in the league.

This post and others like it can be found over at The Junkball Daily.


Sizing Up the “Most X of the Decade” Races; Plus Bonus Trout Stuff

Admittedly, this is a bit of a stupid topic. These distinctions are often thrown around with an air of importance that is far from earned. Nobody ever mentions that Hank Aaron had the most RBIs in the 1960s. You don’t need to talk about arbitrary endpoints with the Hammer. Mentioning that a player holds one of these “records” is a bit like saying a guy you are trying to set a friend up with has a great personality. It’s likely that this is covering up for something else like a hat covers a balding head.

(*before you head to the comments to blast me, yes, RBI is an incredibly useless statistic)

But they are fun! Hank Aaron did lead in RBI in the 1960s, but he finished second to Harmon Killebrew in home runs. Growing up into a baseball fan in the 1990s, one of the bigger surprises in this genre of record was the hit leader of that decade: Mark Grace. I’d imagine every Cub fan knows this. In addition, anyone who knows a chatty Cubs fan probably knows this, too. Looking at the most recent decade, there are a few surprises: Miguel Tejada had the most games played and at-bats. Andy Pettitte edged out Randy Johnson for most wins. Johnson, along with Alex Rodriguez, dominated most of the categories.

Moving to the point of this article, here is a quick rundown of compelling and not so compelling races to have the most X of this decade, with two seasons remaining:

WAR

You, the Fangraphs reader that goes into the depths of the Community Research section, probably know who leads this category, despite spending 2010 in A ball. But it is a bit closer than you might have thought. While Trout could conceivably win the position player award while sitting out the next two seasons (Joey Votto is the only player that might topple him in this scenario, and he is 9.1 WAR behind), this is the one major statistical category in which position players and pitchers compete with each other.

If I just jogged your memory of that, you probably know the name that is coming: Clayton Kershaw. Trout leads with 54.4 WAR. Kershaw has 52.1 WAR on the pitching side, but has also accrued 1.8 WAR as a batter. That should count. So Kershaw, at 53.9 WAR, is directly on Trout’s heals. Trout is still the heavy favorite, but Kershaw has a puncher’s chance, especially if another injury befalls Trout.

Totally made up odds: Trout, 98%; Kershaw, 2%

Hits

Jose Altuve has put up four straight 200-hit seasons, but he is 251 off the pace and in 15th place. No, this title will most likely go Robinson Cano. Cano leads with 1501, and the only players within sniffing distance are similarly on the downside of their primes. Miguel Cabrera is second at 1416, and then there is a slew of players, including Fangraphs favorite Nick Markakis, in the low to mid 1300s.

Cano should clear 150 hits the next two seasons, and if he does, he will not be passed. Cabrera, as bad as he looked at times last season, would be the likely beneficiary of some unforeseen collapse by Cano. Elvis Andrus is the end of that slew of players behind Cabrera. He has 1329 hits, but recorded 191 last season and is significantly younger than everyone in front of him. I’m going to give him sleeper status for this title.

Totally made up odds: Cano, 93%; Cabrera, 5%; Andrus, 2%

Home Runs

Currently, this is an incredibly close race, with four players within five homers of each other at the top of the list. Jose Bautista is first with 272. Edwin Encarnacion and Nelson Cruz are second and third, and then you get to Giancarlo Stanton in fourth place with 267. Other than Miguel Cabrera and the remnants of Albert Pujols, no one else is close. Stanton has to be the favorite, here, but his status is extremely tenuous. First, let’s just get Buatista out of the way. He’s unemployed and several steps below the other players even if he does try to gut out two more seasons.

Without a doubt, it would be shocking if a healthy Stanton didn’t win this. But a healthy Stanton would be at least a little bit of a shock. The once-oft-injured Cruz and Encarnacion are 37 and 35, respectively, but are still mashing and project for mid-to-high 30-something homers apiece. Cruz has played four straight full seasons and E5 has three straight under his prodigious belt. Stanton is projected by Steamer for a literally—but not really literally—bananas number of 53 home runs. The Fans of Fangraphs are more modest, pegging him with only 48. But Stanton is injury prone. You all know that. There is no argument that he is not. So this is a fairly open race.

Totally made up odds: Stanton, 55%; Encarnacion, 25%; Cruz, 20%

RBI

Again, I do know this is a stupid statistic. But artificial endpoints of decades are pretty stupid, too, so this is fitting. This is Miguel Cabrera’s title to lose, and as long as he plays, he should easily win. And guys making the cash Cabrera is due for the next thousand years generally get every opportunity to play. Sitting behind Cabrera’s 860 RBI are Albert Pujols at 806 and Robinson Cano at 789. The aforementioned Edwin Encarnacion and Nelson Cruz round out the top five with 763 and 756 respectively.

If Cabrera falters, this looks like it would be a wide-open race. Pujols achieved the remarkable 100+ RBI season while losing 2.0 WAR last year. He likely will do much worse, but as long as he is playing, he will continue to accrue a decent number of RBI. E5’s Indians outscored the M’s by 68 runs last year and seem to be a better offensive team, but Cano does have a 26 RBI lead. Honestly, this looks like a virtual toss-up if Cabrera doesn’t win, but the idea of Edwin Encarnacion or Nelson Cruz leading the decade in home runs and RBI is rather delicious.

Totally made up odds: Cabrera, 80%; Cano, 7%; Encarnacion, 6%; Cruz, 4%; Pujols, 3%

Stolen Bases

Be honest, which would you rather be known for: a surprise answer to the question “who stole the most bases in the second decade of the new millennium?” or hitting an epic World Series Game Seven home run… for the losing team. Rajai Davis might say porque no los dos? Davis has the most stolen bases this decade with 301. However, he is actually a longshot to keep this title. Davis just signed a minor league deal with the Indians that includes a non-roster invitation to spring training. He will likely struggle to ever get regular playing time again. He’s 37 years old.

This will likely come down to a race between the two guys behind him. Dee Gordon has 278 stolen bases, had 60 last year, and only turns 30 in April. He has a 35 stolen base lead on 3rd place, which would seem more insurmountable if that person was not arguably a full tick or two faster. Billy Hamilton has 243 stolen bases since coming into the league in 2013, and has been remarkably consistent, stealing one more base each year than the year before. The fans think he’ll do that again this year, hitting 60 stolen bases. Hamilton is over two years younger than Gordon, and might be faster, but the 35 stolen base edge Gordon enjoys makes him the clear favorite.

Totally made up odds: Gordon, 66%; Hamilton 33%; Davis, 1%

Wins

This is likely a two-person race between Max Scherzer and Clayton Kershaw who have 132 and 131 wins respectively. Justin Verlander and Zack Greinke sit enough off the pace at 123 and 122 to make a comeback very improbable absent an injury, but close enough to make a comeback very possible if both players in front of them miss significant time.

Moving to who I give the edge to: there just isn’t a lot separating these two. Scherzer is older, but Kershaw has had a bit more in the way of nagging injuries lately. If it truly were a push going forward, I could just go with Scherzer since he is one ahead at the moment. But I’m going to give Kershaw the ever-so-slight edge because the Dodgers are almost assuredly going to be one of the best teams in baseball the next two years while the Nationals might only have that status for the next season. Verlander gets the nod as more likely spoiler for a similar reason: the Astros are ballers.

Totally made up odds: Kershaw, 45%; Scherzer 43%; Verlander, 7%; Greinke, 5%

Saves

Craig Kimbrel should put this away by midseason. At 291, he ranks 61 ahead of Kenley Jansen and Fernando Rodney, who are tied for second with 230. Aroldis Chapman sits in 5th with 204. Kimbrel’s consistency and consistently light usage should ensure that he continues to rack up saves the next two seasons. Even a repeat of his comparatively modest 66 saves over the last two seasons would give him a realistic lock on this honor.

If Kimbrel does fall apart, the 30-year-old Jansen would be the likely beneficiary, as he has a much stronger hold on his 9th inning role than the 40-year-old Rodney. While Kimbrel might have this decade locked down, he will likely fall short in his quest to surpass Rivera’s total from the last decade. Rivera saved 397 games that decade. It should be noted, however, that Kimbrel barely pitched in the majors in 2010 and recorded only one save. On the other hand, he’s already blown one more save than Mariano did all of last decade.

Totally made up odds: Kimbrel, 97%; Jansen, 2%; Rodney, 1%

Strikeouts

Stop me if you’ve heard this before, but this is a two-man battle between Max Sherzer and Clayton Kershaw. Only this time, there is a much clearer favorite. Scherzer leads Kershaw 1909 to 1835. He essentially built that entire lead last season when he recorded 66 more strikeouts than the limited Kershaw. But Kershaw’s innings shortfall was not the only thing at play here. Scherzer struck out 1.63 more batters per nine innings. For the decade, Scherzer has a 74 strikeout lead in only 14 1/3 more innings. The only realistic path for Kershaw to overtake Scherzer is injury. Of course, with pitchers, injury is always a legitimate and significant risk.

Behind Scherzer and Kershaw is Justin Verlander with 1670. No one past Verlander has any legitimate shot barring a mass retirement of the some of the game’s best starting pitchers. At the end of the day, this is really a question about health. But for Kershaw to overtake Scherzer, he’d not only need Scherzer to get hurt, but he’d have to stay healthy himself.

Totally made up odds: Scherzer, 79%; Kershaw, 19%; Verlander 2%

Runs

This has been a very positive article, but let’s get a bit negative for a second. Which pitcher will give up the most runs in this decade? A big factor in this, of course, is that giving up a lot of runs is bad, and playing bad usually leads to not playing. You have to be good enough to get the ball on a regular basis, but bad enough to rack up the runs allowed. Our frontrunners are honestly not terrible pitchers. Rick Porcello leads the way with 789 runs allowed. James Shields is just behind with 778 runs allowed. Porcello is 29, started a playoff game last year, and is owed a lot of money through the end of the decade. He also won the Cy Young Award in 2016 while accruing 5.1 WAR on the mound. He should have opportunities to add to this total. Porcello underperforms his peripherals, but only by a little. He is basically good enough to never get moved out of the rotation, and durable enough to throw over 1500 innings this decade, but has a suddenly-not-great-for-the-era ERA of 4.29 over the last eight seasons.

James Shields is slated to maybe start opening day 2018. Unlike Porcello, Shields has been dreadful the past two seasons. Yeah, the White Sox starting pitching this year might be awful. Shields is owed a lot of money in 2018, but 2019 is an option that will only be picked up if Shields has a dramatic turnaround. Thus, there is a bit of a catch-22 here. If Shields plays well enough to keep getting the ball regularly into 2019, it seems unlikely that he’ll chase down Porcello. Of course, this could also come down to injury. If either player gets hurt, the other will very likely take this notorious (dis)honor.

Ubaldo Jimenez sits in 3rd with 734 runs allowed. He will thankfully have a hard time adding to that total. If Porcello and Shields find themselves with quick hooks and no jobs, there are a few possible dark horses, including Ervin Santana and Jon Lester, who at the very least should get two full seasons of starts barring injury. For this one, I’m just going to put the field as a third choice rather than trying to single out who might suck, but play.

Totally made up odds: Porcello, 60%; Shields, 30%; Field, 10%

Other Interesting Battles

(My favorites in italics)

Games: Robinson Cano, 1264; Alcides Escobar, 1250 (that would be something)

Runs: Ian Kinsler, 785; Miguel Cabrera, 741; Andrew McCutchen, 740; Robinson Cano, 738

Strikeouts: Chris Davis, 1266; Mark Reynolds, 1250; Justin Upton, 1249

HBP: Shin-Soo Choo, 98; Anthony Rizzo, 98; Chase Utley, 92

Games: Tyler Clippard, 576; Luke Gregerson, 551

Innings Pitched: Justin Verlander, 1705; Max Sherzer, 1670.2; Clayton Kershaw, 1656.1

HBP: Charlie Morton, 82; Justin Masterson, 77 (23 in AAA in 2017)

Balks: Clayton Kershaw, 17; Franklin Morales, 15; Johnny Cueto, 13

Bonus Trout Stuff

You will notice that, apart from WAR, Mike Trout was not mentioned at all in this article. Of course, Trout played zero MLB games in 2010 and only 40 in 2011. But he is also an all-around performer. He doesn’t even show up in the top 10 for most counting categories. So for the lazy, here is where Trout ranks in the decade (if among top 30, must be qualified for rate stats):

Triples: T-8th (40)

Home Runs: T-16th (201)

Runs: 8th (692)

RBI: 30th (569)

Walks: 7th (571)

Intentional Walks: T-14th (61)

HBP: T-27th (55)

Sac Flies: T-16th (40)

Stolen Bases: 17th (165)

Batting Average: 6th (.306)

OBP: 2nd (.410) (not close to first, Joey Votto, .438)

Slugging%: 1st (.566) (biggest threat is probably Giancarlo Stanton, at .554)

Trout is about to play his age 26 and 27 seasons to round out the decade. He’ll be an “old 27” with his August birthday. We don’t know how he’ll age. But it is possible that he plays his whole career, a career of an inner-inner-circle Hall of Famer, and never leads a decade in any traditional counting stat. This on top of his frustratingly low MVP totals. If nothing else does, perhaps that should tell you how stupid this whole exercise is, and how stupid rigid benchmarks for greatness are in general. If Trout were born three years earlier, he could have dominated the counting stat leaderboards of this decade. If he played for a better team, he could have 2-3 more MVP awards.

So what does it all mean? Probably not much. If Albert Pujols squeaks out the most BRI of the decade, will that make it less of a disappointment? Does Nelson Cruz having the most home runs over an arbitrary 10-year period mean that he’ll one day be enshrined in Cooperstown? Well, no. However, I hope you had fun. I know that I did.


MLB Dream Team: Active Players Bound for the Hall of Fame, Part I

Sports always allow us to ask, what if? What if a baseball lineup — complete with all nine positions and a designated hitter — was composed of all-time greats in their best seasons.

I have composed a lineup filled with the very best active players who I think will make the Hall of Fame.

These players will not be judged on their performance this year; they will be chosen based on how well they performed during their primes.

I have designated a player’s “prime” as the best seven years of their career — not necessarily consecutive — and these selections are based on the player’s likelihood to make the Hall of Fame. Some members of the team will be inducted on the first ballot, and some will take years to make it to the Hall, but ultimately I think that every player on this list has a great shot at being immortalized in Cooperstown.

This article is part one of a two-part set in which I show my Dream Team. Part two will be released tomorrow.

Metrics Explained

Wins Above Replacement, or WAR, is the most commonly used advanced metric in baseball. It is a measure of how many wins a team gained by playing a specific player instead of a replacement player, who would have a WAR of 0. If a player records 2 WAR in a season, he is considered starting material, 4 or 5 WAR is acknowledged to be All-Star value, and 8 WAR is MVP-level production.

The Jaffe WAR score system, or JAWS, is simply the average of a player’s seven-year peak WAR and career WAR. For example, if a player had 100 career WAR and 50 seven-year peak WAR, his JAWS would be 75. This metric gives us perspective on how likely it is for a player to make the Hall of Fame compared to those who played their position.

Fielding Percentage is a measure off how often a player commits an error. For example, a fielding percentage of 97% means the player committed an error on 3% of the plays he made.

Note: This list favors older players because:

  • They have more career WAR
  • They have more years from which to choose their seven-year peak WAR
  • They are closer to entering the Hall of Fame than younger players.

Batting leadoff and playing right field…

Ichiro Suzuki

59.4 career WAR / 43.6 7yr-peak WAR / 51.5 JAWS

Average HOF RF:

73.2 career WAR / 43.0 7yr-peak WAR / 58.1 JAWS

17th in JAWS out of 24 Hall of Fame Right Fielders

Accolades: MVP (2001), Rookie of the Year (2001), 10x All-Star, 10x Gold glove, 3x Silver Slugger

Ichiro was one of the easiest selections for this Hall of Fame Dream Team. He was a trendsetter — the first Asian position player to debut in the Major Leagues.

In his rookie season, Ichiro set the baseball world ablaze, winning MVP and Rookie of the Year, and leading the league in hits, stolen bases, and batting average.

Ichiro was a revelation in the big leagues, and his game was predicated on speed not power, completely opposite to the direction baseball was trending. According to FanGraphs, Ichiro occupies the first seven spots on the list of highest single-season infield hit totals.

Ichiro was the hit king. He holds the records for most hits in a season (262) and most consecutive 200-hit seasons (10). He also tied the record for most 200-hit seasons (10), and led the league in hits seven times.

Recently, Ichiro reached the 3,000 hit plateau, and if you count his hits from his time in Japan, he broke Pete Rose’s record for most hits across all of baseball’s professional leagues.

In his prime, Ichiro was one of the best players in the world. Only Albert Pujols and Alex Rodriguez accumulated more WAR than Ichiro from 2001 to 2010. On top of being one of the greatest to ever play in the outfield, Ichiro was a cultural icon, and many of the recent advances that Asian players have made are attributable to him.

Batting second and playing left field…

Mike Trout

52.0 career WAR / 52.0 7yr-peak WAR / 52.0 JAWS

Average HOF CF (out of 19):

71.2 career WAR / 44.6 7yr-peak WAR / 57.9 JAWS

14th out of 19 Hall of Fame Center Fielders

Accolades: 2x MVP (2014, 2016), Rookie of the Year (2012), 6x All-Star, 5x Silver Slugger

Trout usually plays center field, but I had to move him over to left in order to accommodate him in the lineup.

Mike Trout is hands-down the best player in baseball right now, and is surely destined for Cooperstown.

Trout has only played five full seasons, but his numbers stack up well next to other center fielders who are enshrined in the Hall. And at just 25 years old, Trout is only entering his prime, meaning that his best years are ahead of him.

Now that’s a stunning thought.

Trout also has the sixth-best seven-year peak WAR out of the 24 center fielders in Cooperstown, in only five seasons!

Here I am talking about how Trout is a generational talent, and I haven’t even mentioned the countless honors that he has collected. Trout has made the All-Star team (for which he has won MVP twice), taken home a Silver Slugger, and been either MVP winner (twice) or runner-up (three times) in every season of his career.

That level of dominance is mind-boggling and completely unprecedented.

Batting third as the designated hitter…

Miguel Cabrera

70.0 career WAR / 44.6 7yr-peak WAR / 57.3 JAWS

Average HOF 1B:

66.4 career WAR / 42.7 7yr-peak WAR / 54.6 JAWS

10th in JAWS out of 20 Hall of Fame First Basemen

Accolades: Triple Crown (2013), 2x MVP (2012, 2013), 11x All-Star, 7x Silver Slugger, World Series Champion (2003)

Miguel Cabrera, still one of the best players in baseball, is a generational talent and already a surefire Hall of Famer. The Venezuelan has been tearing up the big leagues ever since debuting in 2003, and has brought a cheerful smile and a love of the game to wherever he plays.

In the beginning of his career, Cabrera was a young star on the Florida Marlins, one of the youngest teams in baseball. He experienced success early on when the Marlins won the World Series in his rookie year. Then, after a blockbuster trade to the Detroit Tigers in 2007, he continued to amaze in the American League.

From 2011 to 2015, Cabrera was the most feared hitter in all of baseball. During that time, he won four batting titles, took home two MVPs, and racked up five All-Star selections. In 2013, Cabrera captured the Triple Crown (leading the league in batting average, home runs, and RBIs), a feat that had not been accomplished since 1967.

Cabrera already has 2,598 hits and 458 home runs as of July 22nd, so he has a good chance to join Hank Aaron, Willie Mays, and Alex Rodriguez as the fourth member of the 3,000 hit and 600 home run club. Cabrera’s near-incomparable match of hitting for both power and average have vaulted him into the conversation as one of the best hitters of all time.

Batting cleanup and playing first base…

Albert Pujols

100.1 career WAR / 61.6 7yr-peak WAR / 80.8 JAWS

Average HOF 1B:

66.4 career WAR / 42.7 7yr-peak WAR / 54.6 JAWS

2nd in JAWS out of 20 Hall of Fame First Basemen

Accolades: 3x MVP (2005, 2008, 2009), Rookie of the Year (2001), 10x All-Star, 2x Gold Glove, 6x Silver Slugger,  World Series Champion (2006, 2011)

The easiest choice on the roster, Albert Pujols should make the Hall of Fame on the first ballot. Much like Pujols’ overflowing trophy cabinet, I don’t have room enough to praise Pujols, truly one of the greatest players ever.

Pujols has faded since he signed with the Angels on a 10-year, $240-million contract in 2012, but don’t let his struggles of late affect your judgement on his case for the Hall of Fame. He trails only Lou Gehrig in career WAR among first basemen, and is one of only 21 position players to record 100 career WAR.

Pujols’ nickname “The Machine” was an apt description of his time as a Cardinal. His 162-game average stats for his 11 years in St. Louis were: .328/.420/.617 with 127 RBIs, 123 runs, and 43 home runs. Pujols finished in the top 10 of the MVP voting all 11 years, ending up in the top five in ten seasons, and winning the award three times. But Pujols isn’t just a slugging first basemen, he is a very capable defender and has won two Gold Gloves.

Pujols became the ninth member of the 600 home run club earlier this year, and next year he should join the 3,000 hit club (as of July 22nd he has 2,908 hits). Pujols leaves a legacy as one of the best ever, and he deserves to be enshrined in Cooperstown.

Batting fifth and manning the hot corner…

Adrian Beltre

91.5 career WAR / 49.7 7yr-peak WAR / 70.6 JAWS

Average HOF 3B:

67.5 career WAR / 42.8 7yr-peak WAR / 55.2 JAWS

5th in JAWS out of 13 Hall of Fame Third Basemen

Accolades: 4x All-Star, 5x Gold Glove, 4x Silver Slugger

Adrian Beltre, still chugging along at the ripe age of 38, has graced baseball with his presence for 20 seasons. From hitting home runs off one knee, to his aversion of people touching his head, Beltre is one of the true characters of the game.

Beltre is third all-time in WAR among third basemen, trailing only Mike Schmidt and Eddie Mathews. He also figures to be the next member of the 3,000 hit club, needing only 15 more hits as of July 22nd. And if he decides to come back and play next year, he has a great chance of overtaking Brooks Robinson for most games played at third base.

Those are just some of the records that Beltre is approaching, and he does not seem to be slowing down.

There is just no debate on Beltre’s Hall of Fame candidacy. Among all third basemen, he ranks in the top five in games played, hits, doubles, home runs, RBIs, and WAR.

Beltre’s legacy will be as one of the best defensive third basemen of all time, and he trails only Brooks Robinson in Defensive WAR among players who have manned the hot corner. His highlight reel of diving stabs, barehanded picks, and throws from all the way across the diamond make him one of the best ever to play third base.

Special thanks to baseball-reference.com for all of these helpful stats. I could not have written this article without them.

Thanks for reading Part I. Part II will be released at a later date and it will include spots 6-9 in the batting order as well as the starting pitcher.

To be continued…


Gary Sanchez Should Bat Second

What do Mike Trout, Josh Donaldson, Dustin Pedroia, Corey Seager and Manny Machado all have in common? Besides the numerous accolades that they share between the Rookies of the Year, the Silver Sluggers, the MVP awards and the combined 16 All-Star appearances, they all share one less obvious trait: they have more career plate appearances batting second in the lineup than anywhere else. Gone are the days of your team’s best player batting third or fourth. The new normal is now MVP-caliber players batting second. It has worked for Pedroia and the Boston Red Sox, Machado and the Baltimore Orioles, Donaldson and the Toronto Blue Jays and Seager and the Los Angeles Dodgers. Not for nothing, but those teams all made the postseason last year with large contributions from their second-hole hitters AND Trout was the AL MVP for the second time in his career on a last-place Los Angeles Angels team. And as more teams continue to adopt this trend, the New York Yankees should also look to bump up their best hitter.

In an appearance the other week on a YES Network interview, GM Brian Cashman has stated that the Yankees have kicked the tires on splitting Brett Gardner and Jacoby Ellsbury in the lineup. This makes a lot of sense when looking at their game; they both rely on their ability to get on base and set the table more so than their ability to drive in runs. Additionally, both players have slowly, but noticeably, been in decline in recent seasons, primarily due to age and injury. Gardner has been the subject of trade rumors over the past few seasons and Ellsbury has been the ire of the New York media for largely failing to live up to the seven-year, $153-million deal he signed before the 2014 season. River Ave Blues has already had a look at how the Yankees would approach this situation and they have provided a solid solution, but they almost immediately toss out the idea of Gary Sanchez batting there for one reason or another, while Sanchez is most deserving of the promotion.

Sanchez has established himself as the Yankees’ most dominant hitter after bursting on the scene last year. The Yankees, their fans, and the nation all expect Sanchez to hit in the third spot in the lineup, a prestigious position considering the history of the franchise, but moving the young slugger to second would not only better suit the team, but would also play to his strengths. Sanchez, despite the short sample size of 231 plate appearances, has proved to be a pretty good fastball hitter. Of the 294 fastballs he has seen, he has connected for a .328 AVG and .781 SLG, and nine of his 20 home runs. Why does this matter? Traditionally, number-two hitters have seen more fastballs than elsewhere in the lineup, and to further cement his commitment to the fastball, per Brooks Baseball, Sanchez had an exit velocity of 94.3 MPH against the heater (Sanchez ranked in the top 10 in overall exit velocity last year). Young players are also traditionally late to adapt to major-league breaking pitches. Can you blame them when they’re up against this or this?

Secondly, it has been proven that two-hole hitters collect more plate appearances per season than the three through nine spots. This is not new information, but the exact number of plate appearances has been up for debate for years. Beyond the Box Score might’ve ended the debate while also examining how the two hole has changed, stating that “[e]ach drop in the batting order position decreases plate appearances by around 15-20 a year,” which might explain why MVPs Trout and Donaldson have made a living there over the past few seasons. An extra 10-20 plate appearances could mean an extra home run or two over the course of the season. Baseball is a game of inches, but it’s also a game of runs.

With a lineup bereft of veteran power and more intent on utilizing the “Baby Bombers,” as they’ve been so aptly named, moving Sanchez up to second could and should give the lineup a much-needed boost if the reliance on Greg Bird and Aaron Judge should go somehow awry. Veterans Matt Holliday, Chase Headley and Starlin Castro have had good seasons and impressive resumes, but they need to return to All-Star form to carry a team of youngsters and a questionable starting rotation. No one really expects Sanchez to produce at the same rate that he did last year, but perhaps a bump up would allow him to produce at an above-average level again.


An Early Look at the AL MVP Race

[This analysis is also featured in our emerging blog www.theimperfectgame.com]

With less than one month to go, the American League MVP race is very close. While usually nothing is set on stone in early September, during the last few years the AL MVP has been a two-man race (Mike Trout with either Josh Donaldson or Miguel Cabrera). This year, however, features five remarkable candidates: Mookie Betts, David Ortiz, Jose Altuve, Mike Trout and Josh Donaldson. Yes, I expect a few other to grab a few top-five votes (e.g. Cano, Cabrera, Lindor and Machado) but I don’t anticipate the award to fall outside those five players.

Let’s look at the classic, old-school numbers first, which not only are sometimes referenced in casual conversations at local bars and pubs but also frequently (and occasionally unfortunately) followed by voters. I’ve plotted R, RBI, HR, OBP, SLG and SB as percentiles of the entire population. Let’s take a quick look.

Picture

If you like well-rounded players, probably this year you’re excited with Altuve, Trout and Betts, who dominate across the board. In an era where stolen bases keep declining, 20+ SB will get you to the 90th percentile. On the other hand, if you’re into true sluggers, then the show Ortiz has put this season should be one to remember. However, then again, these metrics paint only part of the picture — they don’t take into account when or where each event happened nor they include defense or base running on its most complete form.

Let’s take a deeper look at WAR and a quick indicator for each batting, fielding and base-running performance.


Player WAR wRC+ UZR/150 BsR
David Ortiz 4.0 164 0 -7.4
Jose Altuve 6.6 160 -0.4 0.3
Josh Donaldson 7.1 161 10.6 -0.8
Mike Trout 8.1 175 -2 8.0
Mookie Betts 6.6 138 16.4 8.0

Obviously when we move away from batting, David Ortiz loses ground — he only contributes in one aspect of the game, and while he has been outstanding in the batter’s box, likely it will not be enough for him to win. When we adjust by park and league, we realize the Trout – Betts race for the best OF is not as close as I initially thought. Trout has quietly put a(nother) great season on an awful team (again) — he’s already at 8.1 WAR and a 175 wRC+, with both easily leading the league. His defense is slightly below average at best but he compensates by running extremely well. Altuve and Donaldson have had similar seasons offensively. However, Altuve is having a down season in both defense and base-running (remarkably low on Ultimate Base Running (UBR), which measures how frequently and effectively a runner takes an extra base via running). Betts drives his value largely from his defense, where he’s settled in nicely as one of the best OF this year.

One of the metrics I tend to assess when I look at awards is how performance was spread the entire season. I want an MVP to be someone that I rely throughout the year, not only during a hot stretch. Additionally, having a big month can really uplift the numbers and build up a misleading argument in favor of someone. Let’s understand how wRC+ is split by month.

Picture

This picture to me is interesting for a couple of reasons. First, part of the argument on Betts’ candidacy is that he’s getting better, and delivering when it matters the most — in the middle of a pennant race. After a below-average March/April, Betts has been a beast since July, when Ortiz cooled off a bit. Now, then again, Mike Trout has also followed an upward-trending curve — peaking at 206 in August — and his lowest point is at 144, which is the highest of all lowest points in the sample. From my perspective, if everything else is equal, I’d rather have a Trout-esque curve than Donaldson’s one, who has the highest single-month wRC+ (213 in June) but also with the largest swing (118 difference between May and June). And then you have remarkably constant Altuve — with the narrowest gap between highest and lowest points throughout the season and at least 140 wRC+ in any given month.

Now, most of what we have shown up to now is context-neutral. An argument could be made that every single game is worth the same, regardless of whether it’s in April or July — what’s really important is to deliver in key, high-leverage situations. There is where true MVPs show their full potential to influence a team and define its fate. As they say, a home run against a non-contender team when you are losing by five runs is not as valuable as a game-winning double against our wild-card-rival’s closer in the 9th inning. I’ll admit neither OPS in high-leverage situation or Win Probability Added (WPA) is the perfect metric to evaluate this, but they provide a very good proxy to how well they have fared in tough, game-changing situations. If you are not familiar with WPA, please click here.

Picture

Again we see the usual suspect — Mike ‘King’ Trout — leading not only this graph but the MLB with his 5.66 WPA, closely followed by Josh Donaldson, and they’re the only two players from this sample to have a higher OPS in high-leverage situations than in low-leverage ones. Interestingly, Boston’s Betts and Ortiz’s OPS go down 9% and 15% respectively when the stakes are high. I definitely don’t want to say that Altuve’s 0.841 OPS in high leverage is bad, but I certainly want to recognize Donaldson’s and Trout’s clutchier performance.

Another way of looking at the MVP is to ask yourself: Where would that team be if that player wouldn’t have been part of it? While in essence it is impossible to know for sure the answer, a nice proxy is to measure what percentage of position-player WAR is that player responsible for, i.e. what percentage share does this player represent.

Player WAR Team WAR %
David Ortiz 4.0 28.7 14%
Jose Altuve 6.6 18.8 35%
Josh Donaldson 7.1 21.4 33%
Mike Trout 8.1 17 48%
Mookie Betts 6.6 28.7 23%


Well, this is another way to see Mike Trout’s leadership on the field. Almost half of the Angels’ WAR have Trout’s name attached to it, which is amazing. (For reference, the leaders in this table are Khris Davis and Marcus Semien with 122% (2.2 WAR each out of 1.6 Athletics total WAR). Now, Donaldson and Altuve have, too, a remarkable 33% and 35% of their total, but probably Betts falls short again with his 23%.

At the end, when all is said and done, it looks like numbers indicate it should go down to a Donaldson vs. Trout race, just as it was in 2015. Ortiz has had an amazing season but his base-running and defense (or lack thereof) limit his overall impact on his team. Betts is definitely an exciting, five-tool player, but his performance hasn’t been as good as Donaldson’s or as consistent as Trout’s. Additionally, Boston’s talent-loaded team reduces his value (this is the opposite of the Trout-Angels argument – how valuable can you be when your team would perform well, even if you’re not there?). His future is extremely bright though. Finally you have Altuve, who may have a legitimate case but falls (a bit) short on overall performance to Donaldson and Trout. Houston has under-performed and arguably that’s a worse outcome than Trout’s, because we knew the Angels were going to be bad, but we thought the Astros would be better.

Last year, Donaldson built his case with a magnificent August, when he posted a 1.132 OPS and Toronto got to first place in the AL East. This year it was Trout who had a torrid August, but the Angels are not in the wild card race. It surely seems to me as if we are measuring the MVP as a team award. Though I understand the rationale of having an MVP on a winning team, there is more to it. If I had a vote, and still being a few games away from the end of the season, I’d support Trout in his quest for his second MVP (as of today), but it looks like momentum and narrative are gaining traction around Donaldson — who has posted much better numbers than in his MVP season — Altuve — who brings new blood to the MVP discussion and might get an extra push if Houston makes it to the playoffs — and Betts — who is clearly the face of Boston’s extremely talented young generation. They, though, despite great Septembers, will post worse numbers than Trout. Yes, the Angels are a bad team — but to what extend is that Trout’s fault? What else could he have done? When did ‘valuable’ translate into ‘winning by himself beyond reasonable expectations’? When did we change this award to ‘best player on the best team’? In 2012 it was Cabrera’s Triple Crown and in 2015 it was Donaldson’s ‘ability’ to get Toronto to the postseason for the first time in many years. In 2016, Trout has been comprehensively better, avoided any deep slumps during the season, and performed very well under pressure and shown that you can put counting stats up on a bad team. We are running out of excuses this year.


$500 Million Man

A few days ago, Joe Posnanski wrote about the possibility of Bryce Harper getting the first $500m contract ever. I agree with him on how both amazing and ridiculous it would have sounded 2 or 3 years ago. I also agree it is possible, almost likely, to happen. I might not be a Bryce Harper fan but he is so young that is he is on track to accomplish big things. He is not Mike ‘King’ Trout but he is very good.

Harper’s current contract runs through the end of 2018, which is when I assume he would get the big fat check. The Nationals will try to extend his contract before he is a free agent, just like the Marlins and the Angels did with Giancarlo Stanton and Mike Trout. However, in this post we will assume Harper will not pursue that path, making him a highly-coveted free agent in 2018. I will also exclude the possibility of 9- or 10-year contracts, which would make the mark easily achievable. Let’s run the numbers for Harper’s future:

Year Open market ($m/WAR) Age WAR Projected Value ($m) Cumulative value ($m)
2016 8.4 23 6.8 54.4
2017 8.8 24 7.1 59.2
2018 9.3 25 7.3 64.4
2019 9.7 26 7.6 69.9 73.4
2020 10.2 27 7.8 75.8 153.1
2021 10.7 28 7.8 79.6 236.7
2022 11.3 29 7.8 83.6 324.5
2023 11.8 30 7.8 87.8 416.7
2024 12.4 31 7.3 86.3 507.3
2025 13.0 32 6.8 84.4 595.9
2026 13.7 33 6.3 82.1 682.1
2027 14.4 34 5.8 79.4 765.4

We have here Harper’s projected value profile. As usual, I am using FanGraphs’ model, which has a player’s aging curve that follows +0.25 WAR/year (Age 18-27), 0 WAR/year (Age 28-30),-0.5 WAR/year (Age 31-37),-0.75 WAR/year (38 and older). It also assumes that open-market WAR sits at $8.4m in 2016 and grows at 5% per year. The starting point is Steamer’s 2016 projection: 6.8 WAR.

Three years from now, in the winter of 2018, he will be negotiating his new contract that includes his theoretical peak 27-30 years at ~7.8 WAR/year. The truth is that a 7-year / $500m+ contract would only be likely if by 2018 he can position himself as a player who consistently accounts for almost 8 wins per year. That is the only reason a team would be eager to invest half a billion dollars in a single player, marketing-related reasons aside.

Now, the question comes down to what he needs to do by 2018 in order to cement that positioning. The model needs him to be a 21.2-win player during the next 3 seasons. While Harper might have taken a significant step up performance-wise, we need to remind ourselves that before 2015 he was “just” a ~4-5 WAR guy. In order to meet the model’s expectations he needs to double those numbers, and remain at that level  for 3 years in a row (i.e.: Between 8-9 WAR for that 3-year period). If he meets those marks, Harper would have accrued 40 WAR during his career by 2018. While that is entirely possible, it is not easy. This is the list of highest cumulative WAR by age-25:

Player Cumulative WAR by age 25
Ty Cobb 56.3
Mickey Mantle 52.5
Jimmie Foxx 47.3
Rogers Hornsby 46.9
Mel Ott 45.9
Alex Rodriguez 42.8
Eddie Mathews 39.4
Arky Vaughan 39.4
Tris Speaker 38.7
Mike Trout 38.5

So, two conclusions can be quickly drawn. First, Mike Trout is not human. He is only 24 years old and is already on this list with guys like Cobb, Mantle, Foxx and company. Second, no, it is not an easy task for Harper. I know that you are thinking that he just put up a 9.5 WAR season, why can’t he do it again? Another season like that and he should get to his target easily but, truth be told, those Trout-esque seasons are unlikely to happen. I say this for three main reasons. First, Harper is not an elite defender and has gotten worse every year. For the last 3 seasons (2013-2015), he ranks 37th in UZR/150 out of 60 qualified OF. In 2015, he compiled -8.5 on Defense (Def) metric, per FanGraphs, which is position-adjusted, in his case for RF. Out of the 69 individual seasons with 8 or higher WAR from players 25 or younger, only 5 players (Hank Aaron, Ted Williams, Stan Musial, Mike Trout (!) and Bryce Harper) had -8 or worse Defense. No, it is not impossible but it is hard.

Second, he is an above-average baserunner, but not an awesome one. Lastly, Harper has not exhibited good health over his career. He has had injuries in 2 out of 4 seasons, which may not seem many but in 2013 and 2014 he only played 67% of Nationals games. Predicting health is tough, especially because there are unforeseeable events. You cannot control a hit by pitch at your wrists or a concussion sliding in second base but your health track record is your best bet on your future injury report. Those three things are vital to get to 21.2 WAR during the next 3 years. Harper needs those factors to come in play in order to get to the 7yr/$500m contract. Harper’s advantage is his age – just like Jason Heyward this offseason.

We have implicitly talked about Mike Trout. He is arguably the best player in baseball right now and was on track to smash the contract record, until he negotiated a 6yr/$144.5m contract extension. That will keep him locked up from ages 24 to 29 at LAA. Now, the question is what type of contract will he command in 2020? Mind you, it is hard enough to try to predict what a Free Agent might get in 2016, but still we took a stab a it.

Year Open market ($m/WAR) Age WAR Projected Value ($m) Cumulative value ($m)
2016 8.4 24 9.2 73.6
2017 8.8 25 9.5 79.4
2018 9.3 26 9.7 85.6
2019 9.7 27 10.0 92.1
2020 10.2 28 10.0 96.8
2021 10.7 29 10.0 101.6 101.6
2022 11.3 30 10.0 106.7 208.3
2023 11.8 31 9.5 106.4 314.6
2024 12.4 32 9.0 105.8 420.4
2025 13.0 33 8.5 104.9 525.3
2026 13.7 34 8.0 103.6 628.9
2027 14.4 35 7.5 101.9 730.8

Here is Trout’s projection. Again, 2016 WAR is courtesy of Steamer. We might think the aging curve slightly benefits Trout because it forecasts a ~10% increase in WAR, and he has not posted those 10 WAR seasons since 2 years ago. Then again, let’s toy with the idea. The $500m contract here seems more feasible for three reasons. First, in MLB, you get paid for what you did and not for what you will do.  By 2020, Trout could have ~85 WAR under his belt –he would be 28 years old. That is just ridiculous and will not happen, right? No one, ever, has done that by age 28 (Ty Cobb is the leader with 78.6 WAR). But what if he does? What if Trout is around the 70 WAR mark with 8 or 9 great seasons on his resume? Second, he needs to do what he has already done e.g. Trout has posted two +10 WAR already. The other two seasons were 8 and 9. This guy runs well and plays above-average defense. Trout does it all and will not stop. Third, unlike Harper, Trout has been very much healthy. During the 2013-2015 period, he played 157, 157 and 159 games, respectively. Again, injuries are hard to predict but we will take what he has shown so far as a given, which is good health. Fourth, fair to say, time value of money. A dollar today is not worth the same as a dollar tomorrow. Therefore, getting a $500m contract in 2020 should be easier than in 2018.

In summary, I think Harper can do it but I would not bet on it. From my perspective this is a long shot. If you ask me today on who is more likely to become baseball’s first 500-million-dollar man, I would put my money on Mike Trout to beat Bryce Harper on this as well.

Note: This analysis is also featured in our emerging blog www.theimperfectgame.com


Trying to Figure Out What the Angels Are Doing

The Angels are an odd team. They are perennially competing for a spot in the playoffs and in 2014 they had the best record in the AL, but each year it seems that they are out-performing their talent.

The simplest explanation is that the team is buoyed by Mike Trout, which is true. A team with the best player in baseball, and always one of the highest payrolls in baseball, should not be lagging this much. The Angels should be more than a perennial playoff contender. They should be World Series contenders. So, if there ever was a time for Arte Moreno to hand out his money, it’s this off-season which provides the Halos with everything they need to resolve the biggest issues the team faces.

They currently have $130,278,770 in payroll obligations, excluding pre-arbitration and arbitration-eligible players. The Angels carried payrolls of $168,299,326 and $151,298,162 in 2014 and 2015, respectively. MLB Trade Rumors projects $20,100,000 in arbitration salaries for six players, which brings the Angels 2016 payroll for 14 players to $150,278,770. If you leave three spots open on the 40-man roster, giving the Angels three players to add through free agency, and estimate that the remaining 23 players will cost the Angels $500,000 each, or $11,500,000 total, it would bring the payroll to a best-case scenario of $161,728,770.

Arte Moreno has said he would cross the luxury tax threshold, but that seems more like PR than an actual possibility, so I’ll cap the potential payroll at $189,000,000. That leaves the Angels with $27,271,230 of money to spend before surpassing the luxury tax threshold.

The Angels could use an upgrade to their DH/1B depth and a player like Mike Napoli would fit well with them, but that’s not a pressing need. The bullpen is also an area that could improve, however it’s not really a dire situation.

The most glaring holes on the Angels roster are the third base position and a corner outfield spot. Technically, it’s left field, but Kole Calhoun can play in any corner, so someone who plays either right or left field would work. For that matter, they would be fine with a center fielder because Trout could probably flex out of center field if needed.

A trade, at least a meaningful one, is out of the question because the Angels gave up their only valuable assets in the Andrelton Simmons deal. That may have been a pretty big mistake depending on how much money they plan to spend this offseason.

There does not seem to be a better fit for the Angels than Daniel Murphy. He could be the solution they have been seeking in their search for a left handed bat to slide in the middle of the order. Murphy’s defensive ability, or lack thereof, is somewhat overblown. Metrics tend to be fairly neutral on him, and some of his misadventures at second base overshadow the fact that he’s a competent third baseman. That is where he would best serve the Angels. FanGraphs’ contract crowdsource pegs Murphy for a contract with a $12,000,000 average annual value. I think Murphy could end up getting more than that, but let’s roll with that. The Angels are now down to $15.3 million.

That brings us to the outfield. Jason Heyward, Yoenis Cespedes, and Justin Upton would all fit in Anaheim. However, the Angels could only afford one of them if they backload the contract, which is possible, but set that possibility aside for the moment.

The other options would be Denard Span, Gerardo Parra, Nori Aoki, and Rajai Davis.

Span would seem to be an unnecessary injury risk for a team that would need him on the field to compete for a World Series and does not have a great backup option for the position. However, a healthy Span is a good fit with the Angels. He would add some much needed speed to that lineup and would probably fit in their budget, costing around $12,000,000 on a three-year contract.

Alternatively, a platoon of Nori Aoki or Gerardo Parra with Rajai Davis would probably cost the team around $10,000,000 combined and would provide competent left field options.

The issue with Span or an Aoki or Parra/Davis platoon is that it just puts the Angels back where they were: in the mix. It doesn’t distinguish them, and it doesn’t make them World Series contenders. It’s not improbable that a team with Murphy and one of the lesser outfield options could make a World Series run, it’s just also not improbable they would be sitting at home in October.

And that’s my potential issue with the Andrelton Simmons trade.

There’s been some discussion on the best way to use minor league resources in light of the Red Sox’s trade for Craig Kimbrel. However, I think it’s much more interesting to examine the issue by looking at the Angels and what they gave up in their trade for Andrelton Simmons.

Sean Newcomb was one, and maybe the only, valuable asset that the Angels possessed that they could move in an attempt to improve the team. They undoubtedly did that by getting Andrelton Simmons, but Simmons didn’t solve any immediate issues. He’s an improvement over Erick Aybar, but Erick Aybar really wasn’t an issue. And the trade begs the question, are the Angels looking past this year? The main benefit of Simmons is what he brings the team in 2017 and 2018, being a very good shortstop under a reasonable contract.

I don’t know if Billy Eppler shopped Newcomb around for a player like Carlos Gonzalez or any other available outfielders. Maybe Newcomb wasn’t enough. And Jay Bruce seems like a good fit, but Jay Bruce is a bet; he’s one of those players whose reputation of past performance seems to outpace his recent performance (Bruce had -.9 WAR in 2014 and .1 in 2015. Steamer projects him to have a .6 WAR in 2016).

Maybe Billy Eppler has all the money he needs to add Heyward, Cespedes, or Upton, or maybe he’s convinced he has the ability to add one of them on a back-loaded contract. Jeff Weaver and C.J. Wilson are off the payroll next year and all payroll obligations owed to Josh Hamilton will be off the books after 2017, so the financial situation looks better in the future.

And there are a lot of alternatives here. The Angels could band-aid third base by bringing back David Freese, or adding Juan Uribe. That may leave them with enough money to bring in one of the marquee free agents, but it still leaves them short of being a baseball powerhouse. It just makes them another good team with a shot at making the playoffs.

All of this is to say that the Angels are an interesting team. Mike Trout keeps them on the brink of being very good each year, but if Arte Moreno is willing to spend like the Dodgers and Yankees the Angels could be great. If they added Daniel Murphy and Jason Heyward they would have to be considered one of the best teams in the league. However, if they added Simmons at the cost of only being able to address either their third base or corner outfield issue instead of addressing both, then it seems like a misuse of their only minor league asset, and of Mike Trout’s greatness.


Hit Batters as Collateral Damage of Rising Strikeout Rates

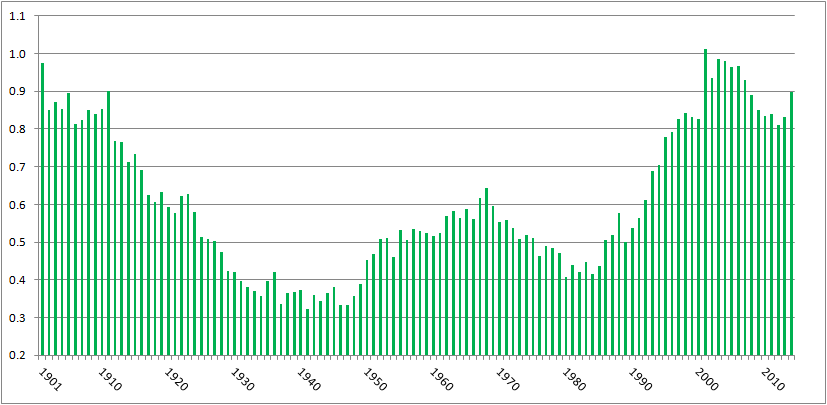
In the past, I’ve written about batters being hit by pitches–specifically, how the rate of hit batters is near all-time highs yet it hasn’t generated much, if any, outcry. Here’s a chart of hit batters per game, from 1901 (the start of the two-league era) to 2014:

HBP per game, 2001-2014

There were 0.68 hit batters per game in 2014, the eleventh-highest total over 115 years of two-league play. The top ten years, in order, have a 21st century slant: 2001, 2004, 2003, 2006, 1901, 2005, 2007, 2002, 2008, 1911.

Or, pretty much the same chart, here’s hit batters per 100 plate appearances:

HBP per 100 PA

There were 0.898 batters hit per 100 plate appearances in 2014, the tenth highest amount in the two-league era. The ten top years are, in order, 2001, 2003, 2004, 1901, 2006, 2005, 2002, 2007, 1911, and 2014.

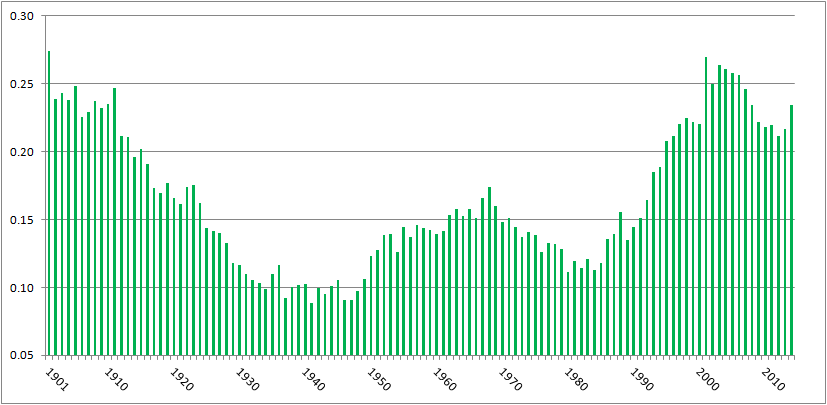
Commenter jaysfan suggested that the modern emphasis on going deep into counts has changed the number of pitches thrown per game, so perhaps hit batters per pitch haven’t changed much. It turns out the pattern still holds. Here’s a graph of hit by pitch per 100 pitches, using actual pitch counts from FanGraphs for 2002 to present, and Tom Tango’s formula of Pitches = 3.3 x plate appearances + 1.5 x strikeouts + 2.2 x walks for the preceding years:

HBP per 100 pitches

With 0.234 hit batters per 100 pitches, 2014 ranks 16th all time, behind 1901-1905, 1908, 1910, 1911, and every year from 2001 to 2007. Again, a pronounced millennial bias. (Source for all the above graphs: Baseball Reference and FanGraphs)

It’s clear, then, that we’re seeing batters getting hit at the highest rate in a century. I tried to figure out why, and came up dry. Left-handed batters, who face a wider strike zone than righties, aren’t leaning across the plate and thereby getting hit at a proportionately higher rate. HBPs are not inversely correlated to power, with pitchers more willing to pitch inside now to hitters who less frequently pull inside pitches down the line and over the fence. College graduates are slightly more likely to get hit by pitches than other hitters, but not enough to explain the change. Batters setting up deeper in the batter’s box, as measured by catcher’s interference calls, isn’t correlated to HBPs.

However, commenter Peter Jensen noted, “I don’t think there is any question that pitchers throw more to the edges of the strike zone when they are ahead in the count. This could be confirmed with a pretty simple Pitch Fx study. And if they pitch to the edge more they are also going to miss inside more (and outside more) so this could partially or even wholly account for why there are more HBPs in pitcher counts.”

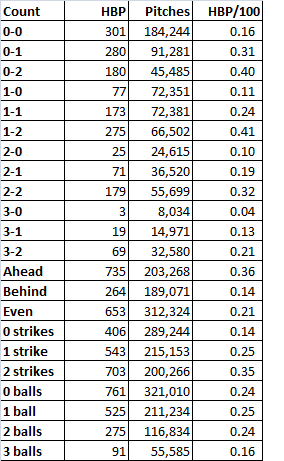
I did the PITCHf/x study Peter suggested. Using Baseball Savant data, I looked at hit by pitch by count, and as Peter found when he studied the data from 1997 and 2013, HBPs occur more when pitchers are ahead on the count. Here are the data from 2014:

2014 HBP

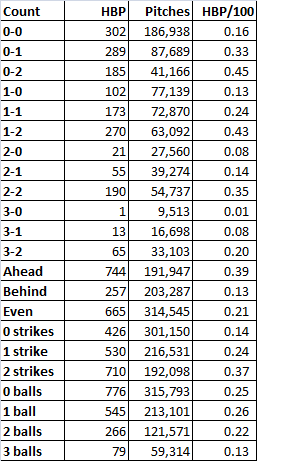
When the pitcher was ahead on the count, the batter was nearly three times as likely to get hit as when the batter was ahead. The most common counts for hit batters: 1-2, 0-2, and 2-2, and 0-1, all counts that encouraged pitchers to try to get batters to chase pitches on the border of the strike zone. Is this trend consistent? Baseball Savant’s data go back only to 2008, but using that season’s data, yes, the trend’s unchanged:

2008 HBP

Same thing. Batters are three times more likely to get hit when the pitcher’s ahead on the count, and the three most common HBP counts are two strikes with zero, one, or two balls, followed by 0-1.

So why the increase in hit batters? It appears that, as Peter implied, it’s because of the increase in strikeouts. Every three strike count requires a two strike count, obviously. In 2008, 22% of at bats went to 0-2 counts, 34% went to 1-2, and 29% went to 2-2. In 2014, those percentages had risen to 25%, 36%, and 30%, respectively, in line with the increase in strikeouts from 17.5% of plate appearances to 20.4%. The route to three strikes, which is being traveled more frequently, includes the four counts most likely to result in a hit batter. That’s why we’re seeing batters hit by pitches at rates not seen since before the first World War.

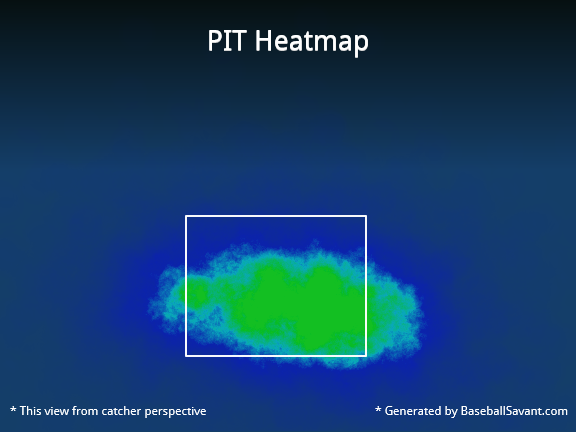
Here’s a graphical representation. In 2014, the Pirates led the majors in hit batters, handily, with 88. Here’s where Pirates pitchers threw on the hitters’ counts of 1-0. 2-0, 3-0, and 3-1:

Those greenish-yellow areas in the middle of the zone indicate that when the pitchers fell behind, they tended to locate their pitches in the strike zone. By contrast, check out the location for pitches thrown on 0-1, 0-2, 1-2, and 2-2 counts, when the pitcher could waste a pitch trying to get the batter to chase it:

That’s a much less concentrated blob, with a higher percentage of pitches outside the strike zone, where the batter can get hit.

As a final check, I ran a correlation between strikeouts per plate appearance and hit batters per plate appearance post-World War II. The correlation coefficient’s 0.82. That’s pretty high, suggesting a link between strikeouts and batters getting hit. Granted, correlation is not causation. But given that there’s an empirical link–to get to three strikes, you have to get to two, and batters with two strikes are at the highest risk of getting hit by a pitch–it’s enough to make me believe that while there are a lot of reasons more batters are getting hit by pitches, a major explanation is that hit batters are a consequence of rising strikeout rates.

CODA: If there were a day last season that I thought might’ve turned to tide on batters getting hit by pitch, it was Thursday, September 11. That day, there were 15 HBPs in 11 games. That doesn’t include the horrific fastball to the face that ended Giancarlo Stanton’s season; that pitch was a strike. A lot of stars got hit: Stanton, Mike Trout (twice), Yoenis Cespedes, Carlos Gomez, Jayson Werth. Tampa Bay’s Brad Boxberger hit Derek Jeter in the elbow. Had that pitch ended Jeter’s farewell tour, I really think it would’ve created an issue of rising HBP rates. Fortunately for Jeter and purveyors of Jeter memorabilia, it didn’t. But taking the 15 hit batters together, plus Stanton, and excluding two obvious retaliation jobs (Anthony DeSclafani hitting Gomez after Stanton got hit, Joe Smith hitting Tomas Telis after Trout got hit a second time), the fourteen hit batsmen occurred on six 0-1 counts (including Stanton and Jeter), three 1-2 counts, two 1-1 counts, and one count each of 0-0, 2-1, and 2-2. There was only one HBP with the batter ahead on the count, and ten occurred on the four counts identified here as the most dangerous for batters.