Archive for Kris Bryant

The Problem With the Shift

The concept of “the shift” has become more widely used throughout major-league baseball. While some teams shift more than most, others are shifted against more than most. The Shift Era is still relatively new as teams dive deeper and deeper into the analytical realm to increase winning percentage. However, is using the shift actually effective?

I believe that there are certainly situations where the shift should be utilized. Players such as David Ortiz, Albert Pujols, Brian McCann, etc. generally are the style of players to shift against. Older players generally rely more on pulling the ball because they are able to generate more power. These styles of pull-only hitters are usually prime targets for shifting against. My question is, why haven’t these players adapted their swing against the shift?

When learning swing mechanics, you’re taught to square up the baseball and drive the ball where it’s pitched. When shifting, pitchers are forced to make very selective pitches to avoid batters driving the ball the other way through the shift. This is hard for pitchers because it takes away some of their effectiveness. Hitters are beginning to find ways to beat the shift and steal easy hits. If a batter is in a shift situation, they can essentially eliminate pitches towards the outside half of the plate. Knowing the pitcher’s pitch arsenal, the batter can then be selective in his approach. Depending on the count, the batter can determine the next pitch, whether it’s offspeed or a fastball. Obviously a tailing fastball in on the hands is hard not to roll over into the shift, but that’s just good pitching.

Batters are finally beginning to grasp that they can beat the shift by simply putting down a bunt down the line. Or, they can create longer bat lag from their hands letting the ball travel deeper in the zone and taking the ball to the opposite field. The best hitters in baseball are those who can hit to all areas of the field. Charlie Blackmon was shifted against 121 times this year; he hit .412 against the shift. Why in the world would teams shift against him 121 times? Kris Bryant was shifted against 210 times; he hit .364. Players like this who are able to adapt their swing progressions at the plate should not be shifted against this often. Teams are simply giving them easy hits, which lead to runs. The whole point of the shift is to avoid baserunners, right?

Again, there are some batters against whom shifting works. Brian McCann was shifted against 248 times and still hit .243 against the shift, which is still pretty good considering it’s towards the bottom of the league. Lucas Duda was shifted against 241 times, hitting .243; still not terrible. Again, there are situations you can get away with shifting. The only time teams should shift should be with no runners on, strict pull hitters, and with a pitcher who’s comfortable with pitching inside.

When teams shift with runners on, I believe it’s a terrible strategy. It’s considerably difficult turning a routine double play with players out of their positions. Also, it’s difficult to catch runners stealing when you have a third baseman trying to find the bag and make the tag. Players like Dustin Pedroia have taken advantage of teams using the shift with runners on to take the extra base with the third baseman out of position. Players are beginning to find holes in the shift and are taking advantage, leading to runs.

When shifting, I believe the best option is to leave the shortstop between 2nd and 3rd, the second baseman shaded up the middle towards the bag, and the third baseman moving into right field between 1st and 2nd. With the third baseman in this position, he can create the same angle to 1st as when he’s at 3rd. This way players are in more comfortable standard positions, keeping the double play a more viable option. Shifting works in certain situations, but teams need to be more careful as hitters begin to adapt their approaches and steal easy hits, using the shift against the enemy.


The Bad Aaron Judge Comps

Aaron Judge is good.  Some might say he is great.  The front-runner for AL Rookie of the Year and MVP is the face of MLB for 2017, but the face of MLB for the future?  Unfortunately, maybe not.

It’s hard to find something negative to say about the New York Yankees right fielder, but in order to play devil’s advocate and not get our hopes up too high about Aaron Judge, just in the event that he has a down season, I was able to find some rather unflattering comps for the slugger.

First, there’s his minor-league career.  Aaron Judge was a pretty good prospect ranking first in the Yankees’ system in 2015 and 17th in baseball according to MLB Pipeline.  However, just because a prospect is ranked highly does not mean they are without flaws.  Judge would strike out in at least 21 percent of his plate appearances in all levels in the minor leagues.  This article from 2016 even identified Judge’s proficiency to strikeout:  

Judge’s Triple-A debut at the end of 2015 did not go well. He slashed .224/.308/.373, well below both his career levels and expectations. More alarming, he struck out a career high 28.5-percent of the time (74 times in 260 plate appearances). [The 2016 season] has been more of the same. His batting average is a bit deceiving sitting at .284 (heading into this weekend), considering he currently has a nice .354 BABIP compared to last seasons .289. His plate discipline is troubling.

Perhaps the lofty expectations of Judge have him pressing. You simply can’t overlook the fact that his strikeout rate is nearly identical to the small sample size of last season’s Triple-A numbers (27.2-percent). It has to be at least a slight bit worrisome that this is a trend and not a slump. His walk right is dropping daily to a new career low (6.8-percent or eight walks in 103 plate appearances).

The article seems to point to his plate discipline as his main flaw — as other evaluators have — but is overall positive with his prospect status.  But his strikeout tendency should not be overlooked.  He has failed to improve on that statistic in his short major-league career, where he has struck out in 32 percent of his plate appearances between his call-up in 2016 and now.  However, because he also takes his walks, his walk percentage is rather high, which puts him in exclusive company.

Since 2000, there have only been four players with at least 300 plate appearances who have struck out in over 29 percent of their plate appearances and walked in at least 16 percent of them: Jack Cust (2007, 2008, 2010, 2011), Ryan Howard (2007), Adam Dunn (2012), and Aaron Judge (2017).  All of these seasons resulted in wRC+ well above 100, which means that they were productive players; however, these player were known to be the embodiment of the “three-true-outcome” hitters.  Dunn had five consecutive seasons of 40 or more home runs, but also led the league in strikeouts four times; Cust led the league in walks once and strikeouts three times; and Howard led the league in home runs twice and strikeouts twice.  Admittedly, these comps are not encouraging.  Although these players were not horrible in the simplest definition, their careers were short-lived and their production sharply declined.  For Cust and Dunn, it forced an early retirement, and Howard a well-publicized and sad end to an illustrious career.

But it’s not just Aaron Judge’s strikeout and walk percentage — it’s also his raw strikeout numbers.  Judge is on pace to strike out over 200 times this season.  While it’s already been established that he is strikeout-prone, it does not serve him justice that the 200-strikeout threshold is upon him.  No player who has struck out 200 or more times in a season has had a very high average.  As the legendary Pete Rose noted, the highest single-season average for a player with 200 or more strikeouts was .262 (Chris Davis holds that honor).  The short list of 200 single-season strikeout players is a whopping five players long: Mark Reynolds, Adam Dunn, Chris Davis, Chris Carter, and Drew Stubbs.  Kris Bryant had 199 in his rookie season (he was called up late to the bigs due to service-time considerations, so it’s likely that he would have joined this club), and Ryan Howard had 199 twice and Jack Cust had 197 once.  Dunn, Howard, and Cust again…

I love Aaron Judge, and I love 500-plus foot home runs, but we also have to be realistic and rational in our love and praise for the slugger.  The worst thing that the New York sports world can do is rattle this kid if, and when, he goes from being an All-Star to the 25th man on a roster.  There is nothing I want to see more, as a Yankees fan and a baseball fan, than Judge succeed; it’s good for the sport.  But I also don’t want to get my hopes up too high, because nothing stings more than a player of his caliber going down the path of Adam Dunn, Jack Cust, or Ryan Howard.


What About Batted Ball Spin?

Recently, for my job, I got to mess around with Statcast data for fly balls. I have a good job. As part of the task I was working on, I attempted to calculate the maximum heights and travel distances of fly balls using my extensive ninth-grade physics knowledge. Now, I was excellent at ninth-grade physics, especially kinematics, but my estimates, compared to the official Statcast numbers, were terrible. Figuring the discrepancies must be due to air resistance, I did my best to remember AP physics (with the help of NASA) and adjusted my calculations for drag. The results improved, but were still way off. There are many additional factors that affect the flight of a fly ball such as wind, air temperature and altitude, but I think the biggest factor causing the inaccuracy of my estimates is batted-ball spin. (If you disagree, let me know in the comments.) Exit velocity and launch angle get all the attention when discussing batted-ball metrics, but the data I was looking at suggested that batted-ball spin merits attention too. Are there batters who are consistently better at spinning the ball than others, and if so, is this a valuable skill?

We already know that balls hit with top-spin sink faster than normal while balls hit with back-spin stay in the air longer. It’s unclear, though, whether it’s better for the batter to hit the ball with more or less spin, and whether top-spin or back-spin is more beneficial. Back-spin would seem to be better if you are a home-run hitter while top-spin might be more beneficial if you are a line-drive hitter.

As far as I know, Statcast doesn’t measure batted-ball spin, and if it does, it’s not available on Baseball Savant. So to act as a proxy for spin, I calculated the estimated travel distance (adjusted for air resistance) from its launch angle and exit velocity for every line drive, fly ball and pop up hit in 2016 and subtracted this number from the distance estimated by Statcast. The bigger the deviation between these two numbers, the faster the ball was spinning, theoretically. Balls with positive deviations (actual distance > estimated distance) must have been hit with back-spin and balls with negative deviations (actual distance < estimated distance) must have been hit with top-spin.

The following table shows the 20 hitters (min. 50 fly balls hit) who gained the most distance on average in 2016 due to back-spin:

Batter Name Number of batted balls Avg Statcast Distance (ft) Avg Estimated Distance (ft) Avg Deviation (ft)
Travis Jankowski 87 254 235 19
DJ LeMahieu 213 282 264 18
Carlos Gonzalez 226 293 276 17
Daniel Descalso 102 285 270 14
Max Kepler 150 285 271 14
Billy Burns 108 234 221 13
Rob Refsnyder 57 269 257 12
Jarrod Dyson 98 243 232 11
Martin Prado 256 262 251 11
Ketel Marte 154 250 239 11
Justin Morneau 73 278 268 11
Gary Sanchez 66 323 312 11
Tyler Saladino 107 270 260 10
Phil Gosselin 77 264 253 10
Jose Peraza 107 257 248 10
Mookie Betts 311 279 270 9
Melky Cabrera 280 271 261 9
Ichiro Suzuki 137 251 242 9
Omar Infante 68 269 261 9

With a few exceptions, these are not home-run hitters. This group of 20 players averaged 8.25 home runs in 2016. The players who are getting the most added distance on their fly balls are not the ones who need it most. (Note: four players on this list and three of the top four players played their home games at Coors Field. Did you forget that Daniel Descalso played for the Rockies last year? Me too.)

What about the other end of the spectrum? The following are the 20 players who lost the most distance on average in 2016 due to top-spin:

Batter Name Number of batted balls Avg Statcast Distance (ft) Avg Estimated Distance (ft) Avg Deviation (ft)
Colby Rasmus 136 285 306 -21
Tommy La Stella 72 273 294 -21
Brian McCann 195 273 294 -22
Todd Frazier 248 276 297 -22
Jorge Soler 88 278 300 -22
Brian Dozier 263 287 309 -22
Curtis Granderson 238 284 306 -22
Franklin Gutierrez 76 304 327 -23
James McCann 131 277 300 -23
Miguel Sano 158 301 324 -23
Khris Davis 213 303 326 -23
Freddie Freeman 269 289 312 -23
Mike Napoli 205 290 315 -25
Chris Davis 207 304 330 -26
Tyler Collins 54 270 296 -26
Ryan Howard 129 306 334 -28
Kris Bryant 284 281 309 -28
Jarrod Saltalamacchia 96 290 321 -31
Mike Zunino 63 295 327 -33
Ryan Schimpf 122 298 331 -33

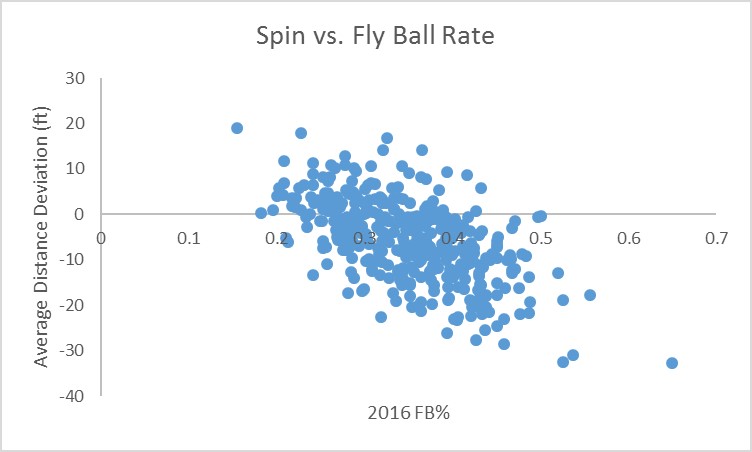
Kris Bryant, Miguel Sano, Ryan Schimpf: this list is full of extreme fly-ball hitters with an average of 24 home runs last year. The scatter plot below with a correlation of -0.58 shows the relationship between batting spin and fly-ball percentage for all players in 2016.

Mountain View

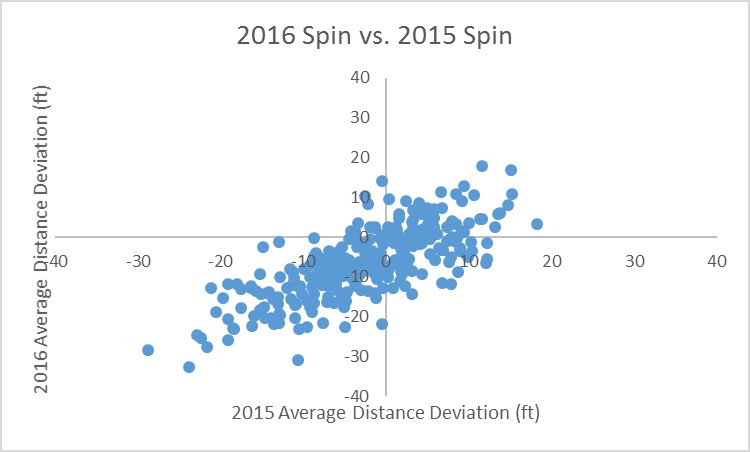
And this isn’t just a one-year phenomenon. I was relieved to find out that the correlation between 2016 average distance deviations and 2015 average distance deviations is 0.75. Players who hit balls with a lot of spin in 2015 overwhelmingly did so again in 2016. Again, the plot below shows the strong relationship.

Mountain View

Mechanically, this is not such a surprising result. Players with a more dramatic uppercut swing (like a tennis swing) will impart more top spin onto the ball while the opposite should be true for players with a more level swing.

It remains to be seen whether this knowledge is useful in any way or if it falls more into the “interesting but mostly irrelevant” category of FanGraphs articles. There is essentially no relationship between a player’s average distance deviation and his wRC+ (correlation = -0.13), so we cannot say that spinning the ball more or in either direction leads to better results. And I imagine it is difficult to alter one’s swing to decrease top-spin while still trying to hit fly balls. At best, maybe this is a cautionary tale for players who want to be more hip and trendy and hit more fly balls like James McCann (FB% = 0.41), but don’t have the raw power to absorb a loss of 28 feet per fly ball (HR = 12, wRC+ = 66).

Let me know what you think in the comments.


Kris Bryant Continues to Hit

Ever since he was taken with the second pick in the 2013 draft, the spotlight has continually followed Kris Bryant. After mashing his way through the minors in less than two years, Bryant had a spectacular rookie season with a slash line of .275/.369/.488 with 26 homers and a 136 wRC+. Deservedly, he was rewarded with the NL Rookie of the Year award. Although he did strike out over 30 percent of the time, he showed great plate discipline along with immense power. His 6.5 WAR ranked 10th among major league hitters. However, this year he has taken his production a step further.

With his league-leading 25 home runs to go along with his slash line of .278/.370/.578, one major change sticks out. Although his average and on-base percentage remain around the same as his 2015 totals, his slugging percentage has taken a huge jump. Halfway through the season, he is one home run shy of last year’s total and around half of his hits have gone for extra bases (44 out of 87). He’s also cut down on his strikeouts while making even more hard contact than he did last year — shown by his 42% hard-hit rate which will allow him to continue to tap into his power.

One noticeable change sticks out in his batted-ball profile. Although his ground-ball, line-drive, and fly-ball rates remain relatively constant, Bryant has pulled the ball more in his second big-league season. This has caused more of his fly balls to leave the park. Taking a look at his 2016 home-run spray chart, you can see that all of his home runs have been pulled.

bryant-2016

Source: FanGraphs
Next take a look at his 2015 home-run spray chart.

bryant-2015

Source: FanGraphs
Most of his home runs have been in the same general area with the exception of a few opposite-field home runs to right. Since he has been pulling the ball with more authority in 2016, the balls that he pulls in this sweet spot to left will allow him to continue to leave the yard at a ridiculous rate. With his picturesque swing to go along with his strong hands and 6-foot-5, 230-pound frame, swings like this

Kris Bryant Homer

…will continue to be common for Cubs fans to see from Kris Bryant.

However, it would be foolish to simply call Bryant a home-run hitter when in fact what makes him so special is his all-around hitting ability to go with this insane power. He walks, hits the ball hard, and his only flaw is his propensity to strike out — and even that he has improved upon this year. A two-time All Star already with 4.3 WAR this season, he ranks fourth among major-league hitters and first among NL hitters in WAR while also possessing a 149 wRC+. At this point, if the NL MVP is going to go to a player not named Clayton Kershaw, Kris Bryant deserves to be the one holding up the trophy. But the trophy most important to him is the one won at the end of October. With the Cubs holding a comfortable lead atop the NL Central, Bryant looks destined to lead them on a deep playoff run with the hope of finally shattering their 108-year-old curse.


What Can We Expect From Kris Bryant Next Year?

We’ve come to the end of the 2015 regular season and it’s time to start looking towards the playoffs. As with every year there have been surprises and disappointments. One of the most anticipated events of each season is the debut of rookies and how they will perform throughout the year. Big things were expected from Kris Bryant this year and he definitely did not disappoint. Originally drafted by the Blue Jays in 2010 in the 18th round (546th overall), he was committed to the University of San Diego and the Jays didn’t offer enough to sway him. In 2013, the Cubs drafted him 2nd overall and he did nothing but climb the ranks until he made his MLB debut on April 17, 2015. His first game didn’t go as well as he hoped, going 0-4 with 3 K’s, but debuts mean nothing except for a little extra media hoopla. He cruised the rest of the way through the season on his way to one of the most impressive rookie seasons in recent memory, posting the 3rd highest WAR of any rookie since 2001. Only Mike Trout (10.3 WAR in 2012) and Albert Pujols (7.2 WAR in 2001) posted higher better WARs in their rookie campaigns.

I was looking over Bryant’s stats and his K% really jumped out at me. Although Bryant hit 26 home runs on the year, I began to wonder if there were any comparable seasons. Now the only criteria I used for comparison was: (1) as many or more home runs (26) and (2) equal or greater K%. Only 13 other players met this criteria since 2001 and they are listed in the table below.

Name Year G PA HR RBI AVG OBP K% BB% WAR
Kris Bryant 2015 151 650 26 99 0.275 0.369 30.6 11.8 6.5
Chris Davis 2015 157 656 45 112 0.258 0.355 31.4 12.3 4.9
Chris Carter 2014 145 572 37 88 0.227 0.308 31.8 9.8 1.8
Chris Davis 2014 127 525 26 72 0.196 0.300 33.0 11.4 0.8
Chris Carter 2013 148 585 29 82 0.223 0.320 36.2 12.0 0.5
Adam Dunn 2013 149 607 34 86 0.219 0.320 31.1 12.5 0.3
Pedro Alvarez 2012 149 586 30 85 0.244 0.317 30.7 9.7 2.2
Adam Dunn 2012 151 649 41 96 0.204 0.333 34.2 16.2 2.0
Mark Reynolds 2011 155 620 37 86 0.221 0.323 31.6 12.1 0.1
Adam Dunn 2010 158 648 38 103 0.260 0.356 30.7 11.9 3.0
Mark Reynolds 2010 145 596 32 85 0.198 0.320 35.4 13.9 1.7
Mark Reynolds 2009 155 662 44 102 0.260 0.349 33.7 11.5 3.3
Mark Reynolds 2008 152 613 28 97 0.239 0.320 33.3 10.4 1.3
Ryan Howard 2007 144 648 47 136 0.268 0.392 30.7 16.5 3.1

Besides an awfully high K%, for which he ranks 23rd overall since 2001, out of all the players on this list, he posted the most impressive WAR. He’s also in some pretty elite company with respect to power hitters. There are four 40+ home run seasons on that list and many 30+ homer seasons. In addition to providing value with his bat, he also provided a positive UZR rating at a highly demanding defensive position. This combination is what made Kris Bryant so attractive to teams since the 2010 draft.

Using the same player list as above, I looked at their seasonal BABIPs, and I found one particular season of interest. Bryant’s 2015 season. Bryant posted a 0.381 BABIP this year, and the next-closest player on the list was Mark Reynold’s 2009 season at 0.338 which is still quite a difference. Looking at Mark Reynold’s seasonal stats from 2008 to 2011, his batting average follows the same pattern as his BABIP.

Name Year BABIP
Kris Bryant 2015 0.381
Chris Davis 2015 0.315
Chris Carter 2014 0.267
Chris Davis 2014 0.242
Chris Carter 2013 0.311
Adam Dunn 2013 0.266
Pedro Alvarez 2012 0.308
Adam Dunn 2012 0.246
Mark Reynolds 2011 0.266
Adam Dunn 2010 0.329
Mark Reynolds 2010 0.257
Mark Reynolds 2009 0.338
Mark Reynolds 2008 0.323
Ryan Howard 2007 0.328

And a plot showing the relationship between AVG and BABIP (data from 2001 to 2015). There is an increasing relationship between the two, but there is some pretty wide variation. Nonetheless, I’ve highlighted Bryant’s data point from the 2015 season in red and it’s pretty clear that it represents an outlier for his batting average.

If we consider that the players listed in the tables above are from the same pedigree, their career BABIPs average out to around 0.298. Now I’m not saying Kris Bryant is going to follow the same trend, but based on the strikeout rate he posted this year he’s very aggressive at the plate and I know we are going to expect that inflated BABIP to come back down to Earth so I think we can expect some regression next year. As a reference Danny Santana posted a BABIP of 0.405 in 2014 only to drop down to 0.290 this year which saw his WAR plummet from 3.3 to -1.4. I looked at the relationship between HR, SB and a few other stats and batting average showed the highest correlation with BABIP from the stats I looked at. Based on this I expect his batting average will be the most likely to be affected with a downfall of BABIP. I really don’t think the home runs are going to go anywhere, but I think we can likely expect to watch that batting average fall. It remains to be seen how this will affect his peripheral stats, but as long as he continues providing solid defense at the hot corner he is going to provide lots of value on a major-league roster. I’m sorry to say Cubs fans I think you should expect some offensive woes next year.


Different Aging Curves For Different Strikeout Profiles

What follows will look at aging curves as they relate to players with specific strikeout profiles. Specifically, we will look at how wOBA ages for players that strikeout more than the league-average strikeout rate and less than the league-average strikeout rate.

Through the research that is presented in this post, two points will be proven:

  1. Players of different strikeout profiles age—their wOBAs change—at different rates.
  2. The aging curve for players of different strikeout profiles has changed over time.

Before I present the methodology, the research that was conducted, and their conclusions, I want to give a big thank you to Jeff Zimmerman, who has not only done a lot of research around aging curves, but has also helped me throughout this process and pushed me in the right direction several times when I was stuck. Thank you.

Population

In order to give a non insignificant amount of time for a player’s wOBA to stabilize, but not place the playing time threshold for plate appearances so high that we artificially limit the population even more than it naturally is at the ends of the age spectrum, I looked at all player season from 1950 to 2014 where a player had a minimum of 600 plate appearances for the first aging curve in this post. The second aging curve in this post looks at all player seasons from 1990 to 2014 with a minimum of 600 plate appearances.

Now that we have our population, we need to split our population into two groups: players that strikeout more than league average and players that strikeout less than league average.

Because the league average strikeout rate of today is very different than it was 65 years ago, we can’t look at a player’s strikeout rate from 1950 and compare it to the league average strikeout rate of today.

In order to divide the population into two groups, I created a stat that weighs a player’s strikeout rate against the league average strikeout rate for the years that they played. For example, if a player played from 1970 to 1975, their adjusted strikeout rate would reflect how their strikeout rate compares to the league average strikeout rate from 1970 to 1975.

Players were then placed into two buckets based on their adjusted strikeout rate: players that struck out more than league average and players that struck out less than league average.

Methodology

There has been a lot of discussion over the years about the correct methodology to use for aging curves. This conversation has had altruistic intentions in the sense that it’s aim has been to minimize the survivorship bias that is inherent in the process, and, through the progress that has been made over the years, this study uses what the author has found to his knowledge to be the best technique to date. This article by Mitchell Lichtman summarizes a lot of the opinions.

While there is a survivorship bias inherent in any aging curve, the purpose of the different techniques used to create aging curves is to minimize the survivorship bias wherever possible.

What We Don’t Want In an Aging Curve 

An aging curve is not the average of all performances by players of specific ages. For example, say you have a group of 30-year-old players that have an average of a .320 wOBA and group of 29-year-old players that have an average of a .300 wOBA.

The point of an aging curve is to see how a player aged, not how they played. The group of 30-year-old players has a high wOBA because they are a talented group of players; they lasted long enough to play until they are 30. As they aged from the previous year, when they were 29 to their current age 30 season, they lost the bottom portion of players from their player pool. These are the players that couldn’t hang on any longer, whether it be because of a decline in defense, offense, or a combination of both. This bottom portion of players lower the wOBA of the current 29-year-old population through their presence and raise the wOBA of the 30-year-old population through their absence.

At the same time, the current 30-year-olds aged from their age-29 season to their age-30 season. Sure, there may be players who had a better age-30 season than age-29 season, but the current group of 30-year-olds, as a whole, still played worse at 30 than they did at 29.

When you look at the average of a particular age group, in this case 30-year-olds, you only see the players that survived, and, because they no longer play, you leave behind the players that are hidden from you sample. The method that follows resolves this issue to an extent.

What We Do Want In an Aging Curve

This study uses the delta method which looks at the differences of player seasons (i.e. a players age 29 wOBA minus their age 28 wOBA) and weighs those differences by the harmonic mean of the plate appearances for each pair seasons in question.

I would explain this further, but Jeff Zimmerman does an excellent job of this in a post on hitter aging curves that he did several years ago. While Jeff Zimmerman looked at RAA, which is a counting state, the methodology is basically the same for our purposes and wOBA, which is a rate stat:

In a nutshell, to do accurate work on this, I needed to go through all the hitters who ever played two consecutive seasons. If a player played back-to-back seasons, the RAA values were compared. The RAA values were adjusted to the harmonic mean of that player’s plate appearances.

Consider this fictional player:

Year1: RAA = 40 in 600 PA age 25
Year2: RAA = 30 in 300 PA age 26

Adjusting to harmonic mean: 2/((1/PA_y1)+(1/PA_y2)) = PA_hm
/((1/600)+(1/300)) = 400

Adjust RAA to PA_hm: (PA_hm/PA_y1)*RAA_y1 = RAA_y1_hm
(400/600)*40 = 26.7 RAA for Year1
(400/300)*30 = 40 RAA for Year2

This player would have gained 13.3 RAR (40 RAA – 26.7 RAA) in 400 PA from ages 25 to 26. From then, I then would add all the changes in RAA and PA together and adjust the values to 600 PA to see how much a player improved as he aged.

Findings

Below is an aging curve by strikeout profile for all player seasons with over 600 plate appearances in a season from 1950 until 2015.

Screen Shot 2015-04-18 at 1.23.52 PM

We can see several findings immediately:

  1. Players do age differently based on their strikeout profile.
  2. Players that strikeout more than league average peak at 23.
  3. Players that strikeout less than league average take longer to hit their peak—their age 26 season.
  4. Players that strikeout more than league average age better than players that strikeout less than league average.

From a historical perspective, this graph is fun to look at, but the way the game was played over half a century ago is eclipsed by societal evolutions that today’s players benefit from.

To give us a more realistic idea of how today’s players age relative to their strikeout rate, I made another graph the at looks at player seasons from 1990 to 2014.

Screen Shot 2015-04-18 at 1.40.36 PM

What we find in this graph, which is more current with today’s style of play, is that players still age differently dependent on their strikeout profile, but not in the same way that they did in the previous sample.

Players that strikeout more than league average still peak earlier than players that strike out less than league average, but in this more current population of players, players that strikeout more than league average peak very early—their age 21 season. This information would reciprocate the sentiment that has been conveyed through recent work that suggests that the aging curve has changed to the point that players peak almost as soon as when they enter the league.

The peak age for players that strikeout at below league average rates is still 26, but whereas this group aged more poorly than the strikeout heavy group in our previous population, players that strikeout at below league average rates now age better than their counterparts.

Conclusions

This information can make material differences for our overall expectations and outlooks on players.

Previous knowledge would suggest that players like George Springer and Kris Bryant—players who have exorbitant strikeout rates—are still on the climb as far as their talent goes, but this information shows that these players may already be at/close to their peaks or on the decline as far a their wOBA is concerned.

This information also shows that we should be patient with prospects that have a penchant to put balls is play; while they peak more quickly than they did in the previous population, they take longer to develop than players with more swing and miss in their game, and when they do start to decline, there isn’t much need to worry, because their climb from their peaks will be gradual.

Like many other studies that have looked at new aging curves, this study confirms that players/prospects peak earlier now than at any other point throughout history, but it also shows that a player’s trajectory upward and downward is dependent on characteristics specific to their approaches at the plate.

Devon Jordan is obsessed with statistical analysis, non-fiction literature, and electronic music. If you enjoyed reading him, follow him on Twitter @devonjjordan.


The Chicago Cubs and the Terrible, Horrible, No Good, Very Bad Junior Lake Season

The future is bright on the North side of Chicago. As Rany Jazayerli pointed out this week on Grantland, that future is especially bright in the batter’s box. With an absolute stud to build around, arguably the best bat in the minor leagues right now, a 24-year old short stop who has been worth over ten wins in his career so far, and seemingly every single middle infield prospect in the world, even the biggest curmudgeon on TV seems to be enthusiastic about the Cubs future. However, if this article were written a year ago today, there would be another name that Cubs fans would be screaming at me for leaving off, Mr. Junior Lake. While Lake was not the biggest prospect in the Cubs’ system, when he burst on to the scene last July, excitement was high. It took him only five games to tie a major league record, as no player has ever had more than the 12 hits he garnered through his first five games.

After six games, Lake had an article of his own on FanGraphs, (deservedly) espousing his hot start, while (prophetically) looking at a few red flags in Lake’s game (more on that later). In those six games he slashed .519/.536/.852 with a pair of home runs and three doubles. He even continued to hit well for the remainder of the season, finishing with a wRC+ of 110 and despite below average defense in the field, was still worth over a win to the Cubs for the 64 games in which he appeared. Coming into this season, Lake was a 23-year old with a decent upside who had Cubs’ fans excited for the future.

Cut to: August 13, 2014.

Lake has lost his regular spot in the lineup, and no one has deserved to lose their spot in the lineup more this season. Now Lake may bounce back to be a decent contributor for future iterations of the Cubs (again, more on that in a little bit), but his numbers this season are incredibly poor. Check out his ranks (these will all be from the bottom ranks, as in first really means the worst in the league) in these essential statistics in 2014:

Stat Lake in 2014 League Rank (min. 300 PAs)
OBP .246 2nd
wOBA .269 11th
LD% 15.6 8th
wRC+ 66 10th
fWAR -0.7 6th

Being near the bottom of one of these statistics is hardly a death knell (check out the killer lineup that could be created with the lowest line-drive rates in the league), but if you’re at the bottom of the barrel across the board, it’s fair to say you’ve Schruted up your season in a big way.

So what has been the cause of Lake’s collapse at the plate? The answer is pretty simple. All that’s needed is a trip over to the plate discipline graphs on this very website. Once again using from the bottom ranks, check out some of Lake’s plate discipline statistics:

Stat Lake in 2014 League Rank (min. 300 PAs)
K% 33.4% 3rd
BB% 3.3% 7th
BB 10 T-1st
BB/K 0.10 1st
O-Swing% 43.0% 7th
Z-Swing% 77.2% 7th
Swing% 58.1% 4th
O-Contact% 43.3% 5th
Z-Contact% 74.5% 4th
Contact% 61.6% 3rd
F-Strike% 69.5% 1st
SwSt% 21.7% 1st

As someone who is neither here nor there on the Cubs (aside from a long-term bet in which I have them making the playoffs before the Astros), I think it’s fair to look at this man who has somehow combined a Pablo Sandoval-esque lack of patience at the plate with a Chris Carter-esque lack of contact on those reckless swings, and simply say, “I’m not even mad, that’s amazing.”

That duo isn’t easy to pull off. Of the top thirty highest swing rates among hitters with at least 300 plate appearances, only one other hitter (Mike Zunino) has a contact rate in the sixties, and Zunino’s swing rate is lower and his contact rate is higher than Lake’s. Not to mention that Zunino’s defense has actually made him worth two wins for the Mariners this season, while only George Springer has committed more errors in the outfield than Lake in 2014.

Lake’s Brooks Baseball profile is maybe the most depressing thing in Chicago since this guy.

His performance against fastballs is described as, “an exceptionally aggressive approach at the plate (-0.19 c) with a disastrously high likelihood to swing and miss (30% whiff/swing),” against breaking pitches, “an exceptionally aggressive approach at the plate (-0.32 c) with a disastrously high likelihood to swing and miss (50% whiff/swing),” and against offspeed pitches, yeah, “an exceptionally aggressive approach at the plate (-0.65 c) with a disastrously high likelihood to swing and miss (55% whiff/swing).”

The man clearly needs a private lesson with Wade Boggs, although that might not even be enough. Interestingly enough, in his aforementioned piece on Lake last year, FanGraphs’ Bradley Woodrum spotted a couple of potential flaws that Lake would have to fix. Woodrum mentions Lake’s lack of plate discipline in the minor leagues, but he also touches on two other drawbacks to Lake’s game: his extremely “loud” swing, and his struggles with low sliders.

As far as the “loud” swing, scouting player’s swings is not my specialty, but his swing actually does seem a little toned down in 2014. Check out the gif used in last year’s FanGraphs piece showing Lake’s bat going crazy as the pitch comes in. Now here’s his toned down approach taken from the middle of this season. Well, toned down until he swings and misses, at least:

While his hands are still moving, they don’t seem to be doing so with the same reckless abandon as last year. That would seem to be a good sign, one that Lake is willing to tinker with his swing to get better results. As I said though, I am far from a scout, and would be curious to hear feedback on what others think about his swing.

In terms of his struggles with sliders, those have only been exasperated in 2014, as he has derived the fourth-lowest value against sliders this season, at -7.4 runs. And considering that that pitch value is a cumulative statistic and the three men in front of him all have more than 100 more plate appearances than Lake in 2014, it’s fair to say Lake has struggled as much as any hitter in baseball against the slider in 2014.

With Arismendy Alcantara having made a far smoother transition to the outfield (believe it or not, Lake was yet another middle infield prospect originally), and Jorge Soler/Kris Bryant due to be called up in the not-too-distant future, one has to wonder whether Lake’s shot at as a member of the Cubs is through with. The best option likely would have been to send him down to Triple-A about a month ago, as sitting on the bench in the major leagues will neither help his confidence, nor give him the chance to get in regular swings every day, and begin to tinker with his swing etc.

There is some evidence that Lake far prefers to play left field instead of center field, slashing .312/.333/.561 in his 44 games in left field, but this seems a little bit more noise than signal. However, given that the Cubs really have no motivation to win at this point, their best option may well be to put Chris Coghlan, their current left fielder and a useful piece for say the Oakland A’s, on waivers, and see what they have with Lake in left field for the remainder of the season. With a month and a half of season left, the Cubs could see if those splits really are statistically significant, and if they were, the Cubs could have yet another piece of their future lineup in place. And if not, there are plenty of reinforcements on the way.


What the Cubs Need to Do to Be Successful

The Chicago Cubs have gotten off to a very slow start in the 2013-14 season scoring a total of 9 runs in their first 5 games and as a result of that they are 1-4. The buzz around the city of Chicago is all about the excitement of top prospects Javier Baez, Albert Almora, and Kris Bryant tearing up minor league pitching and rapidly moving up in the Cubs System. All of these players have fantastic stats but the stats don’t truly matter until these players can be productive big league players. The problem is is that these prospects have shown day in and day out that they are ready to move on to the bigs. Almora, might not be quite there yet but Baez and Bryant have proven they are by dominating minor league pitching and posting good spring training numbers. Cubs GM Theo Epstein won’t pull the trigger on sending these guys up. Bringing these players up will significantly improve the quality of the team but many more changes will need to take place in order for the Cubs to be a team to win games on a consistent basis. Here are 3 other things that need to happen for the cubs to start their path to being successful

1. The cubs need to find a reliable, all-around, everyday 2nd baseman. There are many different solutions the their problem at 2nd but first let’s establish what the problem is. Darwin Barney has proven that he is an excellent fielding 2nd baseman but he is an absolutely horrendous hitter. In 2013, Barney posted an atrocious slash line of .208/.266/.303. Not only does this show that he rarely gets hits or gets on base, but when he does it’s mostly because singles. The Cubs have many possible solutions to this problem. One possible solution is to bring up Javier Baez and play him at short and Starlin Castro at 2nd or vice versa. Doing this might slightly weaken the 2nd base spot defensively, but drastically improve it offensively. With the Cubs pitching being surprisingly good in the first few games of 2014, their offense is a glaring problem and Baez would improve it instantaneously.

Another solution would be to slide Luis Valbuena over to 2nd and make Mike Olt the everyday 3rd baseman. Currently, Olt and Valbuena are splitting time at third which is detrimental to the team because both players have shown offensive value to the cubs. Valbuena had an excellent eye and has proven to be adept at drawing walks. He also has shown solid power as he hit 12 homeruns in 108 games in 2013. Olt has also shown the ability to hit for power as he had 5 homeruns in a very good spring training that earned him a spot on the opening day roster. Either of these solutions would be a much better fit for the Cubs then having Barney as the everyday 2nd baseman.

2. If the Cubs want to be good now, their bullpen needs to be consistent, and deeper. The bullpen has been a problem for the Cubs for a very long time. However in 2014 they might show some signs of improvement. In 2013, reliever Pedro Strop Posted a solid 2.83 ERA in 35 innings with the Cubs. In his time in Chicago, he only gave up 11 earned runs, 5 of which were in one performance. Along with solid numbers Strop possesses a 97 MPH power sinker in addition to his best pitch which is his slider. Strop will be put into a much bigger role this season and if the cubs want to succeed he will need to continue to pitch at a high level. In the offseason the cubs also signed lefty Wesley Wright and Jose Veras who in recent history have proven themselves as reliable bullpen options to their clubs. Players like Brian Schlitter and Hector Rondon will also need to step up for the Cubs. If Strop can continue pitching at a high level and the rest of the pen can consistently pitch in late innings. The Cubs will improve as a team very much.

3. Lastly if the Cubs want to succeed Anthony Rizzo and Starlin Castro must have bounce back years. There are many things that I could criticize about these 2 players but there a few problems in their games that are in the most need of fixing. In 2013 Rizzo only hit .233 if Rizzo continues to hit in the heart of the cubs line up, a .233 average is unacceptable. If he was hitting 50 homeruns it might be a different story but .233 with only 23 HRs isn’t going to cut it. In order for the Cubs to succeed, Rizzo will either need to hit 10-15 more homers or improve is average by around 30 points.

Starlin Castro is a much bigger problem for the Cubs. Spending most of the season in the 3 spot, Castro posted a weak slash of .245/.284/.347. Castro’s numbers were only a bit better than Barney’s which makes him a big problem. In addition to his poor offensive play, Castro has been an extremely inconsistent defensive SS his entire career. There is optimism for Castro though. In Castro’s first 2 full big league seasons, he was voted to the All-Star Game and hit close to .300 in both of those seasons. Castro has shown in his career that he has the ability to hit, the question. is will he be able to have seasons reminiscent to his all-star years. Only time will tell for Castro but if he can bounce back along with Rizzo the Cubs might actually be a legitimate team.

Although many things need to happen for the Cubs to be a playoff contender, fans should be optimistic for the future. With a farm system fortified with elite prospects throughout and an improving bullpen, the cubs need their “key players” to perform at a higher level. If all of these things can happen, there might be October baseball played at Wrigley sometime in the near future.