What About Batted Ball Spin?
Recently, for my job, I got to mess around with Statcast data for fly balls. I have a good job. As part of the task I was working on, I attempted to calculate the maximum heights and travel distances of fly balls using my extensive ninth-grade physics knowledge. Now, I was excellent at ninth-grade physics, especially kinematics, but my estimates, compared to the official Statcast numbers, were terrible. Figuring the discrepancies must be due to air resistance, I did my best to remember AP physics (with the help of NASA) and adjusted my calculations for drag. The results improved, but were still way off. There are many additional factors that affect the flight of a fly ball such as wind, air temperature and altitude, but I think the biggest factor causing the inaccuracy of my estimates is batted-ball spin. (If you disagree, let me know in the comments.) Exit velocity and launch angle get all the attention when discussing batted-ball metrics, but the data I was looking at suggested that batted-ball spin merits attention too. Are there batters who are consistently better at spinning the ball than others, and if so, is this a valuable skill?
We already know that balls hit with top-spin sink faster than normal while balls hit with back-spin stay in the air longer. It’s unclear, though, whether it’s better for the batter to hit the ball with more or less spin, and whether top-spin or back-spin is more beneficial. Back-spin would seem to be better if you are a home-run hitter while top-spin might be more beneficial if you are a line-drive hitter.
As far as I know, Statcast doesn’t measure batted-ball spin, and if it does, it’s not available on Baseball Savant. So to act as a proxy for spin, I calculated the estimated travel distance (adjusted for air resistance) from its launch angle and exit velocity for every line drive, fly ball and pop up hit in 2016 and subtracted this number from the distance estimated by Statcast. The bigger the deviation between these two numbers, the faster the ball was spinning, theoretically. Balls with positive deviations (actual distance > estimated distance) must have been hit with back-spin and balls with negative deviations (actual distance < estimated distance) must have been hit with top-spin.
The following table shows the 20 hitters (min. 50 fly balls hit) who gained the most distance on average in 2016 due to back-spin:
| Batter Name | Number of batted balls | Avg Statcast Distance (ft) | Avg Estimated Distance (ft) | Avg Deviation (ft) |
| Travis Jankowski | 87 | 254 | 235 | 19 |
| DJ LeMahieu | 213 | 282 | 264 | 18 |
| Carlos Gonzalez | 226 | 293 | 276 | 17 |
| Daniel Descalso | 102 | 285 | 270 | 14 |
| Max Kepler | 150 | 285 | 271 | 14 |
| Billy Burns | 108 | 234 | 221 | 13 |
| Rob Refsnyder | 57 | 269 | 257 | 12 |
| Jarrod Dyson | 98 | 243 | 232 | 11 |
| Martin Prado | 256 | 262 | 251 | 11 |
| Ketel Marte | 154 | 250 | 239 | 11 |
| Justin Morneau | 73 | 278 | 268 | 11 |
| Gary Sanchez | 66 | 323 | 312 | 11 |
| Tyler Saladino | 107 | 270 | 260 | 10 |
| Phil Gosselin | 77 | 264 | 253 | 10 |
| Jose Peraza | 107 | 257 | 248 | 10 |
| Mookie Betts | 311 | 279 | 270 | 9 |
| Melky Cabrera | 280 | 271 | 261 | 9 |
| Ichiro Suzuki | 137 | 251 | 242 | 9 |
| Omar Infante | 68 | 269 | 261 | 9 |
With a few exceptions, these are not home-run hitters. This group of 20 players averaged 8.25 home runs in 2016. The players who are getting the most added distance on their fly balls are not the ones who need it most. (Note: four players on this list and three of the top four players played their home games at Coors Field. Did you forget that Daniel Descalso played for the Rockies last year? Me too.)
What about the other end of the spectrum? The following are the 20 players who lost the most distance on average in 2016 due to top-spin:
| Batter Name | Number of batted balls | Avg Statcast Distance (ft) | Avg Estimated Distance (ft) | Avg Deviation (ft) |
| Colby Rasmus | 136 | 285 | 306 | -21 |
| Tommy La Stella | 72 | 273 | 294 | -21 |
| Brian McCann | 195 | 273 | 294 | -22 |
| Todd Frazier | 248 | 276 | 297 | -22 |
| Jorge Soler | 88 | 278 | 300 | -22 |
| Brian Dozier | 263 | 287 | 309 | -22 |
| Curtis Granderson | 238 | 284 | 306 | -22 |
| Franklin Gutierrez | 76 | 304 | 327 | -23 |
| James McCann | 131 | 277 | 300 | -23 |
| Miguel Sano | 158 | 301 | 324 | -23 |
| Khris Davis | 213 | 303 | 326 | -23 |
| Freddie Freeman | 269 | 289 | 312 | -23 |
| Mike Napoli | 205 | 290 | 315 | -25 |
| Chris Davis | 207 | 304 | 330 | -26 |
| Tyler Collins | 54 | 270 | 296 | -26 |
| Ryan Howard | 129 | 306 | 334 | -28 |
| Kris Bryant | 284 | 281 | 309 | -28 |
| Jarrod Saltalamacchia | 96 | 290 | 321 | -31 |
| Mike Zunino | 63 | 295 | 327 | -33 |
| Ryan Schimpf | 122 | 298 | 331 | -33 |
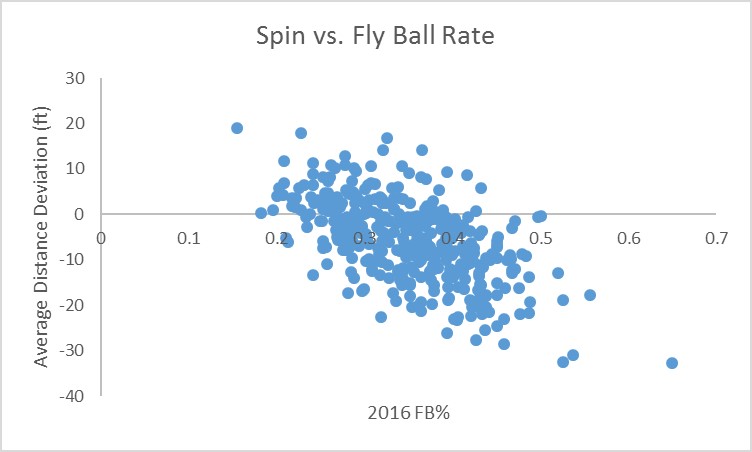
Kris Bryant, Miguel Sano, Ryan Schimpf: this list is full of extreme fly-ball hitters with an average of 24 home runs last year. The scatter plot below with a correlation of -0.58 shows the relationship between batting spin and fly-ball percentage for all players in 2016.
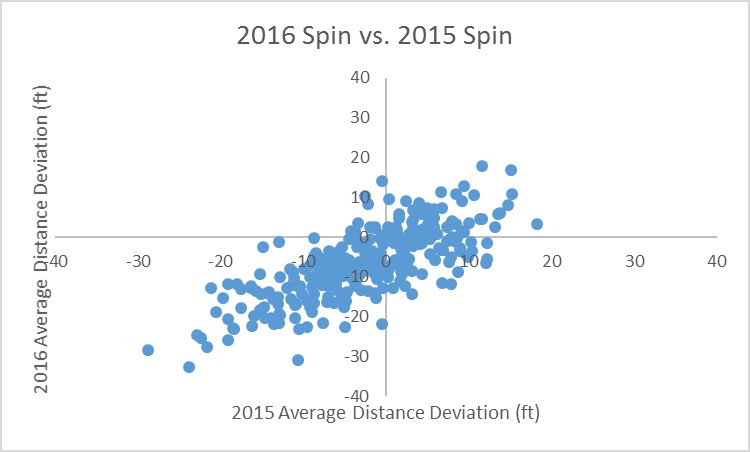
And this isn’t just a one-year phenomenon. I was relieved to find out that the correlation between 2016 average distance deviations and 2015 average distance deviations is 0.75. Players who hit balls with a lot of spin in 2015 overwhelmingly did so again in 2016. Again, the plot below shows the strong relationship.
Mechanically, this is not such a surprising result. Players with a more dramatic uppercut swing (like a tennis swing) will impart more top spin onto the ball while the opposite should be true for players with a more level swing.
It remains to be seen whether this knowledge is useful in any way or if it falls more into the “interesting but mostly irrelevant” category of FanGraphs articles. There is essentially no relationship between a player’s average distance deviation and his wRC+ (correlation = -0.13), so we cannot say that spinning the ball more or in either direction leads to better results. And I imagine it is difficult to alter one’s swing to decrease top-spin while still trying to hit fly balls. At best, maybe this is a cautionary tale for players who want to be more hip and trendy and hit more fly balls like James McCann (FB% = 0.41), but don’t have the raw power to absorb a loss of 28 feet per fly ball (HR = 12, wRC+ = 66).
Let me know what you think in the comments.
Good article. This is an important topic. I did some work on this last year (link below). I used actual LA and EV data for 2015 and 2016 to come up with average/model distance estimates to the tenth for both (excluded all balls at Coors Field). I called mine MUD – Mean Unexpected Distance. One adjustment that needs to be made is for directional bias. In other words a ball hit to left center for a RH batter will tend to have more pure backspin than those hit to say right (side spin and backspin) and left (sometimes more topspin sidespin). I came up with directional adjustments based on location. My original bias estimates were based on the Baseball Savant text description (Right, Center, Left etc). I discovered using the actual numerical angles in the Statcast data were more accurate for the directional bias adjustments so I switched to those. I can dig them up if you are interested.
The biggest takeaway for me was one I was expecting – that the best (most consistent) hitters are hitting the ball very flat relative to average (lower MUD values). So spin adds distance but the cost > benefit for the majority of hitters.
Also, I understand (not 100% sure) that teams have access to the actual spin rate data and that it is just not publicly available. It would be interesting to see how the actual compares to model.
http://www.fangraphs.com/community/the-home-run-conundrum-is-it-a-matter-of-how-you-spin-it/
Always good to get confirmation of my ideas by other baseball analysts who performed similar research independently. Yours was a good article as well, and I will look into incorporating batted ball directions as I proceed. And yes, would definitely be nice to get the actual spin values.
In terms of properly modelling the ballistics of a batted ball, accounting for spin will play a factor in the predictions, in the form of lift generated by backspin and a potential decrease in drag as the rotating seams could help lower the turbulent wake of the ball under certain conditions.
I haven’t done the actual analysis, but I suspect that spin has a much lower order effect on batted ball distance than launch angle and exit velocity. Fundamentally, when a batter hits a baseball, the kinetic energy of the pitch/swing is converted into the kinetic energy of the batted ball, with losses to friction and damping. The key is to maximize the energy transfer to the translational motion of the baseball, rather than it’s rotation. The tradeoff of getting more spin at the expense of exit velocity just isn’t worth it.
So, strictly speaking, players with consistently high spin rates on their batted balls are not being efficient with the energy transfer, although body kinematics add limitations on swing paths and the translation of human motion to bat velocity, so that’s not to say that those guys have found an optimal swing to suit their particular skill set and physical ability.
I’m not sure there is anything particularly interesting to be found in the relationship between batted ball spin and batted ball distance, but the real treasure might be below the surface, if you study the root cause of batted ball profiles, in the specific swing mechanics and the pitch/bat vector differences.
I love this type of analysis, and actually had started something like this to see if I could find a proxy for topspin vs. backspin. However, I gave up on this analysis once I realized that the Statcast distance data was based upon where the ball ultimately was fielded, not where it landed.
http://m.mlb.com/glossary/statcast/hit-distance
What this means is that the listed distances for singles, doubles, and triples to the outfield will include how far the ball hopped or rolled before it was fielded. So if Jarrod Dyson hits a flare down the line that lands 210 feet from home plate, but rolls another 100 feet to the corner before it gets fields, Dyson gets credited with a distance of 310 feet.
I would recommend running the analysis separately for home runs, air outs, and other OF hits (1B, 2B, and 3B). Hopefully this would still leave some meaningful residuals which could point towards possible differences in batted ball spin.
Thanks for pointing this out. To me it is not very clear from the definition. While it clearly states “lands” in the first paragraph, it also has an “or” in the 2nd paragraph implying that either *can* be recorded. It is very confusing. I’m wondering if the “ends up” is to calculate the defensive player metrics?
“Hit Distance represents the distance away from home plate that a batted ball lands — whether by hitting the ground, the seats, the wall or a fielder’s glove.
Average Hit Distance (aDST) is calculated by: the sum of all Hit Distances, divided by all Batted Ball Events.
Statcast can record Hit Distances at the moment a ball touches the ground or where a ball ultimately ends up. A batted ball’s farthest distance relative to home plate arguably tells the most accurate story of a Batted Ball Event.”
Yeah this is a good catch and definitely changes things. Home runs and fly ball outs should be fine, but anything with a significant roll will end up with a much higher distance than is predicted based on launch angle and exit velocity. I’ll look into making these changes and seeing how it affects the results.
My opinion the biggest thing that affects HR/FB rate is the percentage of fly balls that are pulled. I think it’s something like 6% of balls to center are homers, 3% opposite field, and like 28% to the pull side. I always figured this was because pulled fly balls tend to be struck with more authority than opposite field flys, and are hit to a short part of the park unlike those to center.
But it’s possible spin might have something to do with it too. Might be opposite field flys have too much ‘slice’ to them, while perhaps pulled flys have purer backspin or maybe even a touch of ‘draw’ to them, and I know some of the best golfers hit a slight draw on their long drives off the tee